Linear or Spline interpolation of 'staircase' indicator data ?


Hi, This is a MA indicator that is reading MA off a higher TF and used in a lower TF...

In its current state the line appears as a staircase, drop it on a 15M TF and you'll see.

I want it smoothed so that there is a distinct change for every low TF bar, iMA can be used as suggested in the code but

I would prefer linear interpolation, or better yet Spline... I'm almost there with the linear but the (total) lack of debugging capabilities in the editor got me stuck...

I think the problem is properly extracting the XY controlpoint values.

Suggestions ?

#property indicator_chart_window
//#property indicator_separate_window
#property indicator_buffers 7
#property indicator_color1 Aqua
#property indicator_color2 Red
#property indicator_color3 Blue
#property indicator_color4 Silver
#property indicator_color5 Silver
#property indicator_color6 Silver
#property indicator_color7 Yellow

//---- input parameters
/*************************************************************************
PERIOD_M1   1
PERIOD_M5   5
PERIOD_M15  15
PERIOD_M30  30 
PERIOD_H1   60
PERIOD_H4   240
PERIOD_D1   1440
PERIOD_W1   10080
PERIOD_MN1  43200
You must use the numeric value of the timeframe that you want to use
when you set the TimeFrame' value with the indicator inputs.
---------------------------------------
PRICE_CLOSE    0 Close price. 
PRICE_OPEN     1 Open price. 
PRICE_HIGH     2 High price. 
PRICE_LOW      3 Low price. 
PRICE_MEDIAN   4 Median price, (high+low)/2. 
PRICE_TYPICAL  5 Typical price, (high+low+close)/3. 
PRICE_WEIGHTED 6 Weighted close price, (high+low+close+close)/4. 
You must use the numeric value of the Applied Price that you want to use
when you set the 'applied_price' value with the indicator inputs.
---------------------------------------
MODE_SMA    0 Simple moving average, 
MODE_EMA    1 Exponential moving average, 
MODE_SMMA   2 Smoothed moving average, 
MODE_LWMA   3 Linear weighted moving average. 
You must use the numeric value of the MA Method that you want to use
when you set the 'ma_method' value with the indicator inputs.

**************************************************************************/
extern int TimeFrame=240;
extern string Currency;
extern int MAPeriod=8;
extern int ma_shift=0;
extern int ma_method=MODE_SMA;
extern int applied_price=PRICE_CLOSE;
extern bool UseLevels=False;
extern int Level0=0;
extern int Level1=0;
extern int Level2=0;
extern int Level3=0;
extern int Level4=0;
extern int Level5=0;


double ExtMapBuffer1[];
double ExtMapBuffer2[];
double ExtMapBuffer3[];
double ExtMapBuffer4[];
double ExtMapBuffer5[];
double ExtMapBuffer6[];
double ExtMapBuffer7[];
double Buffer[];
   int i, limit;
  
//+------------------------------------------------------------------+
//| Custom indicator initialization function                         |
//+------------------------------------------------------------------+
int init()
  {
  //Draw();
 
//---- indicator line
   SetIndexBuffer(0,ExtMapBuffer1);
   SetIndexStyle(0,DRAW_LINE,STYLE_SOLID);
   SetIndexBuffer(1,ExtMapBuffer2);
   SetIndexStyle(1,DRAW_LINE,STYLE_SOLID);
   SetIndexBuffer(2,ExtMapBuffer3);
   SetIndexStyle(2,DRAW_LINE,STYLE_SOLID);
   SetIndexBuffer(3,ExtMapBuffer4);
   SetIndexStyle(3,DRAW_LINE,STYLE_SOLID);
   SetIndexBuffer(4,ExtMapBuffer5);
   SetIndexStyle(4,DRAW_LINE,STYLE_SOLID);
   SetIndexBuffer(5,ExtMapBuffer6);
   SetIndexStyle(5,DRAW_LINE,STYLE_SOLID);
   SetIndexBuffer(6,ExtMapBuffer7);
   SetIndexStyle(6,DRAW_LINE);

//----
   return(0);
 }
//+------------------------------------------------------------------+
//| MTF Moving Average                                   |
//+------------------------------------------------------------------+
int start()
  {

      Draw();
      

   return(0);
  }
//+------------------------------------------------------------------+


void Draw()
{
//-------------------

limit=Bars;//-IndicatorCounted();
   
  //ArrayInitialize( ExtMapBuffer1, 0) ;
  //ArrayInitialize( ExtMapBuffer2, 0) ;
      i= limit;
      
      double X,Y,Xa,Ya,Xb,Yb;
      int step, Xpointc, Xpointp;
      while(i>=0)
         {     
         int Bar_Shift=iBarShift(NULL,TimeFrame,Time[i],false);
         ExtMapBuffer2[i]=iMA(Currency,TimeFrame,MAPeriod,ma_shift,ma_method,applied_price,Bar_Shift) ; //Red line
         //ExtMapBuffer1[i] = ExtMapBuffer2[i]+0.001;//iMAOnArray(ExtMapBuffer2,0,(TimeFrame/Period()),0,MODE_LWMA,i);          
         
         //Linear interpolation equation:
         //Controlpoints (known data) are: Xa,Ya and Xb,Yb
         //For any given value of X, Y will be:
         //Y = Ya + (X - Xa) x ( (Yb - Ya) / (Xb - Xa) )
         
         //Bar_Shift=iBarShift(NULL,TimeFrame,Time[i],false);
        
         i--;
         }  
         //
       i= limit;  
      while(i>=0)
         {          
         if(ExtMapBuffer2[i] != ExtMapBuffer2[i+1] )
            {
            Xpointc = i;
            Xpointp = i+100;
            }
         
         X=i; 
         //Xpointc = Bar_Shift;
         //Xpointp = Bar_Shift+1;
         Xa = Xpointc; Ya = ExtMapBuffer2[Xpointc];//Current known XY data
         Xb = Xpointp; Yb = ExtMapBuffer2[Xpointp];//Previous known XY data
         Y = Ya + (X - Xa) + ( (Yb - Ya) / (Xb - Xa) );
         ExtMapBuffer1[i] = Y; //Aqua line
       
    
         i--;
         }  
       
Comment("ddd:  ", Bar_Shift);
 

//-------------------
return(0);
}
Files:
 

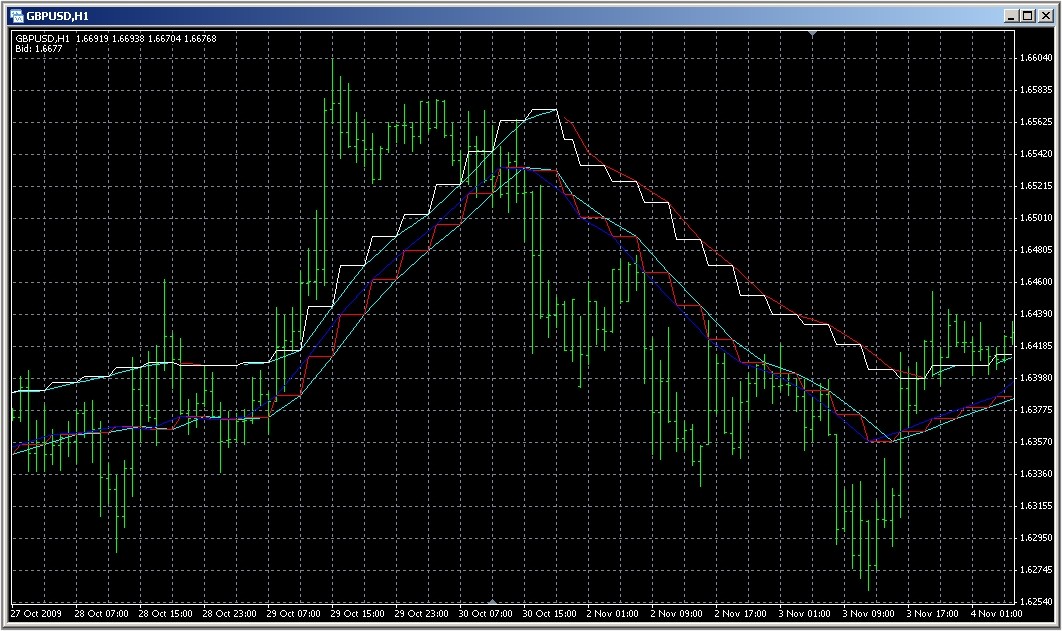
Ok there has been some progress. The interpolated data (Aqua line) is nice and smooth, and runs through the controlpoints of the source data (Red staircase).

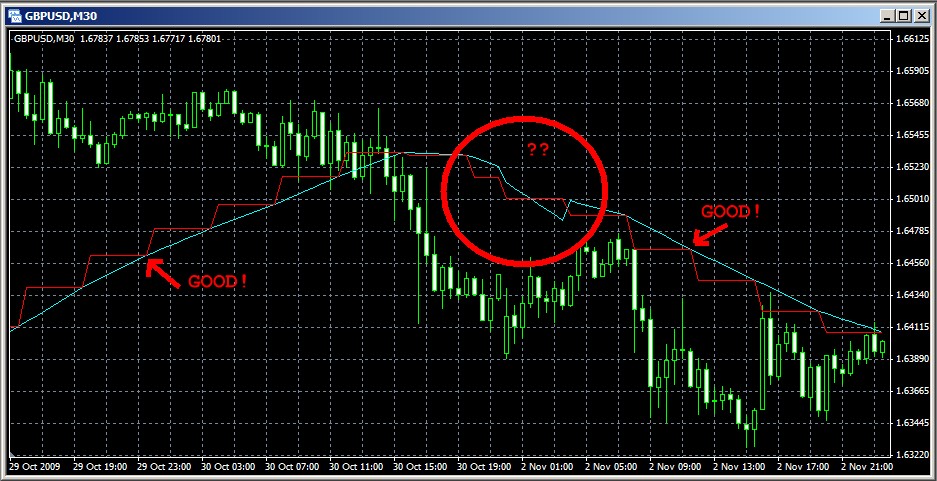
But there are the occasional glitch as can be seen in this picture... shouldn't be there. Can you spot the problem?


Lets say you want to see a 10EMA hourly on a 5m chart.

10 hourly periods == 10 hours

on 5 minutes, 10 hours is 120 bars.

So set a 120 period EMA on 5m and you're done.


No its not quite that simple... This was the very first thing I tried, but it isn't nearly as good as a true htf MA.

It falls short in two areas:

-More lag

-More ripple (change of direction)

In these two areas the true htf MA (based on the smoothed 'staircase') is far superior to just a slow ltf MA.

That slow ltf MA lags quite a bit, but worse than that is that its full of ripple (small signal reversals) which leads to 

uncertenty and false 'trade' signals. This is beacuse inherent in the steps is a hughe quantization error, which in other

applications would typically be undesirable, but here its what makes the indicator so good and smooth with practically NO ripple or false signals.

I think the power of a really good htf MA is grossly underestimated... Possibly one of the most powerfull and useful indicators ever.

BTW to the left in the circle above you can see that one step is shorter due to missing bars.


Show us a screenshot of this version I made for you.


latest version in my next post below.

 
Strange that this worked for me at first, then stopped when I open up mt today. I realized what I left out. I forgot the SetIndexEmptyValue setting. here's the new file:


btw, did you move on to something else or did this not work for you at all? Any response would be appreciated. I found it useful.


And my last update. This one has example of smoothing both sides of the staircase.

Files:
 

Checked your version and it looks perfect on the chart, but...

-The loop counts backwards, in general I'd avoid doing that for various reasons.

-It fails on Visual backtest.

Anyhow I got mine working ok using a combination of methods, just need to fix the coloring / buffer alignment, and do a final check on monday to see how it handles live data (unfinished bar0 ).

This picture shows mine, in its current state (need to fix that bufferproblem), and yours below.


Files:
 
Once you understand DRAW_SECTION, it's easy to see why a backtest would fail. It doesnt actually fill the buffer with values, it just draws the line for you.
Here's something I had made when I started playing with the indicator. It does the in-betweening that DRAW_SECTION usually does but fills prices into buffer. You just have to change your buffer settings back to DRAW_LINE and make a call to this function before your start function returns. Not sure about that counting backwards thing you mentioned. You should share that knowledge sometime. Is it a backtest related issue(I don't do them).
Anyways good luck.

void EmulateDrawSection(double& buffer[])
{
   // if we want a price on every shift instead of zeros, 
   // then we need to emulate what draw section does and in-between the prices ourselves.
   
   int lastShift=-1;
   double c;
   for (int i=0;i<ArraySize(buffer);i++)
   {
      if(buffer[i]>0)
      {
         if(lastShift >-1)
         {
            c=(buffer[i]-buffer[lastShift]) / (i-lastShift);
            for(int j=1;j<(i-lastShift);j++)
            {               
               buffer[lastShift+j]=buffer[lastShift] + c*j;
            }
         }
         lastShift=i;
      }
   }
}
 

...Even the simplest of things are turning into a problem...

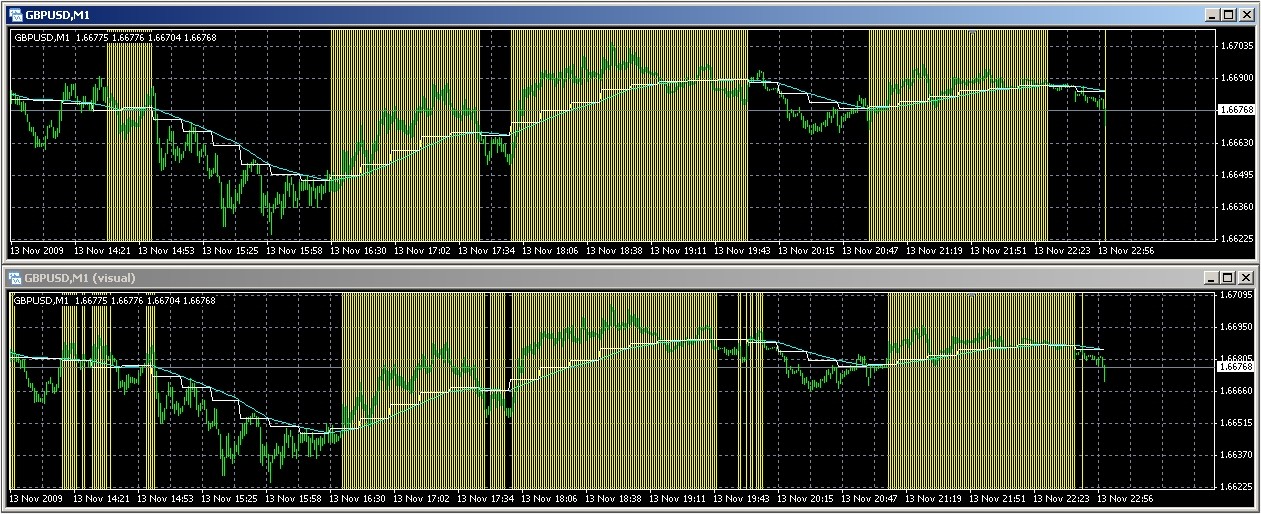
This time it is reading the indicator data from a test EA. Indicator and test EA attached.

I'm checking for rising slope on the blue line and marking it. This works perfect when done in a loop in the indicator.

But doing it in the test EA results in lots of noise etc, even though the blue line behaves as it should (no noise) in Visual test.

This should be as simple as reading the line value but apparently there is a Gremlin messing things up...

This image shows the indicator graph (top), and the result from the EA (bottom).

Why is this happening ??  I've done the same test on std indicators and it works correctly as expected. 


Files:
Reason: