2d surface?
I have a question. I wrote an EA, so I am testing its performance. I did a little
test with the "2d surface" feature. I've added a dummy variable that
doesn't change the output in any way. When I select the dummy variable for X and
some other variable for Y every row should be the same color, because the output
does not depend on the dummy variable. But as usual all I see is randomly placed
green squares. I thought this is meant to show the relation between the results
and the variables in X and Y axis not random green squares. Am I doing something
wrong?
- Any rookie question, so as not to clutter up the forum. Professionals, don't pass by. Nowhere without you - 6.
- Other timeframes
- My indicator is calculation 4 times every bar
bobef:
But as usual all I see is randomly placed green squares.
But as usual all I see is randomly placed green squares.
Did you wait for the test to finish? During the test, while it progresses through all the combinations of input data it's possible that you will see various "random" green squares. But in the end, yes, each you should see a collection of horisontal lines of green where each row should be only 1 color... Of course if your test depends on some internally calculated "random" data, aside from the input params, then you can see random green squares at the end of the test. Can't think of any other reason why you would see non-uniform green lines...
Yes, I did wait it to finish. The test depends only on the input parameters, so I can't think of any other reason... Plus I tested with smaller script with only two variables. One dummy and one included in the calculations. The rest are constants and the result is the same. See (x=dummy, y=other):
It's correct. Each rectangle in your screenshot showы the profit (or other output) on X=... and Y=... . What
another you wanna see ?
But the profit does not depend on the value of X, because dummy is not included
in the calculations at all. So for every value of Y the profit should the the same
no matter of X. In other words every line should be the same color or I am missing
something?
Tester does not know - depends profit on the value X or not. Tester is testing,
it not thinking "about nature of things" , tester do not open "black
box" of your creation.
Please, show screenshots of tester and mark up X and Y inputs are were. (in settings of optimization)
Please, show screenshots of tester and mark up X and Y inputs are were. (in settings of optimization)
Hmmmm... I can't understand. Probably it is my mistake but just in case consider the following code:
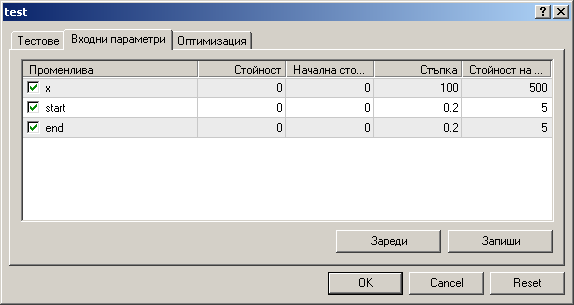
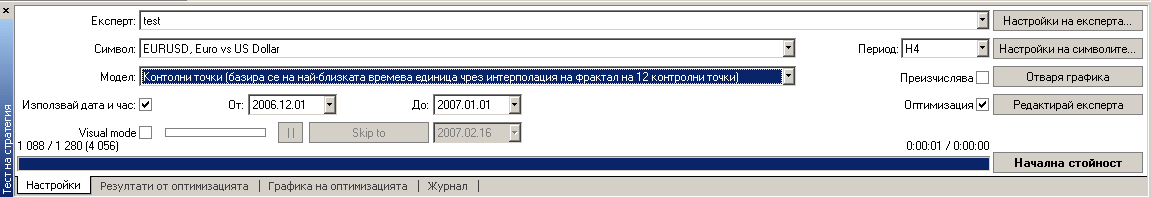
Optimization settings:
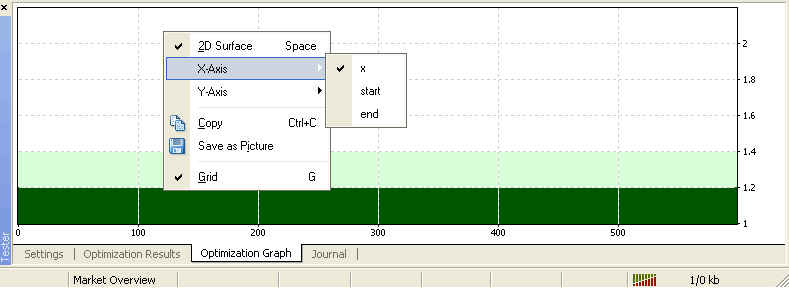
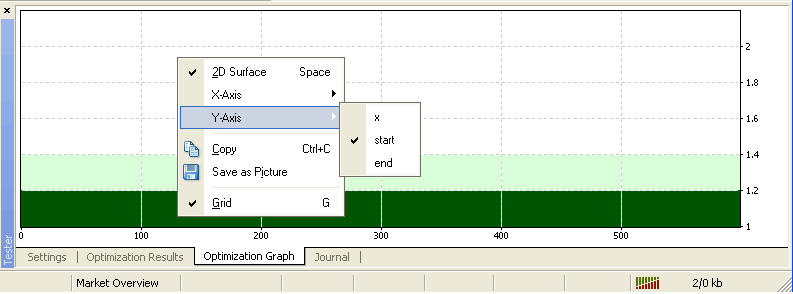
Results:
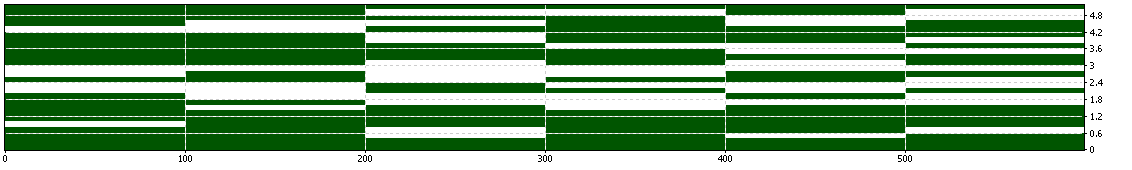
Now why the lines are not the same color? If I remove the end variable for example it looks right - everything the same color. But not if there are more variables. Like in the example above.
extern double x=0;
extern double start=0;
extern double end=0;

void start()
{
    if(OrderSelect(0,SELECT_BY_POS,MODE_TRADES)==false && Ask>=start && Ask<=end)
    {
        OrderSend(Symbol(),OP_BUY,1,Ask,0,0,Ask+25,NULL,0,0,Blue);
    }
}
Optimization settings:
Results:
Now why the lines are not the same color? If I remove the end variable for example it looks right - everything the same color. But not if there are more variables. Like in the example above.
Thanks. I change your code a little.
I would like to draw your attaention to this line
Then, I'v set inputs of optimization
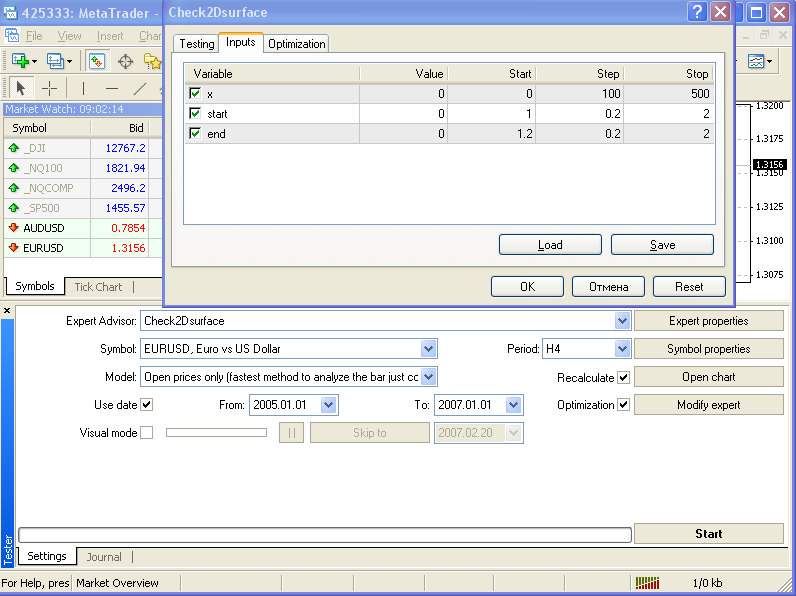
//+------------------------------------------------------------------+
//|                                               Check2Dsurface.mq4 |
//|                      Copyright © 2007, MetaQuotes Software Corp. |
//|                                        https://www.metaquotes.net/ |
//+------------------------------------------------------------------+
extern double x=0;
extern double start=0;
extern double end=0;

double initialBalance,Profit;
int FileHandle;
string FileName;
//+------------------------------------------------------------------+
//| expert initialization function                                   |
//+------------------------------------------------------------------+
int init()
  {
//----
   initialBalance=AccountBalance();

//----
   return(0);
  }
//+------------------------------------------------------------------+
//| expert deinitialization function                                 |
//+------------------------------------------------------------------+
int deinit()
   {
   Profit=AccountBalance()-initialBalance;
   FileName=WindowExpertName()+".csv";
   FileHandle=FileOpen(FileName,FILE_WRITE|FILE_READ|FILE_CSV);
   if (FileHandle!=-1)
     {
      FileSeek(FileHandle, 0,SEEK_END);
      FileWrite(FileHandle,"x=",x,"   start=",start,"   end=",end,"   Profit=",Profit);
      FileClose(FileHandle);
     }
   }

//+------------------------------------------------------------------+
//| expert start function                                            |
//+------------------------------------------------------------------+
int start()
   {
    if(OrderSelect(0,SELECT_BY_POS,MODE_TRADES)==false && Ask>=start && Ask<=end)
    {
        OrderSend(Symbol(),OP_BUY,1,Ask,0,0,Ask+250*Point,NULL,0,0,Blue);
    }

   }
//+------------------------------------------------------------------+
I would like to draw your attaention to this line
OrderSend(Symbol(),OP_BUY,1,Ask,0,0,Ask+250*Point,NULL,0,0,Blue);
this notation is more correct.Then, I'v set inputs of optimization
After optimization open Optimization Graf in mode "2D surface "
And open csv-formated file in folder /tester/files
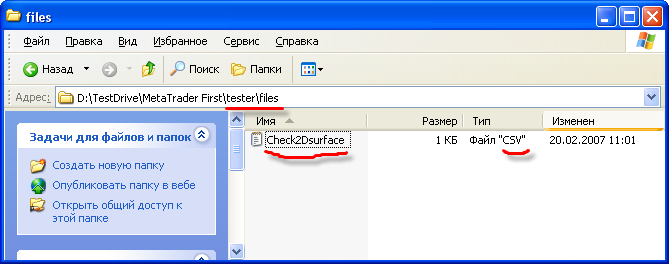
This file contain right records of the each pass of optimization
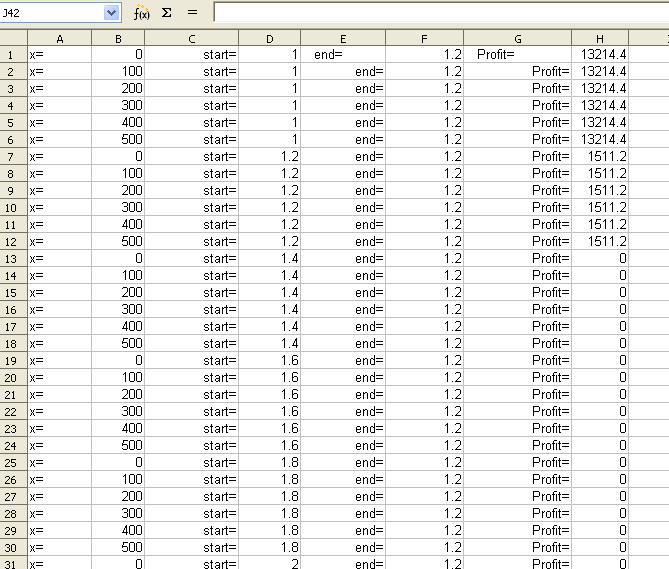
This file contain right records of the each pass of optimization
Test yourself this expert adviser as shown , I hope all will be clear.
You are missing trading opportunities:
- Free trading apps
- Over 8,000 signals for copying
- Economic news for exploring financial markets
Registration
Log in
You agree to website policy and terms of use
If you do not have an account, please register