 MetaTrader 5
 Experts
 Indicators
 Scripts
 Libraries
 Storage
Join our fan page

Repaint Inspector - expert for MetaTrader 5

- Views:
- 11
- Published:
-
 You are missing trading opportunities:
- Free trading apps
- Over 8,000 signals for copying
- Economic news for exploring financial markets
Registration Log inYou agree to website policy and terms of use
If you do not have an account, please register -
 Need a robot or indicator based on this code? Order it on Freelance
Go to Freelance
Need a robot or indicator based on this code? Order it on Freelance
Go to Freelance
Measures whether an indicator repaints, instead of taking the claim on trust. It attaches to a chart, re-reads the buffers of the indicator under test on bars that have already closed, and counts every change it sees there: values that move, values that appear and values that disappear — together with the furthest point back in history at which that still happens.
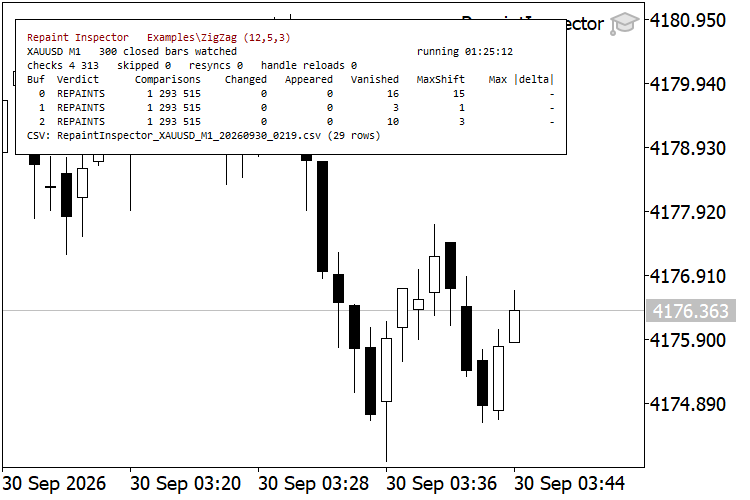
Examples\ZigZag(12,5,3) on XAUUSD M1. The panel was photographed at 1 h 25 min 12 s of the run, 87 seconds before it was stopped, which is why the totals in the table below are slightly higher. Panel colours were set to black on white for the screenshot; the defaults are light text on a dark panel.
The problem
"Non-repainting" is the most frequent claim in indicator descriptions and the one that is hardest to check. The usual test is to look at the chart, remember roughly where the arrows were, reload the indicator and look again. That test misses the two cases that actually cost money.
The first is a value on a bar that closed some time ago changing while the chart stays open. The eye does not catch it: the arrow moves by a few pixels, or it is removed while attention is on the right edge of the chart.
The second is an indicator that behaves while it lives and publishes a different history after it is reloaded, which is exactly what a timeframe switch, a terminal restart or a fresh chart does to the user.
Both are measurable. What is needed is something that writes down what the indicator published the first time it published it, and then keeps checking.
What it measures
- A bar is identified by its open time, never by its shift, so new bars, scrolling and history refills cannot be mistaken for a change.
- Only closed bars are compared, shift 1 and higher. The bar that is still forming changes by definition and says nothing about repainting.
- The first value seen for a closed bar becomes the reference. Every later reading is compared with the previous reading, which counts an event, and with the first reading, which measures the drift.
- Three kinds of event are counted separately, because they are not equally bad:
- Changed — a value moved to a different value.
- Appeared — an empty slot received a value, so a signal materialised on a bar that was already closed.
- Vanished — a published value was erased. This is the worst kind: the signal a trader acted on is no longer in the history the next reader sees.
- The headline number is MaxShift, the largest shift at which any event was ever seen. An indicator that only redraws the last closed bar is a different animal from one that rewrites fifteen bars of history.
- Every event is written to a CSV file with the bar time, the buffer, the shift at detection and the old and new value, so the report can be audited instead of believed.
- The indicator under test is created with IndicatorCreate from a parsed parameter list, so any custom indicator can be inspected without editing or recompiling anything. The parsed parameters are printed to the journal at start, which makes a wrong parameter list visible instead of silent.
- Optionally the handle is released and created again every N minutes. The recorded history is deliberately not reset, so the run also catches the indicator that is quiet while it lives and publishes a different past after a reload.
- A check is discarded, and counted as skipped rather than as evidence, whenever the indicator handle does not exist yet, the indicator is not calculated yet, there are fewer closed bars than the depth asked for, a buffer cannot be copied, or the series moves between reading the times and reading the values.
It samples: a value that exists for less time than the check interval can be missed. That is a real limit and there is a measurement of it further down.
Measured example
Everything below uses indicators that ship with the terminal, so anyone can repeat it.
Live, XAUUSD M1, 1 hour 26 minutes
Four copies on four charts of the same terminal and the same feed, 2026.09.30 from 02:19 to 03:46 server time, 300 closed bars watched, one check per second.
| Indicator under test | Buffer | Comparisons | Changed | Appeared | Vanished | MaxShift | Verdict |
|---|---|---|---|---|---|---|---|
| Examples\ZigZag (12,5,3) | 0 | 1 315 713 | 0 | 0 | 17 | 15 | REPAINTS |
| Examples\ZigZag (12,5,3) | 1 | 1 315 713 | 0 | 0 | 3 | 1 | REPAINTS |
| Examples\ZigZag (12,5,3) | 2 | 1 315 713 | 0 | 0 | 10 | 3 | REPAINTS |
| Examples\Custom Moving Average (13,0,2) | 0 | 1 305 513 | 0 | 0 | 0 | - | STABLE |
| Examples\Fractals, late confirmation | 0 | 1 303 713 | 0 | 13 | 0 | 3 | REPAINTS |
| Examples\Fractals, late confirmation | 1 | 1 303 713 | 0 | 12 | 0 | 3 | REPAINTS |
4387, 4353 and 4347 checks respectively, 0 / 0 / 1 checks skipped, 0 resynchronisations, 0 handle reloads. The event files hold 30, 0 and 25 rows, which equals the sum of the three event columns in each case.
The comparison counts are not round numbers and should not be: 87 new M1 bars opened during the run, and a bar that has just opened has no closed-bar history yet. For each instance, (checks - 1) x 300 - 87 reproduces the reported comparison count exactly.
Three different signatures in one table:
- ZigZag deletes its own past. 17 values were erased from the plotted ZigZag buffer, one of them 15 bars after that bar had closed, and 13 more from the two calculation buffers behind it. Nothing moved: a ZigZag extreme is the High or the Low of its bar and cannot drift, so it is removed and re-published somewhere else. That is why the events are Vanished and the delta column stays empty.
- A moving average of closed bars does not move. 1 305 513 comparisons, not one event.
- Fractals are a third case, and the tool separates it from the first. 25 events, all of them Appeared, none Changed, none Vanished, all at shift 3. That is not repainting, it is late confirmation: a fractal needs two more bars before it can be drawn, so the value legitimately turns up three bars back and then stays. The verdict column still says REPAINTS, because the tool reports what it saw and leaves the judgement to the reader. An indicator whose events are all Appeared at one fixed shift is usable with that delay built in; an indicator whose events are Vanished at scattered shifts is not.
Strategy Tester, the same measurement in ten seconds
Examples\ZigZag(12,5,3), XAUUSD M1, 2026.09.28 to 2026.09.29, 1 minute OHLC modelling, 300 closed bars watched:
| counter | value |
|---|---|
| verdict | REPAINTS |
| checks | 5 512 |
| comparisons on closed bars | 1 651 923 |
| changed / appeared / vanished | 0 / 3 / 342 |
| distinct bars that lost a value | 341 |
| distinct bars with at least one event | 343 |
| MaxShift | 28 |
| skipped checks / resynchronisations | 0 / 0 |
| CSV rows | 345 (= 342 + 3) |
In one trading day the ZigZag deleted 342 values it had already published on bars that were closed at the time, and one of those deletions happened 28 bars after the bar in question had closed. Three values appeared on already-closed bars. Only one of the three was a value coming back: bar 17:06 lost 4126.184, got exactly the same number back twenty seconds later, and lost it again a minute after that. That is also why Max |delta| reads 0.00000000 for the run; it is a measurement, not a gap.
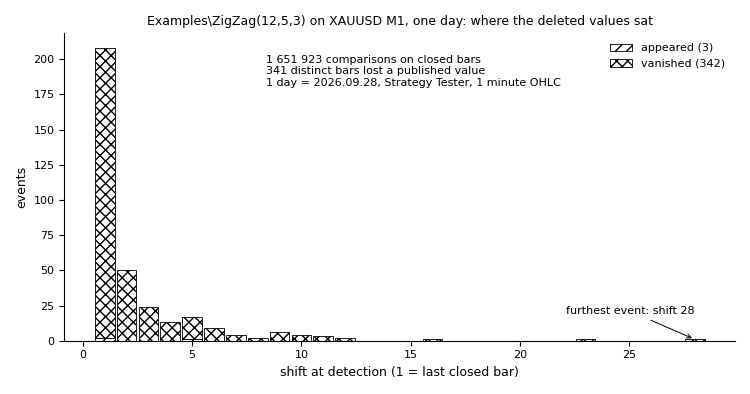
The 345 events of that day by the shift at which they were detected. Most repainting is one or two bars back, which is why watching only the last closed bar is not enough.
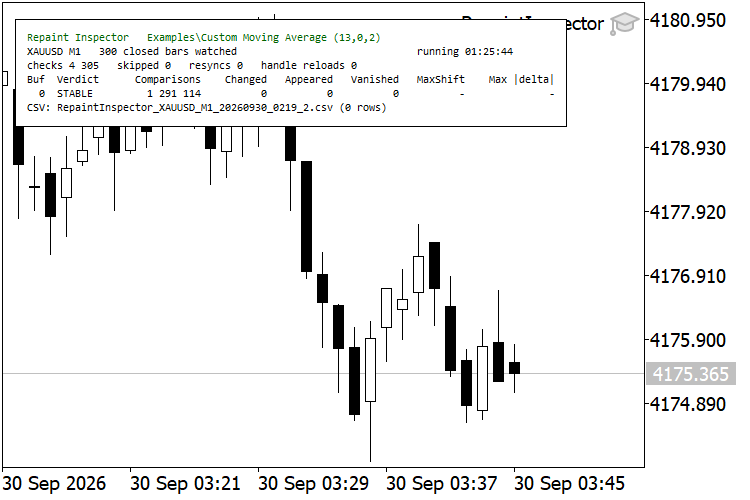
Examples\Custom Moving Average(13,0,2), same symbol and same run window as the ZigZag above: 1 291 114 comparisons at the moment of the screenshot and not one changed value. The comparison count is printed next to the verdict on purpose — STABLE is only worth the number beside it.
What "Treat 0.0 as no value" changes, and how big the sampling gap is
The fourth copy ran the same ZigZag with that switch off, so 0.0 counts as an ordinary value: 1 308 513 comparisons, 18 + 3 + 11 = 32 events, all of them Changed, the same MaxShift of 15, and a Max |delta| of 4184.08800000 on the main buffer. That number is the gold price, because the "change" is a peak being replaced by 0.0. Both settings describe the same repainting; the default names it correctly.
The two copies did not see exactly the same list, and that is worth knowing. The fourth copy logged two events the first one missed: bar 03:32:00 on buffers 0 and 2, detected at 03:33:01. The two copies started 14 seconds apart, and the value existed for less than one check interval, so one of them sampled it and the other did not. With a one-second interval on M1, that is the resolution of the instrument.
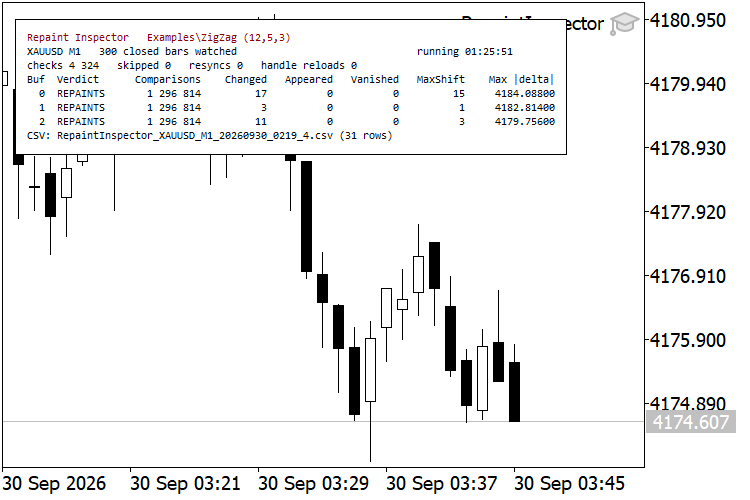
The same ZigZag read with 0.0 counted as a value. Every deletion now shows up as Changed with a delta the size of the price. Useful as a cross-check, misleading as a description.
Audit of the numbers
The counters were not taken on trust either. An independent Python re-implementation of Examples\ZigZag, run over the raw candles fetched from the terminal, was compared with the event files:
- Live run: for every one of the 17 bars where the plotted buffer lost a value, that value is absent from the replay today, and for all 17 the tool's last reading equals the replayed value.
- Tester run: 343 bars with events, the same two checks, no mismatch — 341 lost values absent from the replay, and 343 of 343 last readings equal to it.
Inputs
| Input | Default | Description |
|---|---|---|
| Indicator to inspect (iCustom path, no .ex5; example: Examples\ZigZag) | empty | Path of the custom indicator relative to MQL5\Indicators, without the extension, exactly as iCustom expects it. Empty on purpose: with nothing filled in the tool says so in the journal and on the panel and measures nothing, instead of pointing at an indicator that may not be on your terminal. If the path is wrong on a live chart the tool stays attached and retries every 30 seconds, so the input can be corrected without removing it. Measured on XAUUSD M1 with a wrong path: the tool named the error code once, the terminal added its own "cannot load" line at each attempt (30.4 and 30.7 seconds apart), and correcting the path started the measurement without detaching anything. |
| Parameters, comma separated (empty = indicator defaults) | empty | The input list of the indicator under test, for example 12,5,3. Each item is typed by its content: true and false become bool, a number containing a dot or an exponent becomes double, a plain number becomes int, anything else becomes a string, and surrounding quotes are stripped. The parsed list is printed to the journal at start, so a wrong list is visible immediately. Empty means the indicator runs with its own defaults. |
| Number of buffers to watch (1..32) | 1 | How many buffers are read. Calculation buffers count as well. A buffer the indicator does not have makes the whole check fail: it is counted as a skipped check and the first few occurrences are written to the journal with the error code, so it is visible rather than silent. |
| Symbol (empty = chart symbol) | empty | Inspect an indicator on another symbol without opening its chart. |
| Timeframe | Current | Inspect an indicator on another timeframe. |
| Closed bars watched (shift 1..N) | 300 | Depth of the check. Bars multiplied by buffers is limited to 200 000 slots; above that the depth is reduced and one line is written to the journal. |
| Minimum seconds between checks, modelled time in the tester (0 = every tick) | 1 | Throttle. One second catches any repaint a human could act on and costs far less CPU than every tick, but a value that exists for less than the interval can be missed. In the Strategy Tester the modelled clock is used instead of the wall clock, so the same setting works there. |
| Ignore |change| smaller than this (0 = count every change) | 0.0 | Absolute tolerance in the units of the buffer, for an indicator that recomputes from floating point and jitters in the last digits. 0 counts every difference. A change not bigger than the tolerance is not recorded at all — no event, no CSV row, no contribution to Max |delta|. |
| Treat 0.0 as "no value" (arrow/ZigZag style buffers) | true | Many signal indicators publish 0.0 rather than EMPTY_VALUE for "no signal". With this on, 0.0 counts as empty and those events are reported as Appeared and Vanished. Switch it off for a buffer where exactly zero is a legitimate value. |
| Recreate the indicator handle every N minutes (0 = never) | 0 | Releases the handle and asks the terminal for a new one, which triggers a full recalculation unless another program still holds the same indicator with the same parameters. The recorded history is not cleared, so this is what catches the indicator that is stable while it runs and different after a reload. |
| Stop measuring after N minutes (0 = run until removed) | 0 | Ends the measurement and freezes the report, which is convenient for an unattended run. |
| Write every event to MQL5\Files (CSV) | true | The event file. |
| CSV file name (empty = automatic) | empty | Automatic names are built from symbol, timeframe and start time. If a file of that name is currently open, because another copy started in the same minute, a numeric suffix is added instead of the copy running with no file at all. A closed file of the same name from an earlier run in the same minute is overwritten, so give a name of your own when a run matters. |
| Stop writing after this many rows | 100000 | Guard against an indicator that repaints on every tick. Counting continues after the limit; only the file stops growing, and one line in the journal says so. |
| Show the report panel on the chart | true | Switch it off for an unattended or tester run. |
| Panel X distance, pixels at 96 dpi | 12 | Position. The panel scales with the screen dpi. |
| Panel Y distance, pixels at 96 dpi | 20 | Position. |
| Font size, points (4 or more; the panel scales with the screen dpi) | 9 | The panel is a table in a monospace font. Lower it on a high-dpi screen or a small chart; the screenshots above use 4. |
| Panel corner | Left upper | Anchor corner. |
| Panel background colour | dark grey | Panel colours. One copy per chart, as for any Expert Advisor; several charts can run copies at the same time. |
| Panel border colour | dim grey | |
| Panel text colour | light grey | |
| Header colour when every buffer is stable | lime green | |
| Header colour when a buffer repaints | tomato |
The report
This is the summary block the tool printed to the journal when the live ZigZag run above was stopped, copied verbatim. The panel on the chart shows the same table, with the running time right-aligned:
=== Repaint Inspector summary =====================================
Repaint Inspector   Examples\ZigZag (12,5,3)
XAUUSD M1   300 closed bars watched   running 01:26:39
checks 4 387   skipped 0   resyncs 0   handle reloads 0
Buf  Verdict      Comparisons    Changed   Appeared   Vanished   MaxShift    Max |delta|
  0  REPAINTS       1 315 713          0          0         17         15              -
  1  REPAINTS       1 315 713          0          0          3          1              -
  2  REPAINTS       1 315 713          0          0         10          3              -
CSV: RepaintInspector_XAUUSD_M1_20260930_0219.csv (30 rows)
started 2026.09.30 02:19:31 server time, 4387 checks, 0 skipped, 0 resyncs, 0 handle reloads
events total 30, CSV rows 30
buffer 0: REPAINTS, comparisons 1315713, changed 0, appeared 0, vanished 17, bars touched 17
buffer 0: max shift 15 (VANISHED on bar 2026.09.30 02:59)
buffer 0: max |delta| none
buffer 0: first event 2026.09.30 02:23:02, last event 2026.09.30 03:46:03
The event file in MQL5\Files carries one row per event:
detect_time;bar_time;shift_at_detect;buffer;event;old_value;new_value;delta;drift_from_first;after_reload
2026.09.28 17:11:20;2026.09.28 17:06:00;5;0;VANISHED;4126.18400000;EMPTY;;;0
An empty value is written as EMPTY and an undefined difference is left blank, so no reader can mistake a missing number for a zero. A second file, <name>_summary.csv, holds one row per buffer with every counter plus the indicator, its parameters, symbol, timeframe and depth, refreshed every 15 seconds while the run is going, so the numbers can be recounted from the event file without parsing a log. The journal gets the start block, the first 20 events in full, and the summary above when the tool is removed.
How to use it
- Put the indicator you want to check in MQL5\Indicators and note its parameter list.
- Attach Repaint Inspector to a chart of the symbol and timeframe you actually trade, fill in the path and the parameters, and set the number of buffers.
- Let it run over the hours you trade. Repainting is a property of market activity, not of the clock, and a quiet Sunday evening proves nothing.
- Read MaxShift first, then the split between Changed, Appeared and Vanished, then open the CSV and look at a few rows.
- If the indicator survives that, set the handle reload to 30 minutes and run it again.
Limits, stated plainly
- The tool cannot prove the absence of repainting. It can only fail to find any over the period measured, which is why the comparison count stands next to every verdict.
- It samples at the check interval. A value that comes and goes inside one interval can be missed, and the measurement above shows that happening twice in an hour and a half.
- It measures what an indicator publishes through its buffers. An indicator that draws objects on the chart instead of filling buffers is invisible to it.
- The Strategy Tester is useful here because it compresses a day into seconds, but a tester repaint and a live repaint are not automatically the same thing. When the answer matters, run it live.
- In the Strategy Tester the indicator under test has to be present and compiled before the run starts. The tester treats a failed IndicatorCreate as a critical error and unloads the expert, which no error handling inside the tool can change: measured with a deliberately wrong path, creating the handle in OnInit gives "indicator create error" then "OnInit critical error", and creating it at the first check instead gives the same six error records ending in "OnTester critical error". On a live chart the same wrong path is not fatal: the tool stayed attached and retried, and the corrected path began measuring in place.
- It says nothing about whether an indicator is profitable. A non-repainting indicator can still be useless, and some repainting indicators are used deliberately and correctly.
- No trading functions, no DLL, no network access, no external files needed. It reads buffers and writes CSV files to MQL5\Files.
 Edge Drift Detector
Tests whether live closing deals still match the backtest of an Expert Advisor. A bootstrap-calibrated CUSUM detector raises an alarm and estimates when the drift began, a two-window check separates a short dip from a lasting decline, and an expectancy decomposition shows whether the win rate or the trade sizes changed. The script generates demonstration data on the first run and is written in pure MQL5.
Buy GBPJPY Every Monday. That's the Whole Strategy.
A free, fully open EA: buy GBPJPY every Monday at 11:00 server time (04:00 New York), close at 23:00. Stays profitable in backtest with the entry anywhere from 09:00 to 13:00. Attach to GBPJPY M1.
 Accelerator Oscillator (AC)
The Acceleration/Deceleration Indicator (AC) measures acceleration and deceleration of the current driving force.
MACD Signals
Indicator edition for new platform.