 MetaTrader 5
 Experts
 Indicators
 Scripts
 Libraries
 Storage
Join our fan page
- Published by:
-
Wennide Mogore
 I'm Wennide Mogore, Lead Quantitative Developer at IronHawk Capital. I work directly with clients on MQL5, MT5 and Python trading-system projects, from the first specification to testing, delivery and post-delivery support.
 - Views:
- 1364
- Rating:
- Published:
- Updated:
-
 You are missing trading opportunities:
- Free trading apps
- Over 8,000 signals for copying
- Economic news for exploring financial markets
Registration Log inYou agree to website policy and terms of use
If you do not have an account, please register -
 Need a robot or indicator based on this code? Order it on Freelance
Go to Freelance
Need a robot or indicator based on this code? Order it on Freelance
Go to Freelance
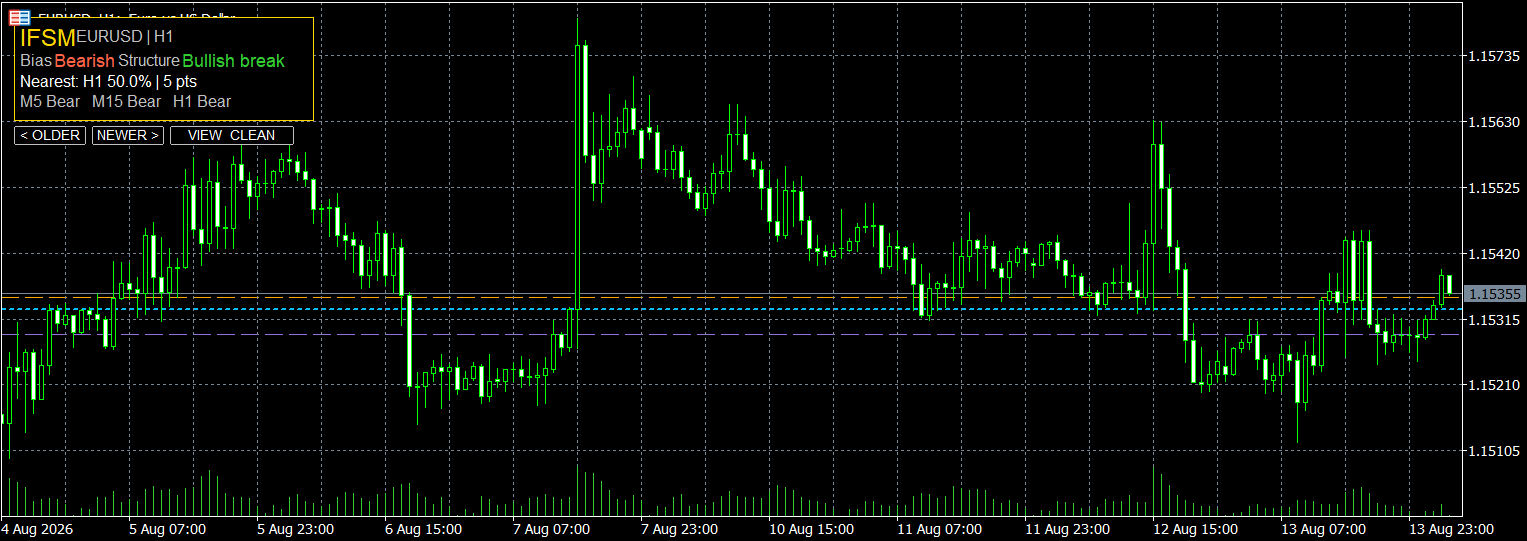
IronHawk Fibonacci Structure Map is based on the idea that Fibonacci levels become more useful when they are combined with confirmed market swings and higher-timeframe context instead of being drawn from arbitrary points.
The indicator automatically identifies confirmed swing highs and lows, calculates the main Fibonacci retracement and extension levels, and compares those levels across several timeframes. When two or more Fibonacci levels are located close to each other, the indicator groups them into a confluence zone.
The main levels used are 23.6%, 38.2%, 50%, 61.8%, 78.6%, 127.2% and 161.8%. A confluence zone does not represent an automatic buy or sell signal. It simply highlights an area where several Fibonacci references overlap and where the trader may want to pay closer attention to price behaviour.
The indicator also displays a basic market-structure context, Premium/Discount areas around the active swing, the nearest Fibonacci level and the distance from the current price.
Main external parameters include:
- Timeframe 1 / 2 / 3: timeframes used for Fibonacci comparison.
- Lookback Bars: amount of historical data used to search for swings.
- Swing Depth: strength required before a high or low is considered a confirmed swing.
- Fibonacci Levels: enables or disables individual retracement and extension levels.
- ATR Period: volatility reference used when calculating whether nearby Fibonacci levels belong to the same confluence zone.
- Cluster ATR Multiplier: controls the maximum distance allowed between levels inside a confluence area.
- Minimum Cluster Levels: minimum number of overlapping Fibonacci levels required before a zone is displayed.
- Show Structure: enables the market-structure information.
- Show Premium/Discount: displays the upper and lower halves of the active swing.
- View Mode: switches between Full, Clusters Only and Minimal chart views.
- Alerts: optionally notifies the user when price enters a detected confluence zone.
The indicator is designed as a chart-analysis tool only. It does not open, close or manage trades.
 Market Session Separator Indicator
Marks the start/end of up to three trading sessions (Asian, London, New York, or any custom windows) with vertical separators and/or shaded background boxes, repeated daily across a rolling recent window. Purely visual — no calculations, no signals, just clean session boundaries.
Elliott Wave Auto Counter / Automatic Wave Labeling
Automatically detects swing pivots and labels a rule-validated Elliott Wave count (1-2-3-4-5 impulse and A-B-C correction) directly on the chart, with a Fibonacci info panel. For guidance only, always confirm manually.
GDS Renko Reversal Context
A simple MT5 indicator that shows the current fixed-size Renko run and the exact price level required to confirm a classic two-brick reversal.
GDS Renko Bricks
A simple real-time classic Renko chart for MetaTrader 5. Set the brick size and the indicator builds equal-width Renko bricks directly from tick data. No offline charts, custom symbols or external libraries are required.