 MetaTrader 5
 Experts
 지표
지표
 스크립트
스크립트
 라이브러리
라이브러리
 보관함
보관함
당사 팬 페이지에 가입하십시오
- 게시자:
-
Wennide Mogore
 I'm Wennide Mogore, Lead Quantitative Developer at IronHawk Capital. I work directly with clients on MQL5, MT5 and Python trading-system projects, from the first specification to testing, delivery and post-delivery support.
 - 조회수:
- 9
- 평가:
- 게시됨:
-
 이 코드를 기반으로 한 로봇이나 지표가 필요하신가요? 프리랜스로 주문하세요
프리랜스로 이동
이 코드를 기반으로 한 로봇이나 지표가 필요하신가요? 프리랜스로 주문하세요
프리랜스로 이동

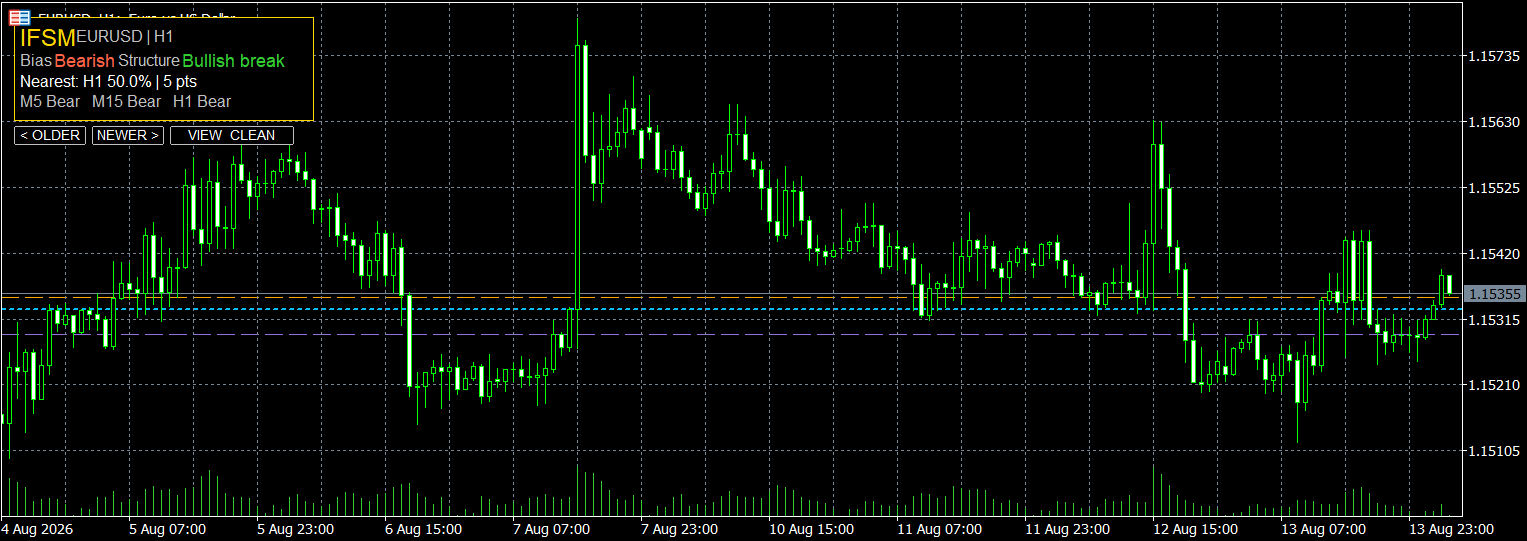
IronHawk 피보나치 구조 맵은 피보나치 레벨을 임의의 지점에서 그리는 대신, 확인된 시장 변동과 더 긴 시간대의 맥락과 결합할 때 그 유용성이 더욱 높아진다는 개념을 기반으로 합니다.
이 지표는 확인된 스윙 고점과 저점을 자동으로 식별하고, 주요 피보나치 되돌림 및 확장 수준을 계산한 뒤, 여러 시간대의 해당 수준들을 비교합니다. 두 개 이상의 피보나치 수준이 서로 가까이 위치해 있을 경우, 지표는 이를 ‘합류 구역’으로 묶습니다.
주로 사용되는 수준은 23.6%, 38.2%, 50%, 61.8%, 78.6%, 127.2% 및 161.8%입니다. 수렴 구역이 자동으로 매수 또는 매도 신호를 의미하는 것은 아닙니다. 이는 단순히 여러 피보나치 기준선이 겹치는 영역을 강조하여, 트레이더가 해당 구역의 가격 움직임에 더 주의를 기울여야 할 필요가 있음을 나타낼 뿐입니다.
또한 이 지표는 기본적인 시장 구조적 맥락, 현재 스윙 주변의 프리미엄/디스카운트 구간, 가장 가까운 피보나치 수준 및 현재 가격과의 거리를 표시합니다.
주요 외부 매개변수는 다음과 같습니다:
- 시간대 1 / 2 / 3: 피보나치 비교에 사용되는 시간대.
- 룩백 바(Lookback Bars): 스윙을 검색하는 데 사용되는 과거 데이터의 양.
- 스윙 깊이: 고점이나 저점이 확인된 스윙으로 간주되기 위해 필요한 강도.
- 피보나치 수준: 개별 되돌림 및 확장 수준을 활성화하거나 비활성화합니다.
- ATR 기간: 인근 피보나치 레벨이 동일한 합류 구역에 속하는지 계산할 때 사용되는 변동성 기준.
- 클러스터 ATR 배율: 수렴 영역 내 레벨 간의 최대 허용 거리를 제어합니다.
- 최소 클러스터 레벨: 구역이 표시되기 위해 필요한 중첩된 피보나치 레벨의 최소 개수.
- 구조 표시: 시장 구조 정보를 활성화합니다.
- 프리미엄/디스카운트 표시: 현재 스윙의 상단 및 하단 반을 표시합니다.
- 보기 모드: 전체, 클러스터 전용 및 최소 차트 보기 간에 전환합니다.
- 알림: 가격이 감지된 합류 구역에 진입할 때 사용자에게 알림을 보낼지 여부를 선택합니다.
이 지표는 순수한 차트 분석 도구로만 설계되었습니다. 매매 포지션을 개설, 청산하거나 관리하지는 않습니다.
MetaQuotes Ltd에서 영어로 번역함.
원본 코드: https://www.mql5.com/en/code/76760
 ATS Liquidity City - liquidity pools and sweeps, drawn as a neon city
Shows where stops are likely resting and which ones were just taken. Liquidity pools = confirmed swing highs and lows that price has not traded through yet, equal highs/lows (a bigger pool) and yesterday's high and low. When a bar trades beyond a pool it is marked as swept, and as "grabbed & rejected" if the same bar closes back inside. Non-repainting: a swing is used only after N closed bars on each side. The panel is a neon city drawn on a CCanvas: the price is a flying car, sell stops are towers below it, buy stops floating platforms above it, yesterday's levels golden billboards, a searchlight sweeps the sky and a ticker runs today's catch. Two buffers give the nearest active pool above and below for use in an Expert Advisor. Indicator only: it never trades.
 Repaint Inspector
Measures whether an indicator repaints instead of trusting the claim. It re-reads the buffers of any custom indicator on bars that have already closed and counts every value that changes, appears or disappears, with the furthest shift back at which that still happens. Verdict per buffer on a chart panel, every event written to CSV.
Risk Based Position Size Calculator
드래그가 가능한 MT5 리스크 계산기로, 선택한 진입 및 손절 거리를 틱 크기, 틱 가치 및 계좌 리스크를 바탕으로 브로커 표준화 포지션 규모로 변환해 줍니다.
Arixis Backtest Robustness Analyzer
A free open-source MT5 utility for analyzing historical trading performance beyond Profit Factor.