 MetaTrader 5
 Experts
 Indicators
 Scripts
 Libraries
 Storage
Join our fan page

Session Opening Range Breakout EA - expert for MetaTrader 5

- Views:
- 3628
- Rating:
- Published:
- Updated:
-
 You are missing trading opportunities:
- Free trading apps
- Over 8,000 signals for copying
- Economic news for exploring financial markets
Registration Log inYou agree to website policy and terms of use
If you do not have an account, please register -
 Need a robot or indicator based on this code? Order it on Freelance
Go to Freelance
Need a robot or indicator based on this code? Order it on Freelance
Go to Freelance

Session Opening Range Breakout EA
SessionORB_EA automates a classic opening-range breakout: it watches the first N minutes after a chosen session open, records the high and low printed during that window, and then arms two breakout triggers. A confirmed close beyond either trigger opens a single risk-sized market position for that session, with the stop loss anchored to the opposite side of the range.
The idea behind it
The opening minutes of a major session (London, New York, or any custom time you define in broker time) frequently set the tone for the rest of the day: overnight order flow gets absorbed, and the resulting range often marks the boundary between rotation and trend. Trading the breakout of that range is a simple, mechanical way to get positioned early in a potential directional move, while the range itself doubles as a natural stop-loss reference.
This EA is timeframe-agnostic for breakout confirmation — the range itself is always measured from M1 data for precision, regardless of which chart timeframe the EA is attached to, while the breakout signal is confirmed on the closed bar of the chart's own period. This keeps the range accurate to the minute while letting you control signal sensitivity (M1 for scalping cadence, M15/H1 for fewer, more decisive signals) simply by changing the chart period.
How to interpret it
- Dashed rectangle — the opening range itself: its top and bottom are the session high and low recorded during the opening window.
- Dashed horizontal lines projecting forward — the live breakout trigger levels (range high / range low plus the buffer), extended across the trading window during which entries are still permitted.
- Dotted vertical line — marks the exact session start time used to anchor the range.
- Once a bar closes beyond a trigger line (not merely wicks through it), the EA sends a single market order in that direction, with the stop loss placed just beyond the opposite boundary of the range and the take-profit set as a multiple of that risk distance.
- No new signals are drawn or traded once the trading window expires or the per-session trade quota is reached; the chart is cleared and rebuilt automatically at the start of the next session.
External variables (inputs)
| Input | Default | Purpose |
|---|---|---|
| InpSessionStartHour | 8 | Hour (broker/server time) the tracked session opens |
| InpSessionStartMinute | 0 | Minute component of the session open time |
| InpOpeningRangeMinutes | 30 | Length of the opening window used to measure the range high/low |
| InpTradingWindowMinutes | 120 | Minutes after the range closes during which a breakout may still be traded |
| InpMagicNumber | 20260815 | Unique identifier attached to every order this EA places |
| InpMaxTradesPerSession | 1 | Maximum number of breakout trades allowed per session |
| InpAllowLongTrades | true | Enables long (buy) breakouts above the range high |
| InpAllowShortTrades | true | Enables short (sell) breakouts below the range low |
| InpBreakoutBufferPoints | 20 | Points a close must clear beyond the range boundary to count as a valid breakout |
| InpRiskPercent | 1.0 | Percentage of account balance risked on each trade |
| InpStopLossBufferPoints | 30 | Extra points added past the opposite range boundary when placing the stop loss |
| InpRewardToRiskRatio | 2.0 | Take-profit distance expressed as a multiple of the risk (stop) distance |
| InpUseFixedLot | false | When true, bypasses risk-based sizing and uses a fixed lot instead |
| InpFixedLotSize | 0.10 | Lot size used only when InpUseFixedLot is true |
| InpDrawObjects | true | Toggles drawing of the range box and trigger lines on the chart |
| InpRangeBoxColor | clrSilver | Border color of the opening-range rectangle |
| InpTriggerColor | clrWhite | Color of the forward breakout trigger lines and session-start marker |
| InpObjectPrefix | SORB_ | Prefix applied to every chart object, used for clean identification and removal |
Recommended use
- Works on any symbol with a genuine intraday opening/closing rhythm — forex majors, indices, and metals are the most natural fits; range-bound low-volatility symbols will generate fewer, noisier signals.
- Attach to any chart timeframe: it only governs how often the breakout condition is re-checked, since the range itself is always measured from M1 data regardless of the chart period.
- Session times are in broker/server time, not local time — confirm your broker's GMT offset before setting InpSessionStartHour, especially around daylight-saving transitions.
- On ECN/raw-spread accounts, consider raising InpBreakoutBufferPoints and InpStopLossBufferPoints slightly to filter out spread-driven false breaks around news-heavy opens.
- Backtest in "Every tick based on real ticks" mode for realistic fills, since the EA reacts to bar closes and risk-based lot sizing depends on live tick/point values.
- Ensure your terminal has M1 history available for the symbol; the EA measures the opening range from M1 bars regardless of the chart's own timeframe.
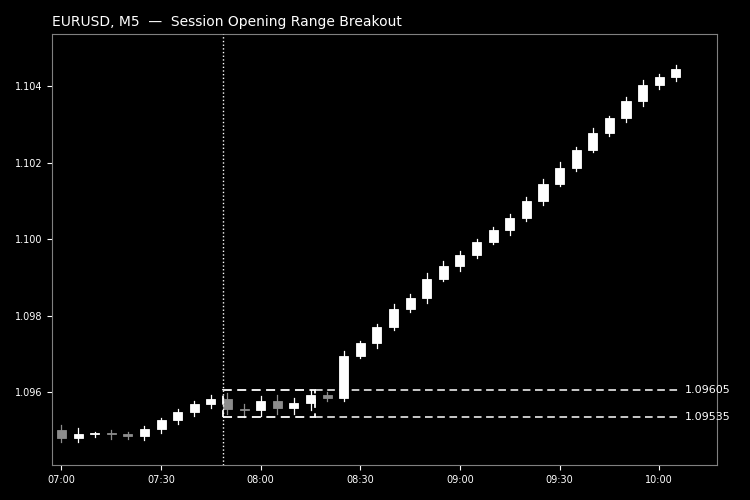
Fig. 1. Opening range box and forward breakout trigger lines on a session breakout (black & white, per Code Base image guidelines).
 Adaptive Kalman Trend Filter with Regime Bands submission
A single-state Kalman filter that rescales its own process noise by Kaufman's Efficiency Ratio on every bar, tightening into price during trends and smoothing harder through chop, plotted with regime bands that expand and contract on the same read
Quantora Trading Cost Calculator MT5 - Professional Spread Commission and Swap Cost Calculator
Professional open-source Trading Cost Calculator for MetaTrader 5. Calculates spread cost, commission, swap and estimated total trading cost using live broker symbol data and adjustable position settings.
Reverse RSI Bands
Reverse RSI Bands is a leading indicator that mathematically reverse-engineers the RSI formula. It plots precise target price bands directly on the main chart, showing exactly at what price the RSI will hit your specified overbought or oversold levels in real-time.
Custom Simple Moving Average
A two-stage adaptive moving average (base average + secondary smoothing) that colors itself by slope and marks price/average crossovers with arrows.