 MetaTrader 5
 Experts
 Indicators
 Scripts
 Libraries
 Storage
Join our fan page

Custom Simple Moving Average - indicator for MetaTrader 5

- Views:
- 1507
- Rating:
- Published:
- Updated:
-
 You are missing trading opportunities:
- Free trading apps
- Over 8,000 signals for copying
- Economic news for exploring financial markets
Registration Log inYou agree to website policy and terms of use
If you do not have an account, please register -
 Need a robot or indicator based on this code? Order it on Freelance
Go to Freelance
Need a robot or indicator based on this code? Order it on Freelance
Go to Freelance
Custom Average
CustomAverage is a self-contained, non-repainting trend indicator built around a double-averaging idea: a fast base average is computed directly from price, and a second, independent smoothing stage is then applied on top of it. The result is a single adaptive line that reacts to price faster than a single long-period moving average, yet stays noticeably calmer than a single short-period one.
The idea behind it
A plain moving average forces a compromise between responsiveness and noise: shorten the period and it hugs price but whipsaws in ranges; lengthen it and it lags every real turn. CustomAverage avoids that single trade-off by splitting the job into two independent filters:
- Stage 1 - Base average. A moving average (SMA, EMA, SMMA, or LWMA, selectable) is applied to the chosen price series (close, open, median, typical, weighted, etc.). This stage does the primary trend-following work.
- Stage 2 - Smoothing. A second moving average (again, any of the four classic methods) is applied on top of the Stage 1 result rather than on raw price. Because it is filtering an already-averaged series, a comparatively short smoothing period is enough to shave off residual jitter without adding much extra lag.
Every value is calculated once, from left to right, strictly from bars that are already closed relative to the bar being processed - the indicator never looks into the future and never repaints historical values. On each new tick the code recalculates only the bars that changed (rates_total / prev_calculated), so it stays light even on deep history and low timeframes.
How to interpret it
- The main line is the final, twice-averaged value. It changes color depending on its own slope: one color while the line is rising bar-to-bar, another while it is falling - so the trend direction is visible at a glance without a separate oscillator.
- A bullish arrow is plotted under the bar where price closes back above the average after having closed below it on the previous bar - a simple, classic price/average crossover long signal.
- A bearish arrow is plotted above the bar where price closes back below the average after having closed above it on the previous bar - the mirrored short signal.
- A small text label in the corner of the chart shows the current numeric value of the average, refreshed on every calculation.
- The indicator does not generate trading recommendations by itself - treat the line as a dynamic support/resistance/trend filter and the arrows as timing markers to combine with your own entry, exit, and risk rules.
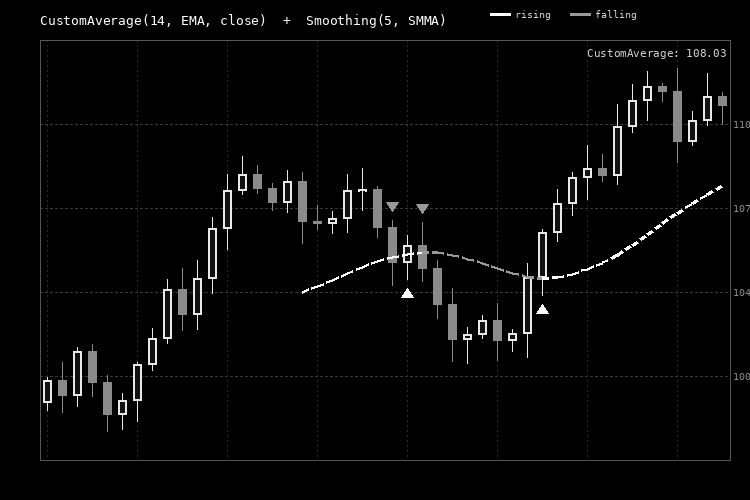
Fig. 1. CustomAverage plotted on a price chart (black & white, per Code Base image guidelines).
External variables (inputs)
| Variable | Default value | Description |
|---|---|---|
| InpMAPeriod | 14 | Period of the Stage 1 base average. |
| InpMAMethod | MODE_EMA | Averaging method for Stage 1: SMA, EMA, SMMA, or LWMA. |
| InpAppliedPrice | PRICE_CLOSE | Price series fed into Stage 1 (close, open, high, low, median, typical, or weighted). |
| InpSmoothPeriod | 5 | Period of the Stage 2 smoothing applied to the Stage 1 result. A value of 0 or 1 disables Stage 2 and the indicator behaves as a plain single-stage average. |
| InpSmoothMethod | MODE_SMMA | Averaging method for Stage 2: SMA, EMA, SMMA, or LWMA. |
| InpShowSignals | true | Enables/disables the price/average crossover arrows. |
| InpArrowUpCode | 233 | Wingdings symbol code used for the bullish crossover arrow. |
| InpArrowDownCode | 234 | Wingdings symbol code used for the bearish crossover arrow. |
| InpArrowUpColor | clrLime | Color of the bullish crossover arrow. |
| InpArrowDownColor | clrRed | Color of the bearish crossover arrow. |
| InpColorUp | clrDodgerBlue | Line color while the average is rising. |
| InpColorDown | clrOrangeRed | Line color while the average is falling. |
| InpLineWidth | 2 | Width of the plotted line, in pixels. |
| InpShowLabel | true | Shows/hides the on-chart text label with the current numeric value of the average. |
| InpLabelCorner | CORNER_RIGHT_UPPER | Chart corner used to anchor the value label. |
Recommended use
- Works on any symbol and any timeframe; it is a pure price-derived indicator and places no requirements on the account type (works identically on netting and hedging accounts, real or demo).
- The default 14/EMA base with a 5/SMMA smoothing stage is a balanced starting point for H1-H4 charts. For faster intraday charts (M1-M15) consider shortening both periods; for swing or position trading on D1-W1, lengthening InpMAPeriod will reduce sensitivity to noise.
- Setting InpSmoothPeriod to 0 or 1 turns the indicator into a conventional single-stage moving average, useful for comparing the effect of the second filtering stage directly on the same chart.
- As with any moving-average-based tool, the line lags price by construction and works best as a trend filter or dynamic support/resistance reference rather than as a stand-alone entry signal; combine the crossover arrows with a broader trading plan (structure, volatility, risk management) rather than trading them in isolation.
- The indicator plots on the main chart window and creates one chart label object, which it removes automatically on deinitialization (timeframe change, indicator removal, template reload, etc.), so it leaves no orphaned chart objects behind.
Reverse RSI Bands
Reverse RSI Bands is a leading indicator that mathematically reverse-engineers the RSI formula. It plots precise target price bands directly on the main chart, showing exactly at what price the RSI will hit your specified overbought or oversold levels in real-time.
 Session Opening Range Breakout EA
An Expert Advisor that measures the high/low of a defined session opening window, then trades the confirmed breakout of that range with risk-based position sizing and a one-trade-per-session cap.
 Broker Spec Inspector
Prints the invisible contract limits that silently reject orders: stops level, freeze level, min/step/max lot, tick size and value, spread type, execution mode, swaps, and the margin needed for the minimum lot against your free margin.
BMP Chart Wallpaper
BMP Chart Wallpaper Background for MT5