 MetaTrader 5
 Experts
 Indicateurs
 Scripts
 Bibliothèque
 Stockage
Rejoignez notre page de fans

Custom Simple Moving Average - indicateur pour MetaTrader 5

- Vues:
- 88
- Note:
- Publié:
- Mise à jour:
-
 Vous manquez des opportunités de trading :
- Applications de trading gratuites
- Plus de 8 000 signaux à copier
- Actualités économiques pour explorer les marchés financiers
Inscription Se connecterVous acceptez la politique du site Web et les conditions d'utilisation
Si vous n'avez pas de compte, veuillez vous inscrire -
 Besoin d'un robot ou d'un indicateur basé sur ce code ? Commandez-le sur Freelance
Aller sur Freelance
Besoin d'un robot ou d'un indicateur basé sur ce code ? Commandez-le sur Freelance
Aller sur Freelance
Moyenne personnalisée
CustomAverage est un indicateur de tendance autonome, sans rafraîchissement, construit autour d'un concept de double moyenne : une moyenne de base rapide est calculée directement à partir du cours, puis une deuxième étape de lissage indépendante est appliquée par-dessus. Il en résulte une ligne adaptative unique qui réagit plus rapidement au cours qu’une moyenne mobile unique à longue période, tout en restant nettement plus stable qu’une moyenne mobile unique à courte période.
Le principe sous-jacent
Une moyenne mobile simple impose un compromis entre réactivité et bruit : si l'on raccourcit la période, elle suit de près le cours mais oscille fortement dans les zones de consolidation ; si on l'allonge, elle accuse un retard à chaque véritable retournement. CustomAverage évite ce compromis en divisant le traitement en deux filtres indépendants :
- Étape 1 – Moyenne de base. Une moyenne mobile (SMA, EMA, SMMA ou LWMA, au choix) est appliquée à la série de cours sélectionnée (cours de clôture, d’ouverture, médian, typique, pondéré, etc.). Cette étape assure le suivi de la tendance principale.
- Étape 2 – Lissage. Une deuxième moyenne mobile (là encore, l’une des quatre méthodes classiques) est appliquée sur le résultat de l’étape 1 plutôt que sur le cours brut. Comme elle filtre une série déjà moyennée, une période de lissage relativement courte suffit à éliminer les fluctuations résiduelles sans ajouter beaucoup de décalage supplémentaire.
Chaque valeur est calculée une seule fois, de gauche à droite, en se basant strictement sur les barres déjà clôturées par rapport à la barre en cours de traitement : l’indicateur ne se projette jamais dans l’avenir et ne recalcule jamais les valeurs historiques. À chaque nouveau tick, le code ne recalcule que les barres qui ont changé (rates_total / prev_calculated), ce qui lui permet de rester léger même avec un historique profond et des intervalles de temps courts.
Comment l'interpréter
- La ligne principale correspond à la valeur finale, obtenue après deux moyennes. Elle change de couleur en fonction de sa pente : une couleur lorsque la ligne monte de barre en barre, une autre lorsqu’elle descend — ce qui permet de voir d’un seul coup d’œil la direction de la tendance sans avoir besoin d’un oscillateur distinct.
- Une flèche haussière est tracée sous la barre lorsque le cours clôture à nouveau au-dessus de la moyenne après avoir clôturé en dessous lors de la barre précédente – un signal d’achat simple et classique basé sur un croisement cours/moyenne.
- Une flèche baissière est tracée au-dessus de la barre où le cours clôture à nouveau en dessous de la moyenne après avoir clôturé au-dessus de celle-ci lors de la barre précédente : il s’agit du signal de vente inverse.
- Une petite étiquette de texte dans le coin du graphique affiche la valeur numérique actuelle de la moyenne, actualisée à chaque calcul.
- L’indicateur ne génère pas de recommandations de trading en soi : considérez la ligne comme un filtre dynamique de support, de résistance ou de tendance, et les flèches comme des repères temporels à combiner avec vos propres règles d’entrée, de sortie et de gestion des risques.
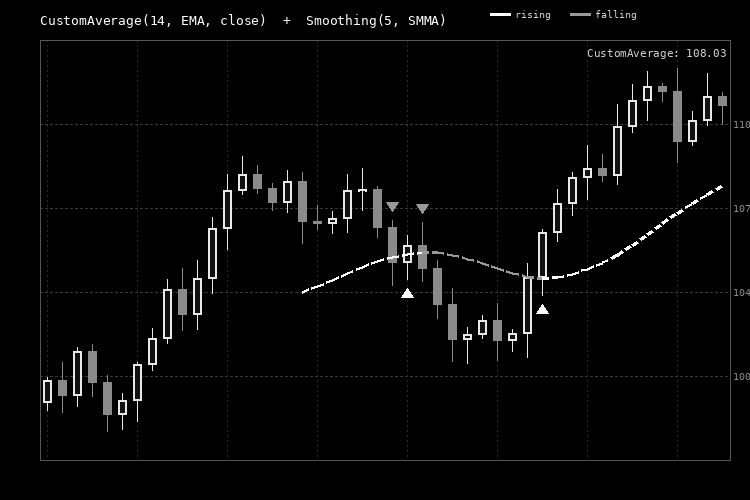
Fig. 1. CustomAverage tracé sur un graphique des cours (en noir et blanc, conformément aux directives visuelles de Code Base).
Variables externes (données d'entrée)
| Variable | Valeur par défaut | Description |
|---|---|---|
| InpMAPeriod | 14 | Période de la moyenne de base de l'étape 1. |
| InpMAMethod | MODE_EMA | Méthode de calcul de la moyenne pour la phase 1 : SMA, EMA, SMMA ou LWMA. |
| InpAppliedPrice | PRICE_CLOSE | Série de cours utilisée pour l'étape 1 (cours de clôture, d'ouverture, haut, bas, médian, typique ou pondéré). |
| InpSmoothPeriod | 5 | Période de lissage de l'étape 2 appliquée au résultat de l'étape 1. Une valeur de 0 ou 1 désactive l'étape 2 et l'indicateur se comporte alors comme une simple moyenne à une seule étape. |
| InpSmoothMethod | MODE_SMMA | Méthode de calcul de la moyenne pour la phase 2 : SMA, EMA, SMMA ou LWMA. |
| InpShowSignals | true | Active/désactive les flèches de croisement entre le cours et la moyenne. |
| InpArrowUpCode | 233 | Code de symbole Wingdings utilisé pour la flèche de croisement haussier. |
| InpArrowDownCode | 234 | Code du symbole Wingdings utilisé pour la flèche de croisement baissier. |
| InpArrowUpColor | clrLime | Couleur de la flèche de croisement haussier. |
| InpArrowDownColor | clrRed | Couleur de la flèche de croisement baissier. |
| InpColorUp | clrDodgerBlue | Couleur de la ligne lorsque la moyenne est en hausse. |
| InpColorDown | clrOrangeRed | Couleur de la ligne lorsque la moyenne est en baisse. |
| InpLineWidth | 2 | Largeur de la ligne tracée, en pixels. |
| InpShowLabel | true | Affiche/masque l'étiquette textuelle sur le graphique indiquant la valeur numérique actuelle de la moyenne. |
| InpLabelCorner | CORNER_RIGHT_UPPER | Coin du graphique utilisé pour ancrer l'étiquette de valeur. |
Utilisation recommandée
- Fonctionne avec n'importe quel symbole et n'importe quelle période ; il s'agit d'un indicateur dérivé exclusivement du cours et qui n'impose aucune contrainte quant au type de compte (fonctionne de manière identique sur les comptes de netting et de couverture, qu'ils soient réels ou démo).
- La configuration par défaut (14/EMA avec un lissage 5/SMMA) constitue un point de départ équilibré pour les graphiques H1 à H4. Pour les graphiques intrajournaliers plus rapides (M1-M15), envisagez de raccourcir les deux périodes ; pour le swing trading ou le trading de position sur D1-W1, allonger InpMAPeriod réduira la sensibilité au bruit.
- Régler InpSmoothPeriod sur 0 ou 1 transforme l’indicateur en une moyenne mobile classique à un seul étage, ce qui est utile pour comparer directement l’effet du deuxième étage de filtrage sur le même graphique.
- Comme pour tout outil basé sur une moyenne mobile, la ligne est, de par sa conception, en décalage par rapport au cours et fonctionne mieux comme filtre de tendance ou référence dynamique de support/résistance plutôt que comme signal d’entrée autonome ; combinez les flèches de croisement avec un plan de trading plus global (structure, volatilité, gestion des risques) plutôt que de les utiliser isolément.
- L'indicateur s'affiche dans la fenêtre principale du graphique et crée un objet d'étiquette de graphique, qu'il supprime automatiquement lors de la désinitialisation (changement de période, suppression de l'indicateur, rechargement du modèle, etc.), de sorte qu'il ne laisse aucun objet graphique orphelin derrière lui.
Traduit de l’anglais par MetaQuotes Ltd.
Code original : https://www.mql5.com/en/code/75951
 Broker Spec Inspector
Affiche les limites invisibles du contrat qui entraînent le rejet silencieux des ordres : niveau d'arrêt, niveau de gel, lot min./pas/max., taille et valeur du tick, type de spread, mode d'exécution, swaps, ainsi que la marge requise pour le lot minimum par rapport à votre marge disponible.
 Risk Guard — risk-based lot size, daily loss lock, max positions, oversized-trade trim, forced stop-loss
Enforces your own risk rules on every position, whether opened by hand or by another EA: shows the lot size that matches your risk, locks the account for the day after a set loss, caps open positions, trims positions that risk more than allowed, and adds a stop-loss to any position opened without one.
Smart Loss Exit — early exit for losing positions (ATR adverse excursion, time in trade, EMA invalidation, RSI, money cap) with a CSV journal
Closes losing positions early, before the full stop-loss, when a rule says the trade is not coming back: adverse move beyond N x ATR, too long in loss, EMA trend flipped, RSI against the position, or a money cap. Never touches a position in profit. Observe-only mode journals what would be closed without closing anything. Every exit is written to CSV with the rule, the age and the maximum adverse excursion, so the rules can be tuned from data.
BMP Chart Wallpaper
Fond d'écran BMP avec graphique pour MT5