Francis Dogbe / Profil
- Information
|
11+ Jahre
Erfahrung
|
2
Produkte
|
39
Demoversionen
|
|
1
Jobs
|
0
Signale
|
0
Abonnenten
|
Freunde
1772
Anfragen
Ausgehend
Francis Dogbe
swTrue | Joined Jan 2016 | Status: Member | 210 Posts
Price exists outside of time, time is just a constraint or parameter we place on it. How do you step outside of time and view the market?
A couple years ago I was studying candlestick patterns and some of the traders were "combining" candle sticks to create a certain pattern. It hit me then that patterns really have no value as you could change the time frame, or the broker time and they'd disappear. A candle/bar is just a snapshot of price.
Even after a market closes prices are moving, maybe not on a visual chart, but prices are just human sentiment. We think about our trades, the values, risk etc. after a market closes. So the value/price is always in motion.
Time frames are used to "trap" price and give us a visual of price in those moments. But is viewing the market in such a way "trapping" our view of the market, or maybe misdirecting our focus?
So how do you strip that away? Is viewing a tick chart raw price… or the tape?
I think many/most traders with any significant time invested come to realize indicators have little to no value, as they're just based on price. So many revert to naked trading, just candlesticks, but is that really as naked as it gets? Or is that just one more step in the right direction?
After you removed your indicators, removed time frames and you're just left with price is that as "naked" as it gets? And most importantly does move your closer towards profitability or an edge or improved edge?
I'm sure others have had thoughts and pursued the same line of thinking so I'm interested in your thoughts and feedback. Did it lead to anywhere?
COPIED..... forexfactory.com
Price exists outside of time, time is just a constraint or parameter we place on it. How do you step outside of time and view the market?
A couple years ago I was studying candlestick patterns and some of the traders were "combining" candle sticks to create a certain pattern. It hit me then that patterns really have no value as you could change the time frame, or the broker time and they'd disappear. A candle/bar is just a snapshot of price.
Even after a market closes prices are moving, maybe not on a visual chart, but prices are just human sentiment. We think about our trades, the values, risk etc. after a market closes. So the value/price is always in motion.
Time frames are used to "trap" price and give us a visual of price in those moments. But is viewing the market in such a way "trapping" our view of the market, or maybe misdirecting our focus?
So how do you strip that away? Is viewing a tick chart raw price… or the tape?
I think many/most traders with any significant time invested come to realize indicators have little to no value, as they're just based on price. So many revert to naked trading, just candlesticks, but is that really as naked as it gets? Or is that just one more step in the right direction?
After you removed your indicators, removed time frames and you're just left with price is that as "naked" as it gets? And most importantly does move your closer towards profitability or an edge or improved edge?
I'm sure others have had thoughts and pursued the same line of thinking so I'm interested in your thoughts and feedback. Did it lead to anywhere?
COPIED..... forexfactory.com
Francis Dogbe
"Never ever take a Trade or make a decision based on previous (history) whether it is the loss or win" ...by MHFX7
Francis Dogbe
There are thousands of trading strategies available to the Forex trader. In fact, when you account for the infinite number of technical indicators available, the possibilities are limitless. It’s easy to think that the more strategies you use, the more money you will make...
In sozialen Netzwerken teilen · 3
429
Francis Dogbe
Beitrag News Trading – Why You Won’t Make Money Trading News veröffentlicht
I am a purely technical trader and I never ever trade the news or a big fundamental event. Some traders might say that it’s a mistake but trading news is like rolling the dice and it’s pure gambling...
Francis Dogbe
Hat ein Produkt angeboten
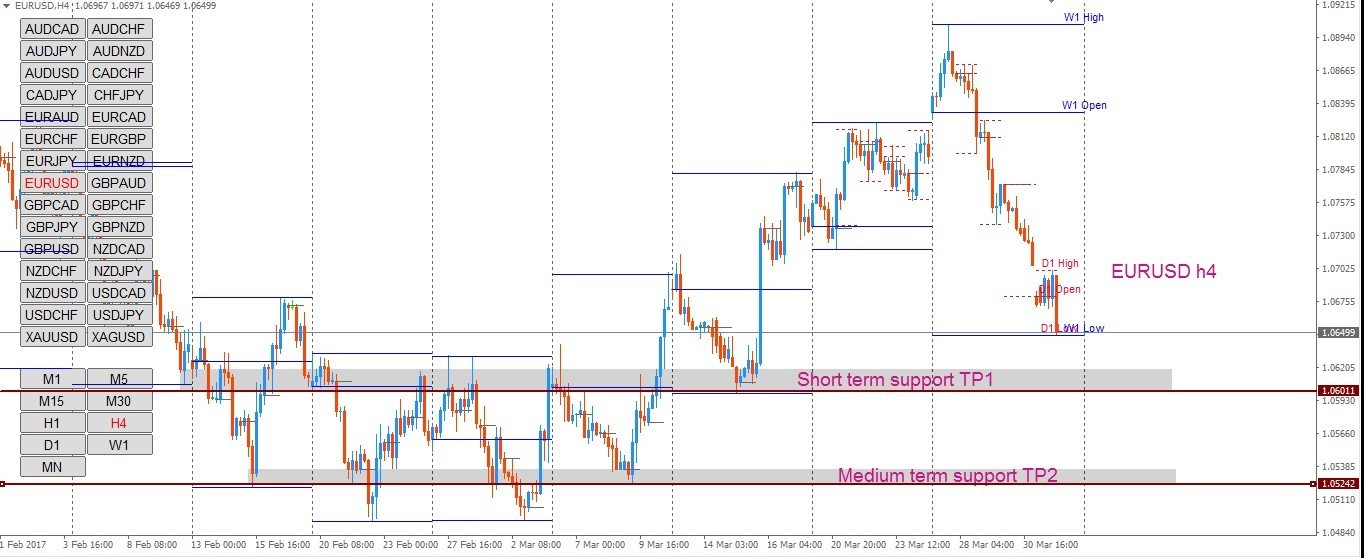
Dies ist ein einfacher vorlaufender Indikator, der dabei hilft, Linien für den Eröffnungskurs des Tages, der Woche, des Monats und des Jahres zu zeichnen. Er zeichnet auch die Höchst- und Tiefstwerte der jeweiligen Perioden ein. Der Eröffnungskurs hilft, den Startpunkt eines beliebigen Symbols innerhalb eines bestimmten Zeitraums zu markieren. Diese Linien können bei der Bestimmung des Trends eines beliebigen Marktes (Aktien und Devisen) nützlich sein. Sie enthält auch Bereiche für die
: