TTF 2x Osc AM
- Indikatoren
- Andriy Matviyevs'kyy
- Version: 26.0
- Aktualisiert: 15 September 2023
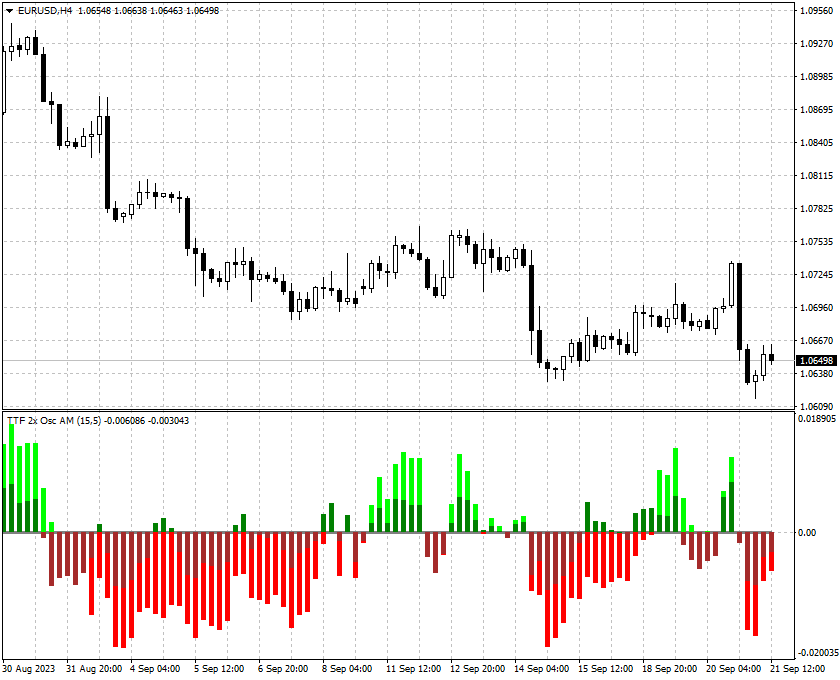
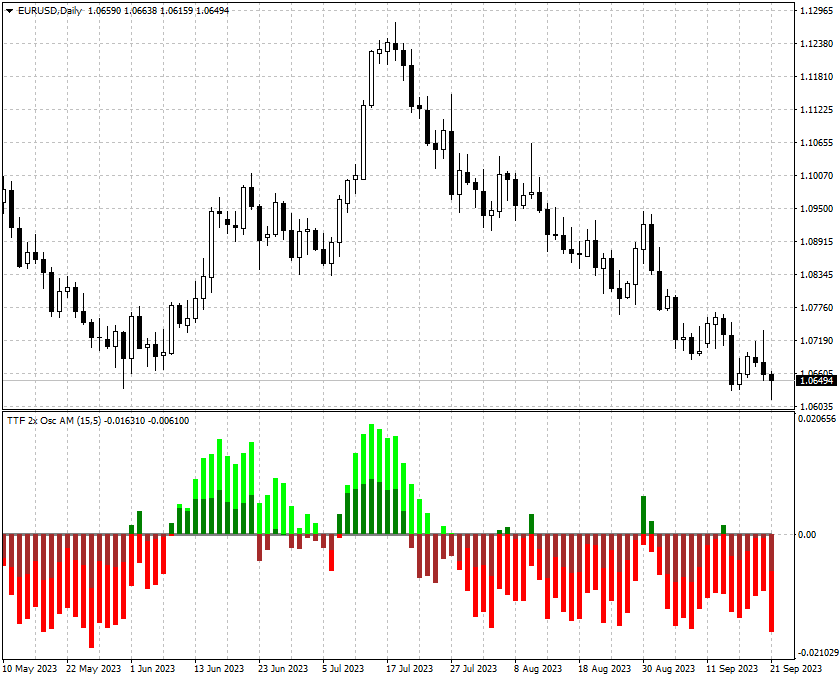
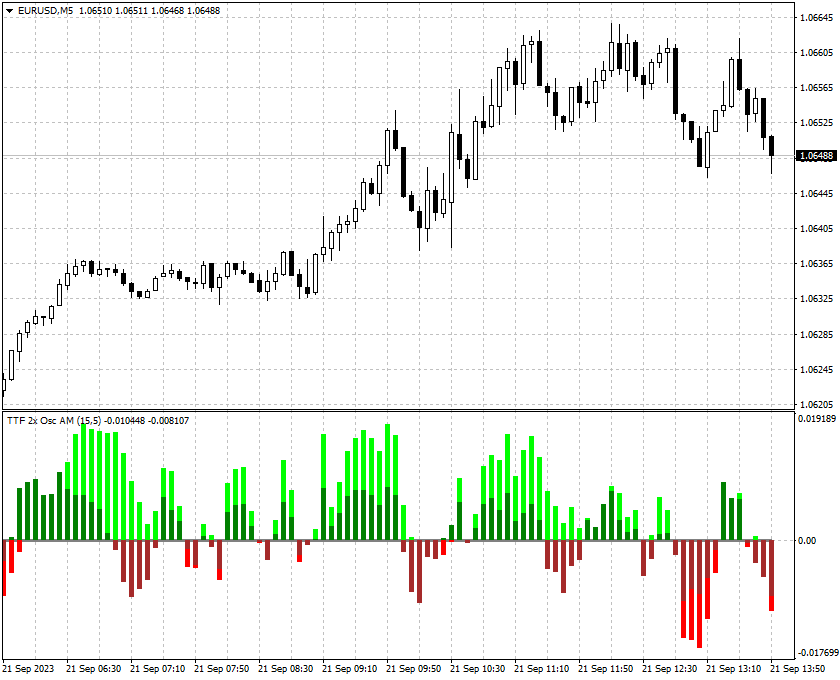
This indicator is based on the idea of a popular Trend Trigger Factor indicator (TTF).
The indicator determines a price movement direction comparing high and low of the current candle with high and low of a price for a longer period.
Parameters:
- Long_TTF_Bars - number of candles to calculate the price movement direction for a longer period of time (cannot be less than 2)
- Short_TTF_bars - number of candles to calculate the price movement direction for a shorter period of time (cannot be less than 2)
If set by default, the indicator generates following signals:
- Both histograms are greater than zero - when the price breaks through the bar's high - buy.
- Both histograms are below zero - when the price breaks through the low of the bar - sell.
- Histograms are multidirectional - setting SL for open positions.
The indicator does not redraw.