Buy Sell indicator M5
- Indikatoren
- Andrey Kozak
- Version: 1.0
- Aktivierungen: 15
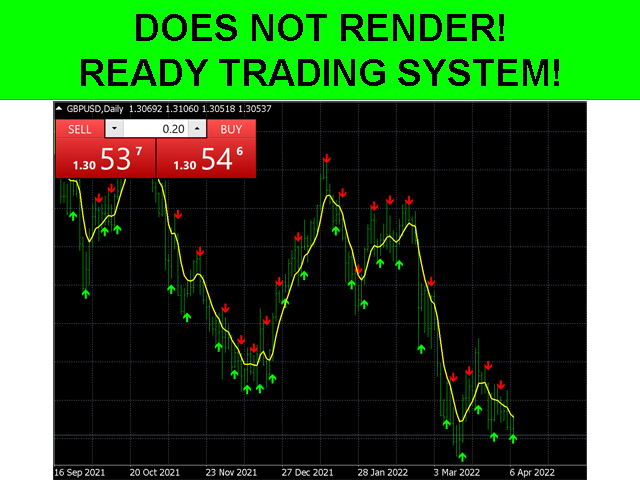
Fertige Handelsstrategie. Der Indikator zeigt Preisumkehrpunkte auf dem Chart. An Stellen einer möglichen Preisumkehr zeichnet der Indikator einen Pfeil. Wenn der Indikator einen grünen Pfeil zeichnet, bewegt sich der Preis nach oben. Wenn der Indikator einen roten Pfeil zeichnet, bewegt sich der Preis nach unten. Der Indikator zeichnet auch eine Durchschnittslinie auf dem Chart. Es wird gelb dargestellt. Wenn der Indikator einen grünen Pfeil zeichnet und der Preis unter der Linie liegt, wird der Preis mit einer Wahrscheinlichkeit von 95% in naher Zukunft auf das Niveau der gelben Linie steigen und diese durchbrechen. Wenn der Indikator einen roten Pfeil zeichnet und der Preis über der Linie liegt, wird der Preis in naher Zukunft auf die Ausgleichslinie fallen und sie durchbrechen. Sie können mit dieser einfachen Handelsstrategie handeln.
Vorteile des Indikators:
- zeichnet Pfeile nicht neu.
- 95 % der Signale kommen nicht zu spät.
- Der Indikator ist sehr einfach einzurichten.
- es ist ein fertiges Handelssystem.
Anzeigeeinstellungen:
- period_ma - Bewegungszeitraum (gelbe Linie).
- Signal_filter - Anzeigesignalfilter.
- Relevance_Score - Preis- und Signalkorrelationssystem.
- Starting_candle – ab welcher Kerze die Datenzählung beginnen soll.
- width - die Größe der Pfeile.