• Übersicht
  • Bewertungen
  • Diskussion

Fibo Panda Daily Auto

Fibo Panda is an indicator that can help you predict the end of daily trends.

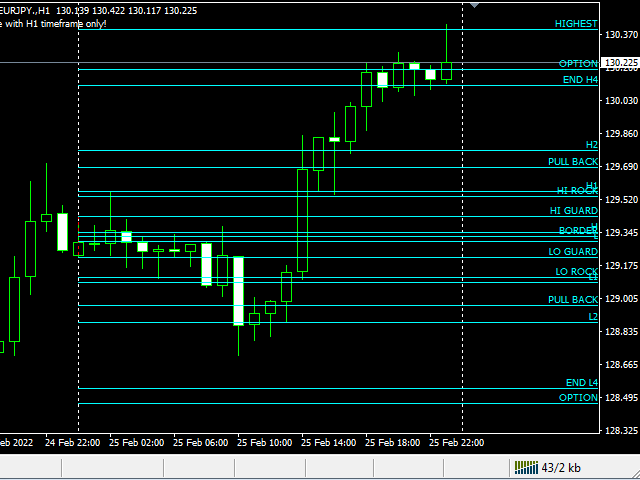
If the daily price has reached the END L4 or END H4, means the Daily volume is enough. If the daily price has reached the Highest or Lowest, means the price has reached the highest or lowest level.

Price must touch the End Hi or End Low Level to complete the price movement of each timeframe.

A conclusion can be made whether to buy or sell.

If the price is in the High Guard and Low Guard areas it means the price is now in the sideway, this is the neutral zone. You are not encouraged to enter this area.


PRICE IS IN THE NEUTRAL ZONE

BETWEEN HI GUARD AND LO GUARD, NEUTRAL ZONE IS LIKE A "HOME" NEGOTIATION PLACE TO WANT TO HI OR LO,
AS LONG AS THE PRICE IS IN THE NEUTRAL ZONE THEN IT IS SIDEWAY IT IS NOT ENCOURAGED TO ENTRY IN THE NEUTRAL ZONE UNLESS THERE IS OTHER UNDERSTANDING.

** FUNCTION ** HI / LO GUARD IS LIKE "SECURITY" TO HI and LO NEED TO GET“ACCESS” FROM GUARD

MAIN PRICE CONDITIONS NEED TO CLOSE OUTSIDE THE GUARD, EVERY BREAK NEEDS A RETRACEMENT. SO WAIT FOR THE NEW RETRACEMENT LOOK FOR SETUP FOR ENTRY.


LEVEL HI/LO ROCK (150.00) H1/L1 (161.8)

• ROCK TO ROCK MEANS OFTEN WHEN THE PRICE DOES NOT "BREAK"
 LEVEL ROCK (150.00) PRICE WILL GO TO THE OPPOSING LEVEL ROCK .. FROM LO ROCK TO HI ROCK.

• CHANCE TO WIN BETWEEN 20 - 40 PIP IF ENTRY IS AT ROCK LEVEL.

• HOW TO ENTRY IN TF H1 CONFIRMATION IN M15. IN TF H4 CONFIRMATION IN TF H1.

• IF THERE IS A REJECTION CANDLE THAT EXCEEDS 2 3 4 THE CANDLE SHOWS PRICE IS NOT AFFORDABLE TO BREAK AND WILL APPLY RETRACE OR REVERSAL.

• OFTEN PRICE WILL RE -ENTER THE "NEUTRAL ZONE" BY OPPORTUNITY SCALPING BETWEEN 10-20 PIPS.

• GENERALLY ENTRY AT LEVEL ROCK IS SOMEWHAT RISK UNLESS THERE IS OTHER UNDERSTANDING.

• “ALWAYS” APPLIES WHEN THE PRICE “STARTS TO MOVE” FROM THE ROCK LEVEL IT WILL END AT END CYCLE (END LO / HI).

• EXAMPLE IF STARTING FROM LO ROCK WILL END AT END HI.


LEVEL HI/LO PULLBACK (200.00) H2/L2 (261.8).

• LEVELS THAT HAVE HIGH RISK N HIGH REWARD.

• AT THIS LEVEL “OFTEN” APPLY 3R (Rejection, Retracement, Reversal).

• SITUATIONS OCCUR AT EVERY TIME FRAME AND PAIR.

• ENTRY OPPORTUNITY “WATCH” THE ENTIRE MOVEMENT PRICE IN TIME FRAME H4, DAILY, WEEK.

• PRICE OFTEN “STARTS MOVING” AT THE PULLBACK LEVEL AND END IN END ZONE (HI/LO).

• TF H4 "MUST" BE FOCUSED WHEN PRICE IS AT LEVEL SUCH.

• FOR ENTRY MAKE SURE “WAIT MANDATORY” CANDLE CLOSED.


ROUTING 4 (R4) IS THE * BACKBONE * IN FIBO PANDA

• THIS IS RELATED TO DAILY, WEEKLY, MONTHLY AND ANNUAL VOLUME.

• DAILY VOLUME TF H1, WEEKLY TF H4, MONTHLY TF D1, ANNUAL TF WEEK.

• PRICE * MANDATORY * TOUCH LEVEL END HI OR END LO TO COMPLETE PRICE MOVEMENT AT EACH TIME FRAME.

• MAKE SURE THE SIZE / SETTING IN EACH TF IS CORRECT AND ACCURATE.

• WITH FULLY UNDERSTANDING THE MOVEMENT OF ROUTING 4, THIS IS CERTAIN WILL BE ABLE TO READ * MARKET DIRECTIONS * AND CLEAR PRICE MOVEMENT FOR ENOUGH VOLUME, YOU MUST LOOK FOR END HI OR END LO

• FOR MORE CLEAR PLEASE DO A BACK TEST AND SEE THE PRICE MOVEMENT ON AVERAGE 90% PRICE TOUCH END HI AND END LO.



Empfohlene Produkte
This is indicator for checking your trades. Please see the pictures attachment, the indicator show info about: - Breakeven Level; - Margin Call Level; - Two volume info, past and current (With color exchange base on the past volume); - Spreads; - Swap Long and Swap Short (With color change, positive and negative swap); - Running Price; -Today High Low Pips; - Today Open to Current Running Price pips. This indicator not for trading entry, only to assist your trade management Regards
Harmonic Trading is now much easy than ever before with Harmonic Master Scanner Pro you can now scan time frames from 5m to 1w for 17 harmonic patterns on all bares at the same time. Harmonic Master Scanner Pro works based on original MetaTrader4 Zigzag indicator and the standard harmonic patterns elements. This software send alert and email to you when a harmonic pattern is detected on any charts. If you want the scanner to draw the pattern just switch the time frame to the alert time frame. Th
Ska ZigZag BuySell
NKATEKO VUKOSI LEROY MASANGO
Ska ZigZag BuySell indicator determines the overbought and oversold regions within a trend. The indicator determines the overbought region by the candlestick high and the oversold region by the candlestick low. This indicator only gives signals with arrow and audible alerts each and every time when a new candlestick appear. To utilize the full strategy i recommend using "Ska ZigZag BuySell" together with "Ska ZigZag Line". The Ska ZigZag Line indicator is available for free. NOTE: Indicator is h
Support And Resistance Screener is in one level indicator for MetaTrader that provide multiple tools inside one indicator. The available tools are :  1. Market Structure Screener. 2. Bullish Pullback Zone. 3. Bearish Pullback Zone. 4. Daily Pivots Points 5. weekly Pivots Points 6. monthly Pivots Points 7. Strong Support and Resistance based on Harmonic Pattern and volume. 8. Bank Level Zones. Key Features All in one level indicator. All types of alerts ( Pop-up alert, puss notification aler
Contact me for any queries or custom orders, if you want to use this in an EA. Key Features: Pattern Recognition : Identifies Fair Value Gaps (FVGs) Spots Break of Structure (BOS) points Detects Change of Character (CHoCH) patterns Versatile Application : Optimized for candlestick charts Compatible with any chart type and financial instrument Real-Time and Historical Analysis : Works seamlessly with both real-time and historical data Allows for backtesting strategies and live market analysis V
FREE
Extremum Reverse Bar
Yurij Izyumov
2.8 (5)
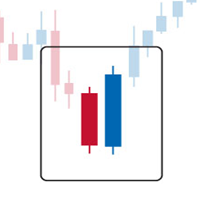
This indicator has been created for finding the probable reversal points of the symbol price. A small candlestick reversal pattern is used it its operation in conjunction with a filter of extremums. The indicator is not redrawn! If the extremum filter is disabled, the indicator shows all points that have a pattern. If the extremum filter is enabled, the condition works – if the history Previous bars 1 candles back contains higher candles and they are farther than the Previous bars 2 candle, such
FREE
The indicator compares pattern found on chart history with the current price movement. Since history repeats itself, then, by comparing the two patterns, indicator can predict the further movement of the price. The indicator allows you to overlay highlighted history pattern with current movement and you will visually see this movement and will be able to compare the past and the present. To compare two patterns, you need: It is necessary to find and highlight a pattern on the history chart of a
The chart pattern is automatically drawn. It also automatically tells you the price at which you are most likely to buy or sell according to the pattern. Therefore, there is no need to memorize patterns or draw lines by yourself. We are live-streaming the actual operation of the system. Please check for yourself if it is usable. Please check it out for yourself. https://www.youtube.com/@ganesha_forex We do not guarantee your investment results. Investments should be made at your own risk. W
KT Asian Breakout Indicator
KEENBASE SOFTWARE SOLUTIONS
KT Asian Breakout indicator scans and analyzes a critical part of the Asian session to generate bi-directional buy and sell signals with the direction of a price breakout. A buy signal occurs when the price breaks above the session high, and a sell signal occurs when the price breaks below the session low. MT5 Version is available here https://www.mql5.com/en/market/product/41704 Things to remember If the session box is vertically too wide, a new trade should be avoided as most of the price
This indicator will allow you to evaluate single currency linear regression. WHAT IS LINEAR REGRESSION?(PIC.3) Linear regression is an attempt to model a straight-line equation between two variables considering a set of data values. The aim of the model is to find the best fit that can serve the two unknown values without putting the other at a disadvantage. In this case, the two variables are price and time, the two most basic factors in the Forex market. Linear regression works in such a wa
The indicator automatically sets trendlines on the really important points directly on the chart. Timeframe, color and style of the lines can be adjusted. Notification of a breakout above or below the line via a smartphone is possible. Input Parameters TimeFrame : Choose timeframe AppliedPrice : Choose close , open, high, low, median, typical or weighted price Formation : Choose swing, Shoulder head shoulder or long term formation Alerts : true = alert is on SendEmail : Send message to email a
QuantumAlert Stoch Navigator is a free indicator available for MT4/MT5 platforms, its work is to provide "alerts" when the market is inside "overbought and oversold" regions in the form of "buy or sell" signals. This indicator comes with many customization options mentioned in the parameter section below, user can customise these parameters as needful. Join our   MQL5 group , where we share important news and updates. You are also welcome to join our private channel as well, contact me for the p
FREE
Pivot Point Fibo RSJ ist ein Indikator, der die Unterstützungs- und Widerstandslinien des Tages mithilfe von Fibonacci-Kursen verfolgt. Dieser spektakuläre Indikator erzeugt bis zu 7 Unterstützungs- und Widerstandsebenen durch Pivot Point unter Verwendung von Fibonacci-Kursen. Es ist fantastisch, wie die Preise jedes Niveau dieser Unterstützung und dieses Widerstands respektieren, wo es möglich ist, mögliche Einstiegs- / Ausstiegspunkte einer Operation zu erkennen. Merkmale Bis zu 7 Unter
FREE
An indicator of patterns #45 and #46 (Three Falling Peaks and Three Rising Valleys) from Encyclopedia of Chart Patterns by Thomas N. Bulkowski. Parameters: Alerts - show alert when an arrow appears   Push - send a push notification when an arrow appears (requires configuration in the terminal) PeriodBars - indicator period K - an additional parameter that influences the accuracy of pattern shape recognition. The smaller the value is, the smoother the row of peaks/valleys should be, so fewer patt
The Channel Arg Control indicator, in addition to lines, reflects entry signals in the form of arrows. But how to do that? At first glance, this is not an easy task. But not for the Channel Arg Control indicator, this indicator will tell you whether you have configured the indicator correctly, while you can specify the history interval in the bars that interests you. And yet, how does the indicator tell you? Look at the numbers on the chart near the arrows! This is exactly what you thought, the
This indicator scans for you up to 30 trading instruments and up to 8 timeframes for occurrences of the high probability reversal patterns: Double Tops/Bottoms with fake breakouts . Please read also the blog post " Professional Trading With Double Tops/Bottoms And Divergences! " which explains the concepts behind the ULTIMATE Double Top/Bottom indicator and how you can use a professional top-down approach. This FREE Version of the Scanner scans only EURUSD and GBPUSD. The full version of the sca
FREE
AlarmLIne
Adrian Hernandez Castellanos
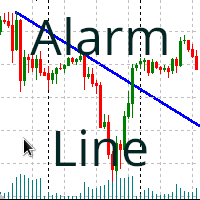
Trendlinien-Breakout-Alarm Beschreibung: Dieser Indikator löst einen Alarm (Ton, Warnung oder Benachrichtigung) aus, wenn der Preis eine Trendlinie durchbricht, sowohl oberhalb als auch unterhalb der Linie. Parameter: Names of the trendlines. : Durch Kommas getrennte Namen der Trendlinien (Stellen Sie sicher, dass der Name Ihrer Trendlinie keine Leerzeichen am Anfang hat und genau ist). Value over/under the line (E.g.: 0.03% or 500 pips). : Wert, der eine Marge oberhalb/unterhalb der Trendlinie
It's a multi-symbol and multi-timeframe scanner for our indicator - ACB Breakout Arrows . With default settings, it scans for the buy/sell signals on 28 currency pairs and 9 time-frames concurrently .  Features It can scan 252* combinations of symbols and time-frames from a single chart. Open the signal's chart loaded with a predefined template with a single click.  Easy drag n drop anywhere on the chart. Real-time alerts with popup, sound, push-notifications and email alerts.  Input Para
PX Trend
Vitalii Zakharuk
PX Trend is a technical indicator that mathematically transforms the price of a currency pair in the form of signaling arrows on the chart, it is used to predict the direction of the market movement. This tool is basic for the interpretation of the parameters of the graphs in technical analysis. PX Trend refers to an arrow indicator Forex - a tool that gives unambiguous signals to buy or sell currencies using arrows. An arrow directed upwards recommends buying, downward - selling. The indicat
Recommended on M15 and higher timeframes Sends alerts and notifications when the zone is create Sends alerts and notifications if zones are retested You will see the trading zones and identify the most profitable points to open positions. The indicator marks the supply and demand zones. With this show you will now make profitable trades that will set the trends. Shows all support and resistance zones. Can work in all time zones. No need to mess with complicated settings, all setti
FREE
**Vorstellung des Binary Smart Systems: Ihr ultimativer Handelsbegleiter** Das Binary Smart System ist nicht nur ein Indikator; es ist ein ausgeklügeltes Handelswerkzeug, das sorgfältig entwickelt wurde, um Händlern eine punktgenaue Genauigkeit und rechtzeitige Signale in verschiedenen Märkten zu bieten. Aufgebaut auf einer Grundlage aus hochmodernen Algorithmen und einer umfassenden Sammlung von technischen Indikatoren ist dieses System der Schlüssel, um Handelserfolg zu entfesseln. **Best
Market Profile
Artem Titarenko
5 (1)
The "Market Profile" indicator displays the profiles and volumes of periods – weekly, daily, session (8-hour), 4-hour, hour, summary. The VAH/VAL price area is automatically highlighted by a dotted line for each profile (except for the summary). The indicator includes chroma Delta, which colors the profile areas. The areas of prevailing Buys is colored in green, that of Sells - in red. The intensity histogram features blue/red respectively. In the filter mode, the indicator displays the volume a
PDP indicator is used for: defining price probability distributions. This allows for a detailed representation of the channel and its borders and forecast the probability of a price appearing at each segment of its fluctuations; defining the channel change moment. Operation principles and features PDP analyzes a quote history on lower timeframes and calculates a price probability distribution on higher ones. Forecast algorithms allow the indicator to calculate probability distributions and m
TMA Channel is a price channel obtained through a special calculation method based on traditional TMA . The channel has upper, middle, and lower tracks . When the price approaches or exceeds the upper track, it is already in an overbought state, and attention should be paid to the situation of reversal and decline; When the price approaches or falls below the lower track, it is already in an oversold state, and attention should be paid to the situation of reversal and rise . The indicator will d
Note : The slow loading of the indicator issue has been addressed . This new version loads fast and does not slow the platform. Version 1.3 : We have updated the indicator to include an historical bar scanning option . So instead of scanning all bars in the history (which can make the indicator slow sometimes ) , you can select the maximum number of bars it can scan which can increase the performance and make the indicator faster. This indicator scans the 1-3 Trendline pattern . The indic
This indicator is meant for Harmonic Traders, it helps them in identifying the formed patterns by analyzing the market past data, looking for Harmonic Patterns. The Patterns that this indicator can detect are: AB=CD Butterfly Gartely Crab Bat The indicator shows the following: The completed pattern, with the critical zone highlighted in Gray box The suggested 3 take profit levels (in green) The Suggested Stop Loss level (in Red) The formed pattern ratios can be checked by hovering the mouse on t
MQLTA Support Resistance Lines is an indicator that calculates the historical levels of Support and Resistance and display them as Lines on chart. It will also Alert you if the price is in a Safe or Dangerous zone to trade and show you the distance to the next level. The indicator is ideal to be used in other Expert Advisor through the iCustom function. This DEMO only works with AUDNZD, the full product can be found at https://www.mql5.com/en/market/product/26328 How does it work? The indicato
FREE
Rhino NW
Sergei Shishaev
Нестандартный индикатор определения текущего тренда. Альтернативный подход к определению текущей рыночной тенденции. В основе лежит уникальный алгоритм. Не используются   скользящие средние , осцилляторы , супер-тренды и прочие стандартные индикаторы. Для таймфреймов:   от M15 до D1 . Для стилей торговли:  интрадэй, свинг, долгосрок . Может стать готовой торговой стратегией совместно с любым канальным индикатором. Например таким, как индикатор   "Snake" . Внимание! Это индикатор, а не советни
HF Crosshair
Wong Sze Wai
4.5 (4)
For some trader's charts analysis use, specially for  multi timeframe trading strategies . When you need to check something of the time within different timeframe at the same symbol chart, even different symbol charts, this indicator will show the crosshair at sync moving. You just need to load this indicator into some charts, then the crosshair will shown automatic. 
FREE
Käufer dieses Produkts erwarben auch
TPSpro RFI Levels
Roman Podpora
4.82 (22)
ANWEISUNGEN    Russland -    ENG    Die Empfehlung basiert auf dem Indikator -   TPSpro   TREND PRO -   Version MT5 Die wichtigsten Elemente in der Branche sind entweder in Zonen oder in der Fabrik enthalten, oder sie führen zu einer Lösung bei einem Kauf oder dem Verkauf eines anderen Instruments. Wenn viele Menschen ihre Rechte nicht auf dem Händlerkonto verschlüsseln, werden die Folgen nicht schnell genug sein. Ich habe es damit abgeschlossen, dass ich diese Folgen nun noch interpretieren un
Atomic Analyst
Issam Kassas
5 (2)
Zunächst einmal ist es erwähnenswert, dass dieser Handelsindikator nicht neu malt, nicht neu zeichnet und keine Verzögerung aufweist, was ihn sowohl für manuellen als auch für Roboterhandel ideal macht. Benutzerhandbuch: Einstellungen, Eingaben und Strategie. Der Atom-Analyst ist ein PA-Preisaktionsindikator, der die Stärke und das Momentum des Preises nutzt, um einen besseren Vorteil auf dem Markt zu finden. Ausgestattet mit fortschrittlichen Filtern, die helfen, Rauschen und falsche Signale z
TPSproTREND PrO
Roman Podpora
4.79 (19)
TPSpro TREND PRO   ist ein Trendindikator, der den Markt automatisch analysiert und Informationen über den Trend und jede seiner Änderungen liefert sowie Signale für den Einstieg in Geschäfte ohne Neuzeichnung gibt! Der Indikator verwendet jede Kerze und analysiert sie separat. bezieht sich auf verschiedene Impulse – Aufwärts- oder Abwärtsimpuls. Exakte Einstiegspunkte in Transaktionen für Währungen, Krypto, Metalle, Aktien, Indizes! Version MT5                   VOLLSTÄNDIGE BESCHREIBUNG DES
MetaBands M4
Vahidreza Heidar Gholami
5 (2)
MetaBands verwendet leistungsstarke und einzigartige Algorithmen, um Kanäle zu zeichnen und Trends zu erkennen, sodass es Tradern potenzielle Punkte für den Einstieg und Ausstieg aus Trades bieten kann. Es ist ein Kanalindikator sowie ein leistungsstarker Trendindikator. Es umfasst verschiedene Arten von Kanälen, die einfach durch Verwendung der Eingabeparameter zusammengeführt werden können. MetaBands verwendet alle Arten von Warnmeldungen, um Benutzer über Marktereignisse zu informieren. Funkt
FX Volume
Daniel Stein
4.58 (33)
Erhalten Sie Ihr tägliches Marktupdate mit Details und Screenshots über unser Morning Briefing hier auf mql5 und auf Telegram ! FX Volume ist der ERSTE und EINZIGE Volumenindikator, der einen ECHTEN Einblick in die Marktstimmung aus Sicht eines Brokers bietet. Es bietet fantastische Einblicke in die Positionierung von institutionellen Marktteilnehmern, wie z.B. Brokern, auf dem Forex-Markt, viel schneller als COT-Berichte. Diese Informationen direkt auf Ihrem Chart zu sehen, ist der wahre Game
Scalper Inside PRO
Alexey Minkov
4.73 (56)
An exclusive indicator that utilizes an innovative algorithm to swiftly and accurately determine the market trend. The indicator automatically calculates opening, closing, and profit levels, providing detailed trading statistics. With these features, you can choose the most appropriate trading instrument for the current market conditions. Additionally, you can easily integrate your own arrow indicators into Scalper Inside Pro to quickly evaluate their statistics and profitability. Scalper Inside
Enigmera
Ivan Stefanov
5 (3)
ENIGMERA: Der Kern des Marktes https://www.enigmera.com Einführung Dieser Indikator und dieses Handelssystem sind ein bemerkenswerter Ansatz für die Finanzmärkte. ENIGMERA nutzt die fraktalen Zyklen zur genauen Berechnung von Unterstützungs- und Widerstandsniveaus. Er zeigt die echte Akkumulationsphase an und gibt Richtung und Ziele vor.  Ein System, das funktioniert, egal ob wir uns in einem Trend oder in einer Korrektur befinden.  Wie funktioniert es? ENIGMERA besteht aus drei Linien: der
FX Power MT4 NG
Daniel Stein
5 (12)
Erhalten Sie Ihr tägliches Marktupdate mit Details und Screenshots über unser Morning Briefing hier auf mql5 und auf Telegram ! FX Power MT4 NG ist die nächste Generation unseres langjährig sehr beliebten Währungsstärkemessers FX Power. Und was bietet dieser Stärkezähler der nächsten Generation? Alles, was Sie am ursprünglichen FX Power geliebt haben PLUS GOLD/XAU-Stärkeanalyse Noch präzisere Berechnungsergebnisse Individuell konfigurierbare Analysezeiträume Anpassbares Berechnungslimit für noc
Dynamic Forex28 Navigator – Das Forex-Handelstool der nächsten Generation AKTUELL 49 % RABATT. Dynamic Forex28 Navigator ist die Weiterentwicklung unserer seit langem beliebten Indikatoren und vereint die Leistung von drei in einem: Advanced Currency Strength28 Indicator (695 Bewertungen) + Advanced Currency IMPULSE mit ALERT (520 Bewertungen) + CS28 Combo Signals (Bonus) Details zum Indikator https://www.mql5.com/en/blogs/post/758844 Was bietet der Strength Indicator der nächsten Generation?
Derzeit 20% Rabatt! Die beste Lösung für jeden Neueinsteiger oder Expert Händler! Dieses Dashboard arbeitet mit 28 Währungspaaren. Es basiert auf 2 unserer Hauptindikatoren (Advanced Currency Strength 28 und Advanced Currency Impulse). Es bietet einen hervorragenden Überblick über den gesamten Forex-Markt. Es zeigt die Werte der Advanced Currency Strength, die Veränderungsrate der Währungen und die Signale für 28 Devisenpaare in allen (9) Zeitrahmen. Stellen Sie sich vor, wie sich Ihr Hande
Bomb Bank Signal
Igor Pereira Calil
5 (1)
Bombenbanksignal: Ihr Vertrauensindikator in MetaTrader 4 Bomb Bank Signal ist ein leistungsstarker Indikator für MetaTrader 4, der entwickelt wurde, um die relevantesten Trends auf dem Finanzmarkt zu identifizieren. Wenn Sie nach einem Tool suchen, das Bewegungen genau vorhersieht, ist die Bomb Bank der Verbündete, den Sie brauchen. So funktioniert es: Dieser Indikator kombiniert drei unterschiedliche Methoden – Volumenanalyse, Kerzenschließungen und symmetrischer Trend –, um Kauf- und V
TakePropips Donchian Trend Pro
Eric John Pajarillaga Aldana
4.44 (16)
TakePropips Donchian Trend Pro   (MT4) ist ein leistungsstarkes und effektives Tool, das mithilfe des Donchian-Kanals automatisch die Richtung des Trends erkennt und Ihnen Handelssignale für den Ein- und Ausstieg liefert! Dieser Multifunktionsindikator umfasst einen Trendscanner, Handelssignale, ein statistisches Panel, einen Screener, Handelssitzungen und ein Dashboard für den Verlauf von Warnungen. Es wurde entwickelt, um Ihnen Handelssignale zu liefern und Ihnen Stunden beim Analysieren der C
Supply and Demand Dashboard PRO
Bernhard Schweigert
4.8 (20)
Derzeit 20% reduziert! Dieses Dashboard ist eine sehr leistungsfähige Software, die mit mehreren Symbolen und bis zu 9 Zeitrahmen arbeitet. Es basiert auf unserem Hauptindikator (Beste Bewertungen: Advanced Supply Demand ).   Das Dashboard gibt einen guten Überblick. Es zeigt: Gefilterte Angebots- und Nachfragewerte einschließlich der Zonenstärkebewertung, Pips-Abstände zu/und innerhalb von Zonen, Es hebt verschachtelte Zonen hervor, Es gibt 4 Arten von Alarmen für die gewählten Symbole in
DERZEIT 26% RABATT Die beste Lösung für jeden Newbie oder Expert Trader! Dieser Indikator ist ein einzigartiges, qualitativ hochwertiges und erschwingliches Trading-Tool, da wir eine Reihe von proprietären Funktionen und eine neue Formel integriert haben. Mit nur EINEM Chart können Sie die Währungsstärke für 28 Forex-Paare ablesen! Stellen Sie sich vor, wie sich Ihr Handel verbessern wird, weil Sie in der Lage sind, den genauen Auslösungspunkt eines neuen Trends oder einer Scalping-Gelegenh
PZ Day Trading
PZ TRADING SLU
3.67 (3)
Dieser Indikator erkennt Preisumkehrungen im Zick-Zack, wobei nur Preisaktionsanalysen und ein Donchian-Kanal verwendet werden. Es wurde speziell für den kurzfristigen Handel entwickelt, ohne dass ein Nachlackieren oder ein Backpainting erforderlich ist. Es ist ein fantastisches Werkzeug für clevere Trader, die darauf abzielen, das Timing ihrer Operationen zu verbessern. [ Installationsanleitung | Update-Anleitung | Fehlerbehebung | FAQ | Alle Produkte ] Erstaunlich einfach zu handeln Es bi
Advanced Supply Demand
Bernhard Schweigert
4.91 (294)
Derzeit 33% Rabatt! Die beste Lösung für jeden Anfänger oder erfahrenen Händler! Dieser Indikator ist ein einzigartiges, qualitativ hochwertiges und erschwingliches Trading-Tool, da wir eine Reihe von proprietären Funktionen und eine neue Formel integriert haben. Mit diesem Update werden Sie in der Lage sein, doppelte Zeitrahmenzonen anzuzeigen. Sie können nicht nur einen höheren TF (Zeitrahmen) anzeigen, sondern sowohl den Chart-TF als auch den höheren TF: SHOWING NESTED ZONES. Alle Supply Dema
Gold Channel is a volatility-based indicator, developed with a specific timing algorithm for the XAUUSD pair, which consists of finding possible corrections in the market. This indicator shows two outer lines, an inner line (retracement line) and an arrow sign, where the theory of the channel is to help identify overbought and oversold conditions in the market. The market price will generally fall between the boundaries of the channel. If prices touch or move outside the channel it is a tra
Currency Strength Exotics
Bernhard Schweigert
4.87 (30)
Stärke von 8 Währungen plus EIN EXOTISCHES Paar oder Rohstoffe oder Indexe! Jedes Produkt kann als 9. Linie hinzugefügt werden. Fügen Sie Rohstoffe, Indexes oder exotische Währungen hinzu (Gold, Silber, Öl, DAX, US30, MXN, TRY, CNH ...). Eine neue noch nie dagewesene TRADING STRATEGIE  !!! Dieser Indikator ist einzigartig, weil wir eine Reihe von proprietäre Funktionen und neue Formeln eingebaut haben. Es funktioniert für alle Zeitrahmen. Basierend auf neuen zugrunde liegenden Algorithmen ist
Quantum Trend Monitor Indicator
QUANTUM TRADING SOFTWARE LIMITED
Currency pairs never go up or down in a straight line. They rise and fall constantly, creating pullbacks and reversals. And with each rise and fall, so your emotions rise and fall. Hope, then fear, then hope. This is when the market will try to frighten you out of a strong position. It is when you are most vulnerable. But not if you have the Quantum Trend Monitor. And here, you even get two indicators for the price of one! The Quantum Trend Monitor has been designed to absorb these temporary pau
Quantum Volume Point of Control Indicator
QUANTUM TRADING SOFTWARE LIMITED
5 (1)
The Quantum VPOC indicator has been developed to expand the two dimensional study of volume and price, to a three dimensional one which embraces time. The volume/price/time relationship then provides real insight to the inner workings of the market and the heartbeat of sentiment and risk which drives the price action accordingly. The Quantum VPOC indicator displays several key pieces of information on the chart as follows: Volume Profile - this appears as a histogram of volume on the vertical pr
XQ Indicator MetaTrader 4
Marzena Maria Szmit
3.67 (3)
Step into the realm of Forex trading with confidence and precision using XQ, a cutting-edge Forex indicator designed to elevate your trading game to unprecedented heights. Whether you're a seasoned trader or just stepping into the world of currency exchange,   XQ Forex Indicator   empowers you with the insights and signals needed to make informed trading decisions. The signal conditions are a combination of three indicators, and XQ Forex Indicator only display  medium and long-term trends . The
NextCandlePredictor No Repaint
Martin Alejandro Bamonte
1 (1)
NextCandlePredictor Indikator NextCandlePredictor, ein Signalindikator mit Alarm, der nicht neu zeichnet, seine Farbe nicht ändert, sich nicht bewegt, nicht verschwindet und keine Verzögerung hat. Er hilft Ihnen, die Richtung der nächsten oder kommenden Kerzen in jedem Zeitrahmen zu identifizieren. Sehr empfehlenswert für hoch volatile Märkte wie New York, London oder sogar die Überlappung beider. Hauptmerkmale: Vielseitigkeit in Zeitrahmen: Bietet schnelle und genaue Signale in jedem Zeitrahmen
Entdecken Sie das Geheimnis des erfolgreichen Forex -Handels mit unserem benutzerdefinierten MT4 -Indikator! Haben Sie sich jemals gefragt, wie Sie Erfolg auf dem Forex -Markt erzielen können und gleichzeitig Gewinne erzielen und gleichzeitig das Risiko minimieren können? Hier ist die Antwort, nach der Sie gesucht haben! Erlauben Sie uns, unseren proprietären MT4 -Indikator vorzustellen, der Ihren Handelsansatz revolutionieren wird. Einzigartige Vielseitigkeit Unser Indikator ist speziell
Wir stellen vor       Quantum Trend Sniper Indicator   , der bahnbrechende MQL5-Indikator, der die Art und Weise, wie Sie Trendumkehrungen erkennen und handeln, verändert! Entwickelt von einem Team erfahrener Händler mit über 13 Jahren Handelserfahrung,       Quantum Trend Sniper-Indikator       wurde entwickelt, um Ihre Trading-Reise mit seiner innovativen Methode zur Identifizierung von Trendumkehrungen mit extrem hoher Genauigkeit auf ein neues Niveau zu heben. ***Kaufe Quantum Trend Snipe
RelicusRoad Pro
Relicus LLC
4.64 (103)
Jetzt 147 US -Dollar (nach ein paar Aktualisierungen auf 499 US -Dollar) - Unbegrenzte Konten (PCs oder MACs) RelicusRoad Benutzerhandbuch + Schulungsvideos + Zugang zur privaten Discord-Gruppe + VIP-Status EINE NEUE ART, DEN MARKT ZU BETRACHTEN RelicusRoad ist der weltweit leistungsstärkste Handelsindikator für Forex, Futures, Kryptowährungen, Aktien und Indizes und gibt Händlern alle Informationen und Tools, die sie benötigen, um profitabel zu bleiben. Wir bieten technische Analysen un
Royal Scalping Indicator M4
Vahidreza Heidar Gholami
4.17 (6)
Royal Scalping Indicator is an advanced price adaptive indicator designed to generate high-quality trading signals. Built-in multi-timeframe and multi-currency capabilities make it even more powerful to have configurations based on different symbols and timeframes. This indicator is perfect for scalp trades as well as swing trades. Royal Scalping is not just an indicator, but a trading strategy itself. Features Price Adaptive Trend Detector Algorithm Multi-Timeframe and Multi-Currency Trend Low
Cycle Sniper
Elmira Memish
4.39 (36)
NEW YEAR SALE PRICE FOR LIMITED TIME!!! Please contact us after your purchase and we will send you the complimentary indicators to complete the system Cycle Sniper is not a holy grail but when you use it in a system which is explained in the videos, you will feel the difference. If you are not willing to focus on the charts designed with Cycle Sniper and other free tools we provide, we recommend not buying this indicator. We recommend watching the videos about the indiactor and system before pu
Trend Arrow Super
Aleksandr Makarov
5 (1)
Trend Arrow Super The indicator not repaint or change its data. A professional, yet very easy to use Forex system. The indicator gives accurate BUY\SELL signals. Trend Arrow Super is very easy to use, you just need to attach it to the chart and follow simple trading recommendations. Buy signal: Arrow + Histogram in green color, enter immediately on the market to buy. Sell signal: Arrow + Histogram of red color, enter immediately on the market to sell. Please email me after your purchase!
Scalper gun
Mikhail Nazarenko
4.5 (2)
Scalper gun   - the main weapon for trade in scalping and swing, with visualization and alert of entry points. The indicator works in both trend and non-trend market conditions. Suitable for beginners and experienced traders. SCALPER GUN surpasses popular top indicators of this site in speed, quality of visualization and accuracy of entry !!! Before buying, download the Scalper gun demo and compare it with similar indicators for scalping in the MT4 tester. Features This is a complete trading s
AV Stop Hunter
Anja Vivia Vogel
"AV Stop Hunter" ist ein Indikator für MetaTrader 4, welcher Einstiegspfeile für Long und Short nach sogenannten Stop-Hunt-Kerzen zeichnet und über mehrere Benachrichtigungen darüber verfügt. Da es sich hier um ein Smart Money Konzept handelt, eignen sich die Perioden H1 und H4 am besten. Steigendes Volumen verstärkt das Signal, Linien und Pfeile sind dann dicker. Die MQL5 Variante hat farbige Stop-Hunting-Kerzen. Definition : Stop Hunting auch als Stop Running bezeichnet, ist die Praxi
Weitere Produkte dieses Autors
SW Scalper
Mhd Amran Bin Lop
SW Scalper EA SW Scalper is a fully automated Expert Advisor based on scalping when indicated the market makes a fast movement. It uses smart algorithms to open any trade.Also this system come with very smart Money Management code and not like other Expert Advisor with this ea you will cant use fixed lot to trade. You must use the very smart Money Management system inside this ea to open any trade, you will need only to put your risk and the system will do all other job for you. And if you put
Engulfing Dashboard is a forex system that can help you generate forex profits easily without having to work hard to learn forex knowledge because this Dashboard is complete with all the facilities and functions that are sophisticated and effective. This system is made based on Supply and Demand techniques to measure Market Direction (trend) more accurately than using indicators such as Moving Average, MACD, trendline and so on. It is made using a certain formula so that the accuracy of the m
Winner Overbought Oversold Winner Overbought Oversold indicators are best suited for overbought/oversold analysis. Basically, there are two types of momentum oscillators: bound and unbound. Bound oscillators, such as this, fluctuate within a specific range. The most popular indicators used to identify overbought and oversold conditions are the   relative strength index (RSI)   and the   stochastic oscillator . But you need a second conformation for entry and exit position from forex market.
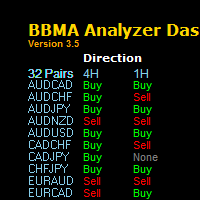
" The one of keys to trading success is a System Technique , MUST HAVE THIS SYSTEM!" BBMA Analyzer Dashboard BBMA is a popular technique that uses a combination of 2 indicators in MetaTrader 4 or MT4 which using Bollinger Band and Moving Average Indicator. Summary of BBMA Techniques has the basic elements: RE-ENTRY Formed after fall or price increase. Price will form a Sideway to enable Re-Entry. CSAK (Strong Direction Candle) The strong direction candle is a close candle directio
MHV Grid
Mhd Amran Bin Lop
MHV Grid EA The  MHV Grid  EA uses the RSI indicator to enter the trade. To enter BUY, the RSI must cross the bottom up the value specified in the EA parameters (for the sales, on the contrary, cross from top to bottom). In case of a successful entry, the transaction closes either according to Trailing Stop is used. If the market goes in opposite direction, the order grid opens at a specified distance from the average price of the grid. Also, newly opened orders can be filtered using Bollin
William Intraday
Mhd Amran Bin Lop
William Intraday   This pure TREND  system is based on Price Action and Williams Percent Range Indicators. The EA has an innovative signal filter and adaptive trailing stop. Always sets Stop Loss and Take Profit to protect the deposit. This EA works best in pair EURUSD Timeframe for run this EA is best is H1 * No toxic or margin hugging technique, like Martingale, Averaging, Gridding, Zone Recovery Strategy.
Fibo Sequence
Mhd Amran Bin Lop
Fibo Sequence EA The EA Strategy: This EA strategy is based on Fibonacci Sequence number Calculations to produce it's own signals and trade automatically. It was built for those traders who loves and trust Fibonacci Levels. In finance, Fibonacci level is a method of technical analysis for determining support and resistance levels. They are named after their use of the Fibonacci sequence.  Fibonacci is based on the idea that markets will retrace a predictable portion of a move, after which they
Various Trailing Manager EA Various Trailing Manager EA is a professional trader's tool that provides protection of floating profit on open trades. This EA Utility allows you to manage (with advanced filtering) unlimited open orders (manual or EA) with trailing stops based on 7 methods: percent, ATR, Moving Average, Candle, Parabolic, Fractal. The trailing stop can be either real or virtual, and you can exit fully or with a partial close percent on touch or bar close. Visualize all orders and
Supply and Demand Dashboard Supply and Demand Dashboard is a forex system that can help you generate lucrative profits from forex easily without having to work hard to learn forex knowledge because this Dashboard is complete with all the needs and functions that are sophisticated and effective for a forex trader. This system is made based on Supply and Demand techniques to measure Market Direction (trend) more accurately than using indicators such as Moving Average, MACD, trendline and so
EagleEye
Mhd Amran Bin Lop
EagleEye is an automated trading system that uses a indicator and price action to open and close trades. Trades every day at a full time. Every trade has Stop Loss from very beginning, and they do not change. This is for those, who are looking for steady and stable growth over the long run. The EA works according to the "Trend Follow" strategy, which means following the trend. Doesn't use grid, martingale or other dangerous money management methods. Timeframe H1, currency pairs EURUSD, GBPU
The Burst MT4
Mhd Amran Bin Lop
The Burst MT4 Hurry and Buy Before Price Doubles Tomorrow! *Non-Repainting Indicator "The Burst" is an indicator that shows precise Buy and Sell Trades. A great arsenal to add to any chart. It's Best to Use The D1,H4 or H1 chart "The Burst" is designed to alert BUY and SELLS. So Of course, For the best take The Arrows In a Uptrend or Downtrend Only For Confirmation *Non-Repainting *For Desktop MT4 Only *Great For Scalping *Great For Intraday *Great For Swing Trading *Arrow Appears at  The "Clo
Star Forecast
Mhd Amran Bin Lop
Star forecast is an analytical toolkit used to help currency traders with foreign exchange trading analysis through technical charts and indicators. Forex forecasting which help analysts and traders to determine appropriate and profitable entry and exit points for their forex trades. *Non-Repainting *For Desktop MT4 Only *Great For Intraday *Great For Swing Trading *Star Appears at  The "Close Of The Candle" *Attach On H1 Timeframe for see Daily Trend *Works On Any Mt4 Pair *Perfect For New Tr
Pure Engulfing EA
Mhd Amran Bin Lop
The Engulfing candlestick setup has a strong reversal character. If the price is increasing and an Engulfing pattern is created on the way up, this gives us a signal that a top might be forming now. The opposite is in force too. If the price is decreasing and an Engulfing pattern appears on the chart, this suggests that the price action might be forming a bottom. ONLY 4 COPIES OUT OF 10 LEFT AT $98 ! After that, the price will be raised to $289. Pure Engulfing EA   it is a fully automated “Engul
TripleStar Trend Indicator, Breakthrough Solution For Trend Trading And Filtering With All Important trend Tool Features Built Inside One Tool!    This is a custom MT4 ( Metatrader 4 ) indicator that analyzes the trend and volatility analyzer indicator.  In addition, It identifies the beginning and the end of the trend that works for most currency pairs and timeframes. The Trend Monitor indicator is using an optimized formula based on momentum  to calculate the trend volatiltiy. Our indicator
DepthTrendView
Mhd Amran Bin Lop
DepthTrendView is an indicator that is used to see the direction of the market very clearly compared to the indicators that are commonly used by many people. What is interesting about this indicator is that you can see the direction of the trend and also know that the market is at the end or that the market wants to start a new trend. How to Use: 1- To see the earliest BUY direction you need to see previous candle below Aqua Line before green arrow appear. 2- To see the earliest SELL dire
Auswahl:
Keine Bewertungen
Antwort auf eine Rezension