Supply Demand ZoneX
- Indikatoren
- Mohamed yehia Osman
- Version: 1.83
- Aktualisiert: 7 März 2022
- Aktivierungen: 5
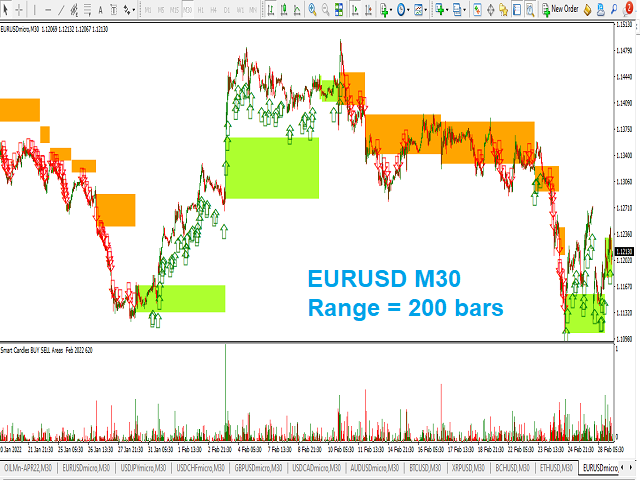
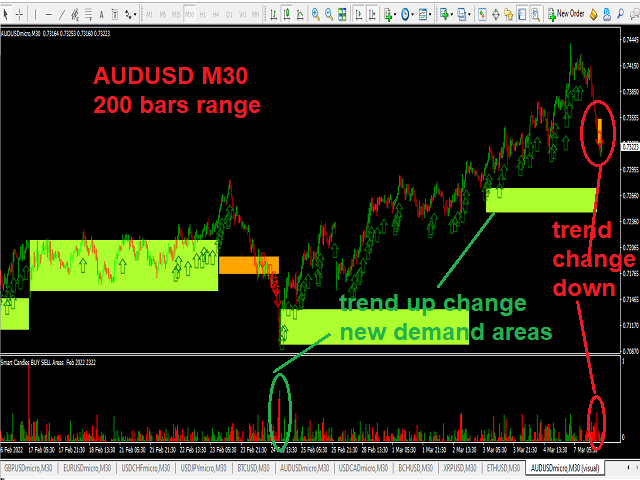
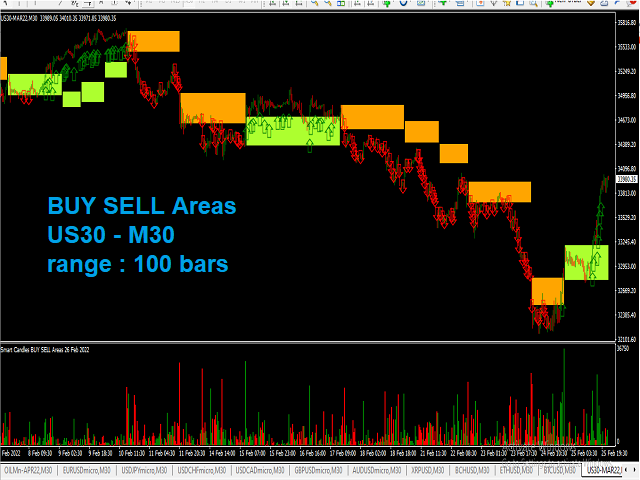
Supply Demand Zones
indicator for possible BUY / Sell Zones based on smart volumes indicator
two levels of buy/Sell Zones : Main BUY/SELL area
SUPPLY area in Red
DEMAND area in Green
your strategy is to follow generated Arrows :
1- you can Buy when price is Closed above a green BUY area and above high of previous candle
2- you can Sell when price is Closed below a red SELL area and below low of previous candle
Also, a separate indicator window for SMART CANDLES used to detect the Big Supply Demand Areas
Always Supply Demand areas corresponds to large smart candles in secondary indicator window
inputs :
1- range = number of previous history bars used in continuous calculations
2- enable/disable alerting