• Übersicht
  • Bewertungen
  • Diskussion (2)
  • Neue Funktionen

Divergence Range

Divergence Range

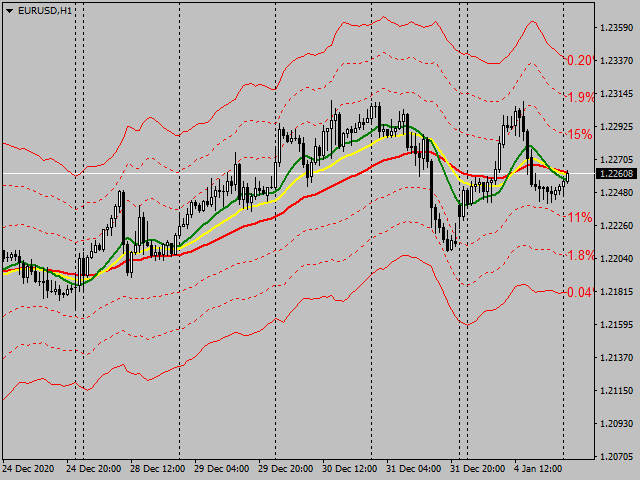
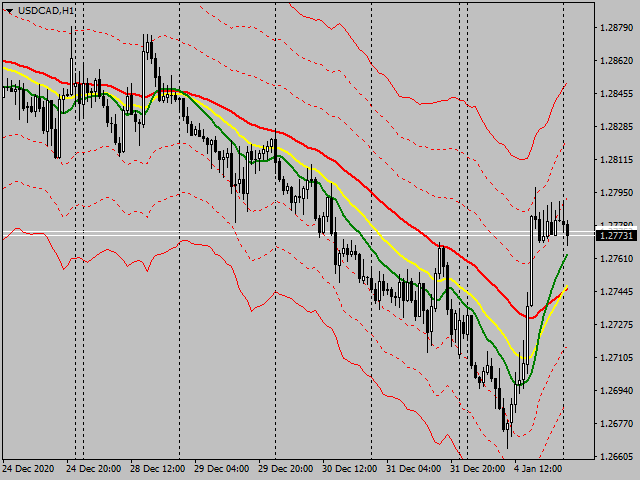
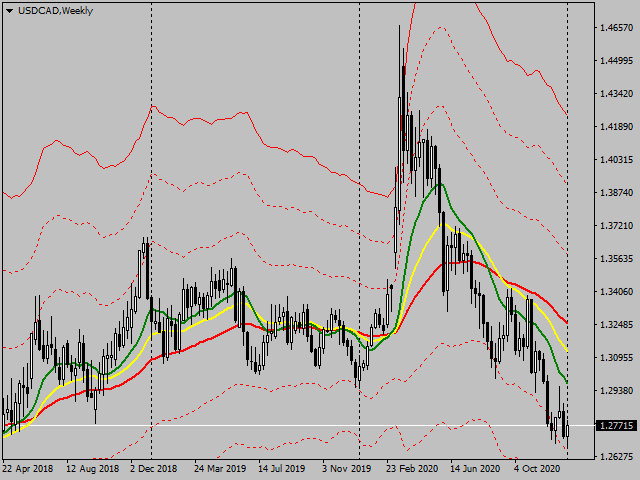
Divergence Range is a very simple and yet effective indicator that calculate the price divergence range from a standard moving average indicator.

The indicator has two groups of line, three lines, upper1, upper2, upper3 above a standard moving average and three lines below, lower1, lower2, lower3, which shows the divergence range for the price movement from the standard moving average. The two out most line virtually covers more than 95% of the price movement from the standard moving average.

Parameters

Period = 48 (default)

Shift = 0 (default)

Method = Exponential (default)

Show Statistics = true (default)

Statistic Unit = 2500 (default)


Period/shift/Method:  This is the standard period parameter for a moving average, you can select any type of moving average. The general guideline is that you shall relative longer period, to obtain a more stable and smooth divergence range.

Show Statistics/Statis unit: This are the parameter to show the statistic of the effectiveness of divergence range. It turns on, the indicator will show a percentage of the price high exceed the respective upper line and the percentage of low falls below the respective lower line.


Main features

1.       Usually there are less than 20% of unit exceed the range covered between upper1 and lower1 line.

2.       Usually there are less than 5% of unit exceed the range covered between upper2 and lower2 line.

3.       Virtually there are less than 2% of unit exceed the range covered between upper3 and lower 3 line. These give you a confidence when price are at extreme situation, therefore the rally make happen soon.

Recommended trading strategy

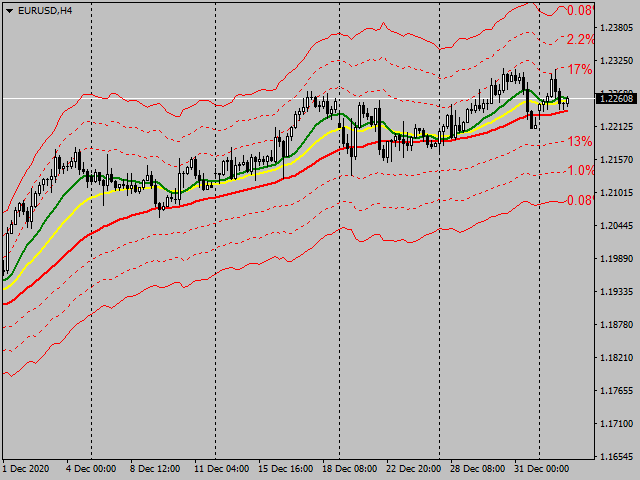
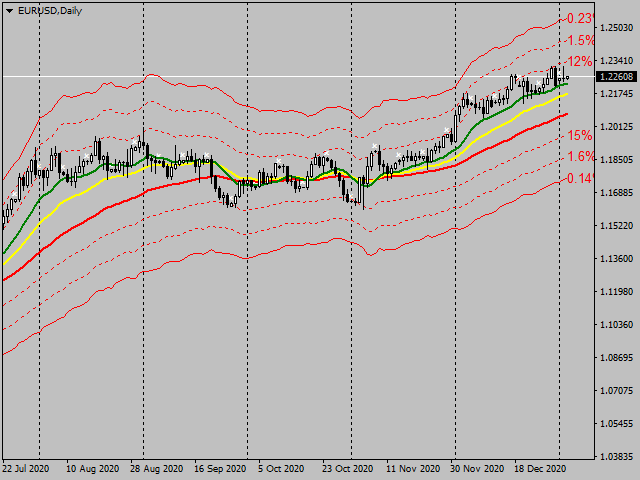
·         Apply the indicator to D1 or H4 chart for any product. And comebine it with other moving average trading strategy.

Please give your valuable feed back for me to improve the indicator.


Empfohlene Produkte
The Standard Deviation (StdDev) indicator drawn using a tick chart. After launching it, wait for enough ticks to come. Parameters: Period - period of averaging. Method - method of averaging. calculated bar - number of bars for the indicator calculation.
Индикатор  Powerful trend indicator превосходно показывает текущую тенденцию. Индикатор  Powerful trend indicator не перерисовывает не меняет свои значения. Советую пользоваться тремя периодами индикатора для фильтра сигналов. The Powerful trend indicator perfectly shows the current trend. The Powerful trend indicator does not redraw or change its values. I advise you to use three periods of the indicator to filter signals.
Hello This Indicator will draw Green (Up) and Red (Down) small arrows from Multi TimeFrames based in ( Average True Range ) to help you to take decision to buy or sell or waiting If there 4 green arrows in same vertical line that's mean (Up) and If there 4 Red arrows in same vertical line that's mean (Down)  and the options contain (Alert and Mobile , Mail Notifications). Please watch our video for more details https://youtu.be/MVzDbFYPw1M and these is EA for it https://www.mql5.com/en/market/pr
How to find out where to expect a price reversal with a probability of 80% - 90%? The "Statistics of Price Movements" indicator collects statistics of significant price movements, skipping all small pullbacks, for a certain period of time and displays them in Excel file. Sort the data in ascending order and get statistics of price reversals in 80%, 85%, 90%, 95% of all cases! (for example, in 2 years!) After the reversal, the price will move from 1000 pips or more! So... Open the dail
Tiks ATR 4
Andrej Nikitin
The  Average True Range (ATR)  indicator drawn using a tick chart. After launching it, wait for enough ticks to come. Parameters: ATR Period  - number of single periods used for the indicator calculation. The number of ticks to identify Bar  - number of single ticks that form OHLC. Price levels count  - number of displayed price levels (no levels are displayed if set to 0 or a lower value). price mode  - choice of prices under calculation (can be bid, ask or average). Сalculated bar  - number of
ADX Trend mt4
Natasha Diedericks
This indicator takes input from the ADX, and presents the output in a separate indicator window as a histogram. Great for scalping. Settings: ADXPeriod Features Alerts. How to use: Simply attach to any chart with default setting, or set the ADXPeriod to your preference. Zoom chart in to get a better view of the histo color. Buy:  Blue histo color on multiple timeframes. (e.g., M30-H1-H4-D) Sell: Red histo color  on multiple timeframes. Or backtest and use as you see fit for your strategy. Best
DR IDR Pro mt4
Barend Paul Stander
5 (1)
Defining Range ( DR ) and Implied Defining Range ( IDR  ) indicator Pro with added features from free version Show DR and IDR ranges Sessions on the chart for   RDR     Regular defining range (New York Session) ADR    After defining range (Asian session) ODR     Outside defining range (London Session) Buttons on chart to enable / disable : Show  Imbalance ( IMB ) Show Volume Imbalance ( VIB ) Show  Gap's between open and close Show  Standard Deviation ( SD ) Show last 3 Sessions
Super Pair Strong Indicator is a highly popular momentum and trend indicator that utilizes multiple currencies to determine trends. It is a one-chart indicator that combines the algorithms of the MACD and Currency Strength Meter. With its one-click feature, users can view 28 major and minor pairs on their dashboard, and by clicking on a specific pair, the chart will automatically change to the user's preferred chart. In addition to its user-friendly interface, Super Pair Strong Indicator offers
如果产品有任何问题或者您需要在此产品上添加功能,请联系我 Contact/message me if you encounter any issue using the product or need extra feature to add on the base version. To access the free demo version, please re-direct to this LINK . To access the single pair version, please re-direct to this LINK . Price is likely to pullback or breakout at important support and/or resistance. This dashboard is designed to help you monitor these critical support and resistance area. Once price moves close to these important support an
Ticks ADX 4
Andrej Nikitin
The Average Directional Movement Index indicator drawn using a tick chart. After launching it, wait for enough ticks to come. Parameters: Period - period of averaging. Сalculated bar - number of bars on the chart for the indicator calculation. Buffer indexes: 0 - MAIN_LINE, 1 - PLUSDI_LINE, 2 - MINUSDI_LINE.
This Scanner will help you to get Pivot points , Resistance and Support Points on the Symbols in your watchlist, using this and the best part is it give alert in all format whether its a e-mail, or Phone Notification alert, or Pop-up Alerts.  There are multiple points as : 1) Standard Pivot Points 2) Fibonacci Pivot points  3) Camarilla Pivot points  4) Woddie Pivot points. 5) Bollinger Bands. Type of Alerts are : 1) Cross Alert. 2) Near_Alert. 3) Cross and Bounce Alert. 4) Bounce only Alert.
Trend Code
Ning Liu
4 (1)
Trend Code (v2.0) Trend Code is a very simple and yet effective trend indicator to capture trend movement, detect the trend reversal, calculate entry price as well as proper stop loss. Trend Code indicator is made up of a series of block, while bull trend block in bull colour and bear block in bear trend colour. For bull trend block, the TrendOpen is the lower edge, TrendClose is the upper edge, for bear trend block, the other way round. Parameters: TrendOpenAdjustment   = 0.8, (range 0~1.0) Tr
An Indicator that calculates the Pivot Point line,  along with the 2 levels of support and resistance lines, known as S1, S2, R1, R2 respectively. The formulas for calculation are as follows: Pivot point (PP) = (High + Low + Close) / 3 First level support and resistance: First resistance (R1) = (2 x PP) – Low First support (S1) = (2 x PP) – High Second level of support and resistance: Second resistance (R2) = PP + (High – Low) Second support (S2) = PP – (High – Low) The trader can adj
Are you tired of missing crucial market movements? Do you wish for a tool that not only identifies swing points but also provides insights into price action movements? Look no further – our Market Structure Analysis indicator is here to revolutionize the way you analyze markets on MQL5! MT5 Version :  WH Market Structure Analysis MT5 Key Features: Swing Point Detection: Our indicator excels at identifying significant swing points in the market, helping you understand key turning points with p
Live trade ideas from mytradingpet.com, derived from comprehensive technical analysis, historical patterns, and advanced AI algorithms. Access daily performance reports, automatically generated and updated for your convenience. Top performer:  +2106.73%   (NZDUSD over one year through 1221 trades)* Happy trading! * As of May 25, 2024, performance statistics are updated daily. Visit mytradingpet.com for the latest reports. Trade ideas available for 8 FOREX pairs  {"EURUSD","USDJPY","GBPUSD","AUDU
Mit dem SR Dashboard erhalten Sie ein mächtiges Werkzeug zur Kontrolle von einigen der wichtigsten Informationen im Trading. Stellen Sie sich ein Setup ganz nach ihrer Strategie zusammen und lassen sich informieren, sobald dieses Setup gültig ist. Vergeben Sie verschiedene Punkte auf ausgewählte Bedingungen. Wählen Sie aus Trend, Average Daily Range, Moving Averages, Pivot (Daily, Weekly, Monthly), Highs und Lows sowie Candlestick-Pattern. Hinweis: Dieser Indikator kann nicht im Strategietester
The indicator automatically sets trendlines on the really important points directly on the chart. Timeframe, color and style of the lines can be adjusted. Notification of a breakout above or below the line via a smartphone is possible. Inputs Timeframe - Choose timeframe TrendlineColor - Choose line color TrendlineStyle - Line styles (solid, dash, dot, dash dot, dash dot dot) Alerts - True = alert SendNotifications - True = Notification via a smartphone
Iterative Moving Average – IMA.   IMA is obtained by correcting the usual   MA.   The correction consists in addition   to MA averaged difference between the time series (X) and its MA, i.e.   IMA(X)=MA(X) + MA ( Х -MA(X)). Correction is done in several iterations (and, exactly, 2 iterations in this indicator) and with a change in the averaging period.               As a result, the time-series points begin to cluster around (on all sides) of the getting   IMA and with a smaller de
The indicator Universal Main Window works according to your rules. It is sufficient to introduce a formula, along which the line of the indicator will be drawn. This indicator is intended for use in the main chart window. All indicators of the series Universal : Main window Separate window Free MT4 Universal Main Window Free MT5 Universal Main Window Free MT5 MT4 Universal Separate Window Free MT5 Universal Separate Window Free MT5 Full MT4 Universal Main Window MT5 Universal Main Window MT
Hidden Breakout Power   The market has a cycle, keeps on moving from: RANGE -> BREAKOUT -> TREND ->CONSOLIDATION ->RANGE RANGE and TREND The two major states, while the BREAKOUT refer to the short period of market breaking the range, CONSOLIDATION refer to the long consolidation of market and shrink to range. Usually oscillatory indicator performs well in RANGE states and perform poorly in trend state, while TREND indicator is the other way around, it performs will in a TREND states and but poor
Rira Renko
Vitor Palmeira Abbehusen
RENKO on Time Chart This indicator is an enhanced Renko, so you can watch the Renko bricks on the chart to understand price movement more clearly the other improvement is automated box size according to ATR (Average True Range) period you can set the ATR number as you want and the box size of Renko changes automatically based on price movement Inputs Mode: Box size is the input to specify the size of the Renko box you want to print on the chart. This input lets you choose the fixed b
The indicator finds the Pin bars on the chart, perhaps, the most powerful Price Action pattern. The indicator has additional filters, and the user can: specify all parameters of the pin bar size as a percentage of the total candle size (minimum length of the large wick, maximum values of the short wick and body size). set the number of fractals for the last N bars, the Pin bar is based on, i.e. define the support/resistance levels. specify the required number of bearish/bullish bars before the P
The indicator calculates the price of the trading instrument based on the RSI percentage level. The calculation is performed by Close prices, so that we can quickly find out the price, at which RSI shows the specified percentage level. This allows you to preliminarily place stop levels (Stop Loss and Take Profit) and pending orders according to significant RSI points with greater accuracy. The indicator clearly shows that RSI levels constantly change, and the difference between them is not fixed
Super Prediction System
Ondrej Frlicka
4.73 (15)
Introduction Super Prediction System is the only indicator that does not show delayed trading signals, but shows them ahead of time! It gives you an opportunity to have the trading signals right in your MT4 sooner than other traders. This indicator does not repaint and never changes signals in the history! For all you can see in the history, the indicator will show exactly the same in real time. The indicator does not wait on the reaction of a new candle, but shows the signal (arrow) immediately
ThreeAngleR
Vasiliy Anokhin
The triple oscillator indicator " ThreeAngleR " is a common indicator for three calculators of the angular deviation of the price chart of a trading instrument. INPUT PARAMETER: Input1 = " AnglerSPeriod "; - DRAWs1 =128 - Number of bars to display the indicator in the chart history; - PeriodIND =14 - calculation period of the indicator in the number of bars; Input2 = " JAngleR "; - DRAWs2 =128 - Number of bars to display the indicator in the chart history; - Period_IND =14 - calculation perio
This indicator takes input from the ADX from multiple time frames (M/W/D/H4/H1), and presents the output on the main chart. Great for scalping. Features alert for current chart's ADX. TrendLine period setting. How to use: Simply attach to any chart. User can set the period for ADX(Monthly, Weekly, Daily, H4, H1,Current chart) Zoom chart out completely. Hover over the lines to see the time frame applicable. Buy when Multi ADX below price; also blue dots and white line below price. Sell when Mul
Dieser Angebots- und Nachfragezonenindikator zeichnet die Zonen auf dem Chart und sendet Warnungen, wenn der Preis eine Zone erreicht oder durchbrochen hat. Es ist auch möglich, es zu verwenden, um über reguläre doppelte Tops/Bottoms anstelle von Zonen benachrichtigt zu werden. Es ist möglich, RSI-, Volumen- und Divergenzfilter zu verwenden, um nur die stärksten Setups herauszufiltern. In Kombination mit Ihren eigenen Regeln und Techniken ermöglicht Ihnen dieser Indikator, Ihr eigenes leistungss
The main idea of this indicator is rates analysis and prediction by Fourier transform. Indicator decomposes exchange rates into main harmonics and calculates their product in future. You may use the indicator as a standalone product, but for better prediction accuracy there is another related indicator - FreqoMaster - which uses FreqoMeterForecast as a backend engine and combines several instances of FreqoMeterForecast for different frequency bands. Parameters: iPeriod - number of bars in the ma
The arrow indicator without redrawing shows potential entry points into the market in the form of arrows of the appropriate color: the up arrows (usually green) suggest opening a purchase, the red down arrows suggest selling. The appearance of arrows may be accompanied by beeps. It is usually assumed to enter at the next bar after the pointer, but there may be non-standard recommendations. Arrow indicators visually "unload" the price chart and save time for analysis: no signal – no deal, if ther
Advanced Currency Strength Indicator The Advanced Divergence Currency Strength Indicator. Not only   it breaks down all 28 forex currency pairs   and calculates the strength of   individual currencies   across   all timeframes , but,   You'll be analyzing the WHOLE forex market in 1 window   (In just 1 minute) . This indicator is very powerful because it   reveals the true movements of the market.  It is highly recommended to  analyze charts knowing the performance of individual currencies or
Käufer dieses Produkts erwarben auch
Gann Made Easy
Oleg Rodin
4.93 (72)
Gann Made Easy ist ein professionelles und einfach zu bedienendes Forex-Handelssystem, das auf den besten Handelsprinzipien unter Verwendung der Theorie von Mr. basiert. W.D. Gann. Der Indikator liefert genaue KAUF- und VERKAUFSsignale, einschließlich Stop-Loss- und Take-Profit-Levels. Mit PUSH-Benachrichtigungen können Sie auch unterwegs handeln. Bitte kontaktieren Sie mich nach dem Kauf! Ich werde meine Handelstipps und tolle Bonusindikatoren kostenlos mit Ihnen teilen! Wahrscheinlich haben Si
DERZEIT 26% RABATT Die beste Lösung für jeden Newbie oder Expert Trader! Dieser Indikator ist ein einzigartiges, qualitativ hochwertiges und erschwingliches Trading-Tool, da wir eine Reihe von proprietären Funktionen und eine neue Formel integriert haben. Mit nur EINEM Chart können Sie die Währungsstärke für 28 Forex-Paare ablesen! Stellen Sie sich vor, wie sich Ihr Handel verbessern wird, weil Sie in der Lage sind, den genauen Auslösungspunkt eines neuen Trends oder einer Scalping-Gelegenh
Trend Punch
Mohamed Hassan
5 (10)
Manual guide:   Click here PROMO of  $79 for 2 copies left!  -- Next price is  $149 .  This indicator is unstoppable when combined with our other indicator called  Support & Resistance . After purchase, send us a message and you will get it   for  FREE as a BONUS! I like to use Trend Punch on XAUUSD & BTCUSD on the M1 timeframe!  Introducing Trend Punch , the revolutionary forex trend indicator that will transform the way you trade! Trend Punch is uniquely designed to provide preci
Scalper Inside PRO
Alexey Minkov
4.74 (58)
An exclusive indicator that utilizes an innovative algorithm to swiftly and accurately determine the market trend. The indicator automatically calculates opening, closing, and profit levels, providing detailed trading statistics. With these features, you can choose the most appropriate trading instrument for the current market conditions. Additionally, you can easily integrate your own arrow indicators into Scalper Inside Pro to quickly evaluate their statistics and profitability. Scalper Inside
TPSpro RFI Levels
Roman Podpora
4.82 (17)
Reversal First Impulse levels (RFI)    INSTRUCTIONS        RUS       -       ENG              R ecommended to use with an indicator   -   TREND PRO -  Version MT5 A key element in trading is zones or levels from which decisions to buy or sell a trading instrument are made. Despite attempts by major players to conceal their presence in the market, they inevitably leave traces. Our task was to learn how to identify these traces and interpret them correctly. Main functions: Displaying active zones
Atomic Analyst
Issam Kassas
5 (3)
Zunächst einmal ist es erwähnenswert, dass dieser Handelsindikator nicht neu malt, nicht neu zeichnet und keine Verzögerung aufweist, was ihn sowohl für manuellen als auch für Roboterhandel ideal macht. Benutzerhandbuch: Einstellungen, Eingaben und Strategie. Der Atom-Analyst ist ein PA-Preisaktionsindikator, der die Stärke und das Momentum des Preises nutzt, um einen besseren Vorteil auf dem Markt zu finden. Ausgestattet mit fortschrittlichen Filtern, die helfen, Rauschen und falsche Signale z
Advanced Supply Demand
Bernhard Schweigert
4.92 (312)
Derzeit 33% Rabatt! Die beste Lösung für jeden Anfänger oder erfahrenen Händler! Dieser Indikator ist ein einzigartiges, qualitativ hochwertiges und erschwingliches Trading-Tool, da wir eine Reihe von proprietären Funktionen und eine neue Formel integriert haben. Mit diesem Update werden Sie in der Lage sein, doppelte Zeitrahmenzonen anzuzeigen. Sie können nicht nur einen höheren TF (Zeitrahmen) anzeigen, sondern sowohl den Chart-TF als auch den höheren TF: SHOWING NESTED ZONES. Alle Supply Dema
Derzeit 20% Rabatt! Die beste Lösung für jeden Neueinsteiger oder Expert Händler! Dieses Dashboard arbeitet mit 28 Währungspaaren. Es basiert auf 2 unserer Hauptindikatoren (Advanced Currency Strength 28 und Advanced Currency Impulse). Es bietet einen hervorragenden Überblick über den gesamten Forex-Markt. Es zeigt die Werte der Advanced Currency Strength, die Veränderungsrate der Währungen und die Signale für 28 Devisenpaare in allen (9) Zeitrahmen. Stellen Sie sich vor, wie sich Ihr Hande
TPSproTREND PrO
Roman Podpora
4.78 (18)
TPSpro TRENDPRO  - is a trend indicator that automatically analyzes the market and provides information about the trend and each of its changes, as well as giving signals for entering trades without redrawing! The indicator uses each candle, analyzing them separately. referring to different impulses - up or down impulse. Exact entry points into transactions for currencies, crypto, metals, stocks, indices!  -  Version MT5               DETAILED DESCRIPTION                R ecommended to use with
Legacy of Gann
Pavel Zamoshnikov
4.83 (12)
The indicator very accurately determines the levels of the possible end of the trend and profit fixing. The method of determining levels is based on the ideas of W.D.Gann, using an algorithm developed by his follower Kirill Borovsky. Extremely high reliability of reaching levels (according to K. Borovsky  - 80-90%) Indispensable for any trading strategy – every trader needs to determine the exit point from the market! Precisely determines targets on any timeframes and any instruments (forex, met
FX Power MT4 NG
Daniel Stein
5 (10)
Erhalten Sie Ihr tägliches Marktupdate mit Details und Screenshots über unser Morning Briefing hier auf mql5 und auf Telegram ! FX Power MT4 NG ist die nächste Generation unseres langjährig sehr beliebten Währungsstärkemessers FX Power. Und was bietet dieser Stärkezähler der nächsten Generation? Alles, was Sie am ursprünglichen FX Power geliebt haben PLUS GOLD/XAU-Stärkeanalyse Noch präzisere Berechnungsergebnisse Individuell konfigurierbare Analysezeiträume Anpassbares Berechnungslimit für noc
FX Volume
Daniel Stein
4.6 (35)
Erhalten Sie Ihr tägliches Marktupdate mit Details und Screenshots über unser Morning Briefing hier auf mql5 und auf Telegram ! FX Volume ist der ERSTE und EINZIGE Volumenindikator, der einen ECHTEN Einblick in die Marktstimmung aus Sicht eines Brokers bietet. Es bietet fantastische Einblicke in die Positionierung von institutionellen Marktteilnehmern, wie z.B. Brokern, auf dem Forex-Markt, viel schneller als COT-Berichte. Diese Informationen direkt auf Ihrem Chart zu sehen, ist der wahre Game
Auto Order Block with break of structure based on ICT and Smart Money Concepts (SMC) Futures Break of Structure ( BoS )             Order block ( OB )            Higher time frame Order block / Point of Interest ( POI )    shown on current chart           Fair value Gap ( FVG ) / Imbalance   -  MTF      ( Multi Time Frame )    HH/LL/HL/LH  -  MTF      ( Multi Time Frame )  Choch  MTF      ( Multi Time Frame )  Volume Imbalance     ,  MTF          vIMB Gap’s Power of 3 Equal High
Zunächst einmal ist es wichtig zu betonen, dass dieses Handelstool ein Nicht-Repaint-, Nicht-Redraw- und Nicht-Verzögerungsindikator ist, was es ideal für professionelles Trading macht. Online-Kurs, Benutzerhandbuch und Demo. Der Smart Price Action Concepts Indikator ist ein sehr leistungsstarkes Werkzeug sowohl für neue als auch erfahrene Händler. Er vereint mehr als 20 nützliche Indikatoren in einem und kombiniert fortgeschrittene Handelsideen wie die Analyse des Inner Circle Traders und Stra
ICT, SMC, SMART MONEY CONCEPTS, SMART MONEY, Smart Money Concept, Support and Resistance, Trend Analysis, Price Action, Market Structure, Order Blocks, BOS/CHoCH,   Breaker Blocks ,  Momentum Shift,   Supply&Demand Zone/Order Blocks , Strong Imbalance, HH/LL/HL/LH,    Fair Value Gap, FVG,  Premium  &   Discount   Zones, Fibonacci Retracement, OTE, Buy Side Liquidity, Sell Side Liquidity, BSL/SSL Taken, Equal Highs & Lows, MTF Dashboard, Multiple Time Frame, BigBar, HTF OB, HTF Market Structure, 
Entdecken Sie das Geheimnis des erfolgreichen Forex -Handels mit unserem benutzerdefinierten MT4 -Indikator! Haben Sie sich jemals gefragt, wie Sie Erfolg auf dem Forex -Markt erzielen können und gleichzeitig Gewinne erzielen und gleichzeitig das Risiko minimieren können? Hier ist die Antwort, nach der Sie gesucht haben! Erlauben Sie uns, unseren proprietären MT4 -Indikator vorzustellen, der Ihren Handelsansatz revolutionieren wird. Einzigartige Vielseitigkeit Unser Indikator ist speziell
Volatility Trend System – ein Handelssystem, das Signale für Einstiege gibt. Das Volatilitätssystem liefert lineare und punktuelle Signale in Richtung des Trends sowie Signale zum Verlassen des Trends, ohne Neuzeichnung und Verzögerungen. Der Trendindikator überwacht die Richtung des mittelfristigen Trends, zeigt die Richtung und deren Änderung an. Der Signalindikator basiert auf Änderungen der Volatilität und zeigt Markteintritte an. Der Indikator ist mit mehreren Arten von Warnungen ausgest
TakePropips Donchian Trend Pro
Eric John Pajarillaga Aldana
4.82 (17)
TakePropips Donchian Trend Pro   (MT4) ist ein leistungsstarkes und effektives Tool, das mithilfe des Donchian-Kanals automatisch die Richtung des Trends erkennt und Ihnen Handelssignale für den Ein- und Ausstieg liefert! Dieser Multifunktionsindikator umfasst einen Trendscanner, Handelssignale, ein statistisches Panel, einen Screener, Handelssitzungen und ein Dashboard für den Verlauf von Warnungen. Es wurde entwickelt, um Ihnen Handelssignale zu liefern und Ihnen Stunden beim Analysieren der C
Currency Strength Wizard ist ein sehr leistungsstarker Indikator, der Ihnen eine Komplettlösung für erfolgreichen Handel bietet. Der Indikator berechnet die Stärke dieses oder jenes Forex-Paares anhand der Daten aller Währungen in mehreren Zeitrahmen. Diese Daten werden in Form von benutzerfreundlichen Währungsindizes und Währungsstärkelinien dargestellt, anhand derer Sie die Stärke dieser oder jener Währung erkennen können. Sie müssen lediglich den Indikator an das Diagramm anhängen, mit dem Si
Break and Retest
Mohamed Hassan
4.43 (14)
New update to V.4 where  Break & Retest automatically draws the take profit & stop loss levels and you also have more signals per day! ‍You can visually backtest Break & Retest to see how it behaved in the past!     Manual guide:   Click here $60 for a very limited time. Next price is $120   This Indicator only places quality trades when the market is really in your favor with a clear break and retest. Patience is key with this price action strategy! If you want more alert s
M1 Arrow
Oleg Rodin
5 (14)
Eine Intraday-Strategie, die auf zwei Grundprinzipien des Marktes basiert. Der Algorithmus basiert auf der Analyse von Volumina und Preiswellen mit zusätzlichen Filtern. Der intelligente Algorithmus des Indikators gibt nur dann ein Signal, wenn sich zwei Marktfaktoren zu einem vereinen. Der Indikator berechnet Wellen eines bestimmten Bereichs auf dem M1-Diagramm unter Verwendung der Daten des höheren Zeitrahmens. Und um die Welle zu bestätigen, verwendet der Indikator eine Volumenanalyse. Dieser
NAM Order Blocks
NAM TECH GROUP, CORP.
5 (1)
MT4-Erkennungsanzeige für Auftragsblöcke mit mehreren Zeitrahmen. Eigenschaften - Vollständig anpassbar auf dem Diagrammbedienfeld, bietet vollständige Interaktion. - Verstecken und zeigen Sie das Bedienfeld, wo immer Sie möchten. - Erkennen Sie OBs in mehreren Zeiträumen. - Wählen Sie die anzuzeigende OB-Menge aus. - Verschiedene OBs Benutzeroberfläche. - Verschiedene Filter an OBs. - OB-Näherungsalarm. - ADR High- und Low-Leitungen. - Benachrichtigungsdienst (Bildschirmwar
DERZEIT 31% RABATT! Die beste Lösung für jeden Newbie oder Expert Trader! Dieser Indikator ist ein einzigartiges, qualitativ hochwertiges und erschwingliches Handelsinstrument, da wir eine Reihe von proprietären Funktionen und eine geheime Formel eingebaut haben. Mit nur EINEM Chart liefert er Alerts für alle 28 Währungspaare. Stellen Sie sich vor, wie sich Ihr Handel verbessern wird, weil Sie in der Lage sind, den genauen Auslösepunkt eines neuen Trends oder einer Scalping-Gelegenheit zu e
Entry Points Pro
Yury Orlov
4.7 (226)
Dies ist ein Indikator für MT4, der genaue Signale für den Einstieg in einen Handel ohne Repainting (Neuzeichnen) liefert. Er kann auf alle Finanzwerte angewendet werden: Forex, Kryptowährungen, Metalle, Aktien, Indizes. Er liefert ziemlich genaue Schätzungen und sagt Ihnen, wann es am besten ist, eine Position zu eröffnen und zu schließen. Sehen Sie sich das Video (6:22) mit einem Beispiel für die Verarbeitung nur eines Signals an, das sich für den Indikator gelohnt hat! Die meisten Händler ver
BullsEye Signal NoRepaint
Martin Alejandro Bamonte
BullseyeSignal – NoRepaint ist ein Signal, das, wie der Name schon sagt, unter keinen Umständen neu gezeichnet wird. Das Signal wird auf der gleichen Kerze ausgegeben, die im Bild zu sehen ist. Es ist ideal für stark volatile Märkte wie Forex, Kryptowährungen, Aktien, Indizes und Futures. Sie werden nur einen grünen Pfeil für den Kauf und einen roten Pfeil für den Verkauf sehen, aber hinter ihnen arbeiten viele Indikatoren zusammen, um ein vereinfachtes Handelserlebnis zu bieten. Es ist speziell
PRO Renko System ist ein hochpräzises Handelssystem, das speziell für den Handel mit RENKO-Charts entwickelt wurde. Dies ist ein universelles System, das auf verschiedene Handelsinstrumente angewendet werden kann. Das System neutralisiert effektiv so genannte Marktgeräusche, die Ihnen Zugang zu genauen Umkehrsignalen geben. Der Indikator ist sehr einfach zu bedienen und hat nur einen Parameter, der für die Signalerzeugung verantwortlich ist. Sie können das Tool einfach an jedes Handelsinstr
TrendMaestro
Stefano Frisetti
5 (3)
note: this indicator is for METATRADER4, if you want the version for METATRADER5 this is the link:  https://www.mql5.com/it/market/product/108106 TRENDMAESTRO ver 2.4 TRENDMAESTRO recognizes a new TREND in the bud, he never makes mistakes. The certainty of identifying a new TREND is priceless. DESCRIPTION TRENDMAESTRO identifies a new TREND in the bud, this indicator examines the volatility, volumes and momentum to identify the moment in which there is an explosion of one or more of these data a
Scalper Vault
Oleg Rodin
5 (29)
Scalper Vault ist ein professionelles Scalping-System, das Ihnen alles bietet, was Sie für erfolgreiches Scalping benötigen. Dieser Indikator ist ein komplettes Handelssystem, das von Forex- und Binäroptionshändlern verwendet werden kann. Der empfohlene Zeitrahmen ist M5. Das System liefert Ihnen genaue Pfeilsignale in Richtung des Trends. Es liefert Ihnen auch Top- und Bottom-Signale und Gann-Marktniveaus. Die Indikatoren bieten alle Arten von Warnungen, einschließlich PUSH-Benachrichtigungen.
Dieses Dashboard zeigt die neuesten verfügbaren harmonischen Muster für die ausgewählten Symbole, so dass Sie Zeit sparen und effizienter sein werden / MT5-Version . Kostenloser Indikator: Basic Harmonic Pattern Spalten des Indikators Symbol: die ausgewählten Symbole werden angezeigt Trend: bullish oder bearish Pattern : Art des Musters (Gartley, Schmetterling, Fledermaus, Krabbe, Hai, Cypher oder ABCD) Entry : Einstiegskurs SL: Stop-Loss-Kurs TP1: 1. Take-Profit-Kurs TP2: 2. Gewinnmitnah
Volume by Price MT4
Brian Collard
4.71 (14)
The Volume by Price Indicator for MetaTrader 4 features Volume Profile and Market Profile TPO (Time Price Opportunity). Volume and TPO histogram bar and line charts. Volume Footprint charts. TPO letter and block marker collapsed and split structure charts. Session filtering and grouping. Static, dynamic and flexible range segmentation and compositing methods with relative and absolute visualizations. Graphical layering, positioning and styling options to suit the user's analytic and aesthetic n
Weitere Produkte dieses Autors
Trend Code
Ning Liu
4 (1)
Trend Code (v2.0) Trend Code is a very simple and yet effective trend indicator to capture trend movement, detect the trend reversal, calculate entry price as well as proper stop loss. Trend Code indicator is made up of a series of block, while bull trend block in bull colour and bear block in bear trend colour. For bull trend block, the TrendOpen is the lower edge, TrendClose is the upper edge, for bear trend block, the other way round. Parameters: TrendOpenAdjustment   = 0.8, (range 0~1.0) Tr
Real Time Currency Strength We present a simple and effective indicator of currency strength, which give you the overview of the market situation. The indicator displays strength of eight major currencies and can be viewed in a single indicator window. Main features This is a real-time currency strength based on a pool of eight most liquidate major currencies. That means, for every moment of time, the strength of the currency is related to the pool of eight currency as whole at that moment. Ther
Hidden Breakout Power   The market has a cycle, keeps on moving from: RANGE -> BREAKOUT -> TREND ->CONSOLIDATION ->RANGE RANGE and TREND The two major states, while the BREAKOUT refer to the short period of market breaking the range, CONSOLIDATION refer to the long consolidation of market and shrink to range. Usually oscillatory indicator performs well in RANGE states and perform poorly in trend state, while TREND indicator is the other way around, it performs will in a TREND states and but poor
Realtime Stop Hunting Background What Is Stop Hunting? I refer to the definition of Stop Hunting from Investopedia, Stop hunting is a strategy that attempts to force some market participants out of their positions by driving the price of an asset to a level where many individuals have chosen to set stop-loss orders. The triggering of many stop losses at once typically creates high volatility and can present a unique opportunity for investors who seek to trade in this environment. Setting up the
Auswahl:
Keine Bewertungen
Antwort auf eine Rezension
Version 2.0 2021.01.05
Version 2.0
Adding two commonly used EMA period of 12 and 24
Version 1.1 2020.11.30
Amend small bug to show statistic.