Currency Meter with Date and Time
- Indikatoren
- Rajiv Ishwar
- Version: 1.3
- Aktivierungen: 5
PLEASE NOTE THAT LIKE MANY SUCH INDICATORS ON THIS MARKET, THIS INDICATOR WILL NOT WORK AS A DEMO DOWNLOAD FOR STRATEGY TESTER.
Therefore the 1 month option at the lowest cost allowed of $10 is available for you to test.
One of the better ways to trade is to analyse individual currencies rather than currency pairs. This is impossible with standard chart indicators on MT4.
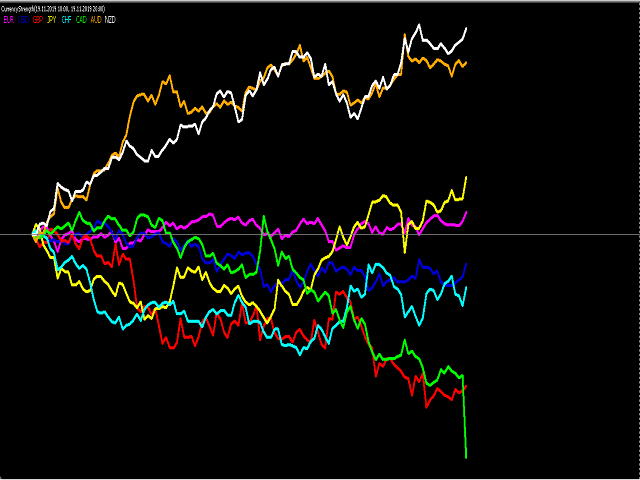
This currency strength meter allows one to trade the strongest with the weakest currency. The meter includes the currencies that make up approximately 80% of the value of the Forex market. These are AUD, CAD, CHF, JPY, GBP, EUR, NZD and USD. Each currency is measured constantly against the other seven to determine the gain on each pair. Those numbers are then shown cumulatively for each currency on the chart.
The lookback period can be set using the date and time settings. If you remove the date and leave just the time setting, it defaults to the current day. Therefore you may use it to measure volatility from the start of your trading session. It works well with the London and New York sessions. You many change the timeframe on your chart and the meter will adapt to that timeframe. Matching a strong currency getting stronger and a weak currency getting weaker helps one stay out of false moves. Also if you trade a particular pair, you may use this meter to time your entries more accurately.
I recommend using a 1 minute and 5 minute chart for this meter. Also it is better to place the indicator on a new chart and expand it to fill almost the entire screen, rather than use it at the bottom of a trading chart.
You may remove a currency line from the chart by setting that currency to "False" but it will remain in the calculation, and the scale will adapt to show only the currencies set as "True". This function may be used when one currency moves much more than the others, and skews the other 6 lines. This was seen often when Brexit announcements caused massive spikes on the GBP. The other lines then bunched up making it difficult to read for example, EURUSD.
Set the zero line colour under "LEVELS"