Trend Lines Signal
- Indikatoren
- Mohamed yehia Osman
- Version: 1.2
- Aktivierungen: 5
This Indicator provides Buy/Sell Signal based on calculations on Higher frame (Trend) and Lower frame(Entry signals)
* You should select the higher and lower frame for indicator calculations
* You select the Trend line colors as you prefer
* Enable or disable Alerts!
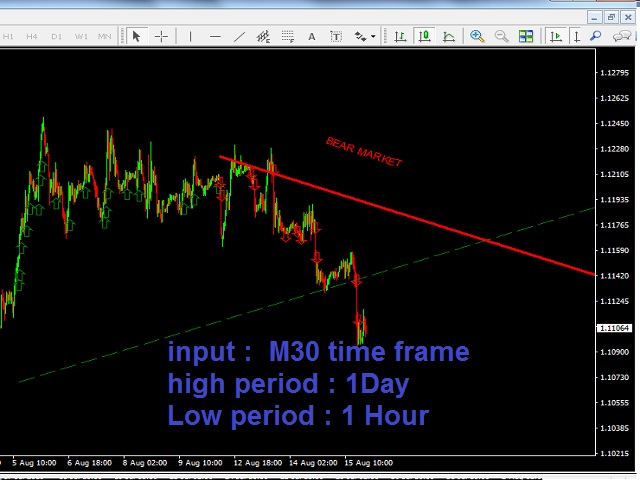
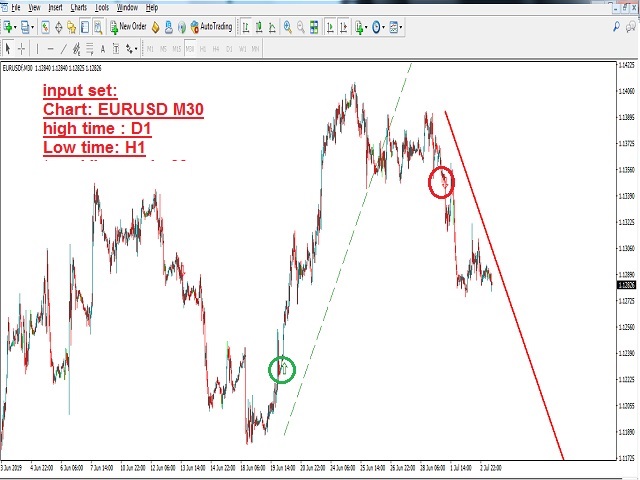
Trend lines UP/Down are drawn when a trend is detected
Wait for small arrows for entry :
*Normally an UP arrow in an UP Trend is a BUY signal :
---you Close the BUY position IF a Reverse DOWN Trend signal appears Or when Up trend line crossed down
*Normally a DOWN arrow in a DOWN Trend is a SELL signal :
---you Close the SELL position IF a Reverse UP Trend signal appear Or when DOWN trend line crossed up
my proposed input parameters :
M30 Chart ::::: High time frame : D1 Low time frame : H1
M1 Chart ::::: High time frame : H1 Low time frame : M5