ATR Sessions Pips
- Indikatoren
- Alexander Shienkov
- Version: 5.3
- Aktualisiert: 3 April 2024
- Aktivierungen: 10
Ещё один простой информационный индикатор, показывающий самые важные торговые сессии валютного рынка.
О понятии торговых сессий.
Всем известно, что торговая сессия – это промежуток времени, в течение которого банки и другие
участники рынка ведут активную торговлю, при этом активизируются в определённые часы рабочего дня.
Валютный рынок, рынки акций и сырьевые рынки работают круглосуточно с понедельника по пятницу, кроме праздничных дней.
Когда в одной стране ещё спят, в другой рабочий день уже в разгаре,а где-то он только начинается или уже подходит к концу.
В торговом терминале MetaTrader 4 стандартные временные метки отображаются только по началу нового дня.
Данные периоды разделены вертикальными пунктирными линиями, включить и отключить которые можно простым нажатием сочетания клавиш "Ctrl + Y".
Работа индикатора.
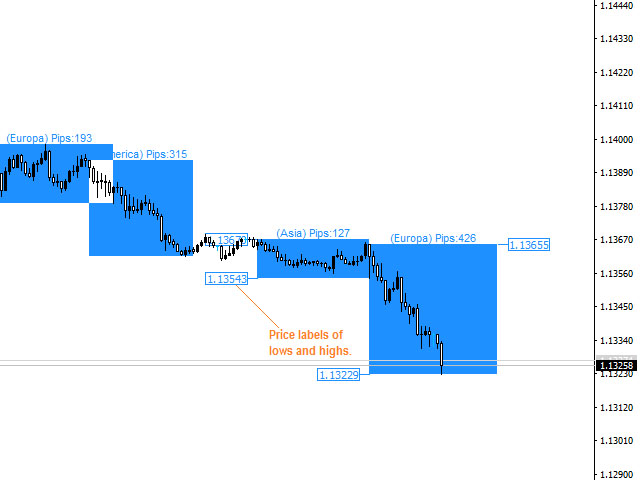
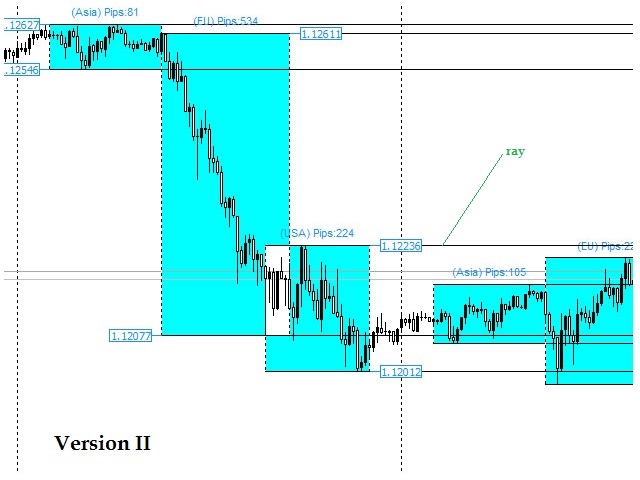
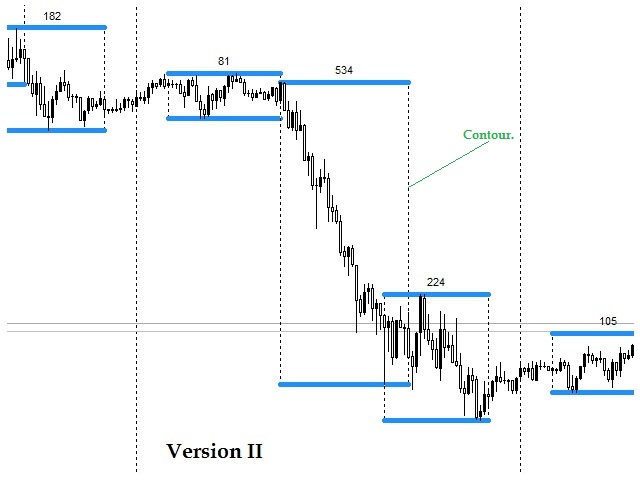
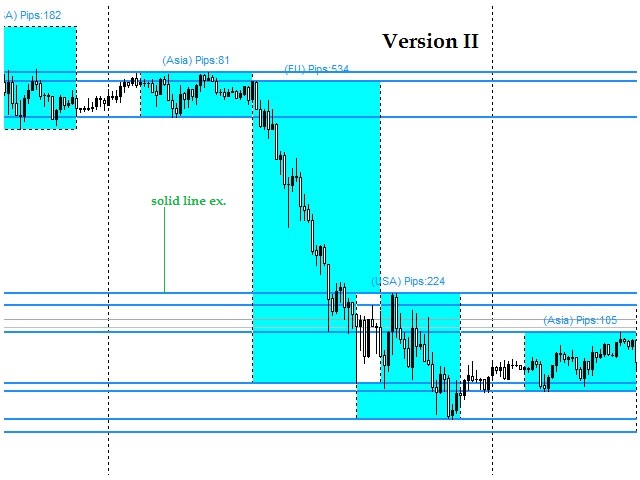
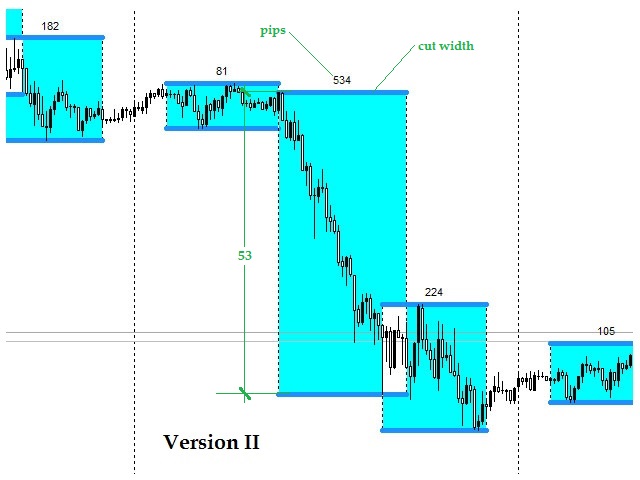
Данный индикатор наглядно на графике показывает начало, конец, максимумы и минимумы торговый сессий.
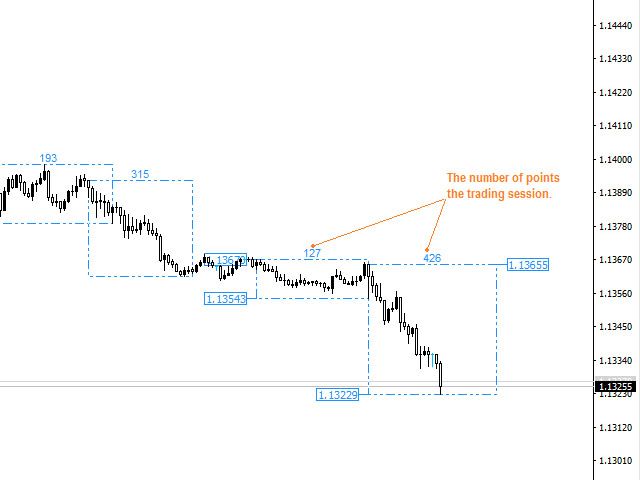
А также количество пройденных ценой пунктов (АТР), прошедших сессий и сессии которая активна сейчас.
При добавлении его на график размещает графические объекты относящиеся к торговым сессиям.
Цвет, размеры текста, ценовых меток и стили всех графических объектов, а также задавать время торговых сессии индикатора,
можно менять во входных параметрах.
Индикатор очень упрощает понимание графика и движения цен за прошлый и текущий период времени.
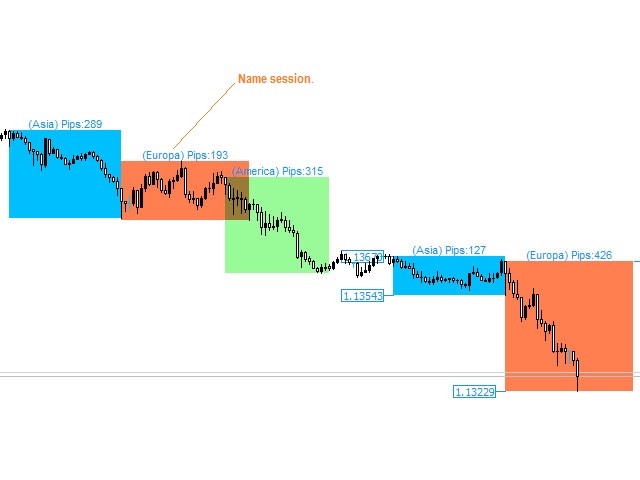
Основными торговыми сессиями принято считать:
- Азиатская (Asia)
- Европейская (Europe)
- Американская (America)
Примечание 1: Есть ещё Австралийская (тихоокеанская) (Pacific) торговая сессия,
но она менее валатильна и коротко временна. В Индикаторе она не отображается.
Примечание 2: Каждая из торговых сессий, в мире, отличается от остальных не только временем работы,
но и некоторыми специфическими особенностями торговли.
Параметры индикатора
- Show price tags high and low sessions current day – Показывать ценовые метки торговых сессий текущего дня, по умолчанию: True.
- Color Price Tags trading sessions – Цвет ценовых меток, по умолчанию: DodgerBlue.
- Size Price Tags trading sessions – Размер ценовых меток, по умолчанию: 1.
- Show the name and ATR sessions - Показывать название торговых сессий и АТР (количество пунктов между минимумом и максиму за торговую сессию), по умолчанию: true.
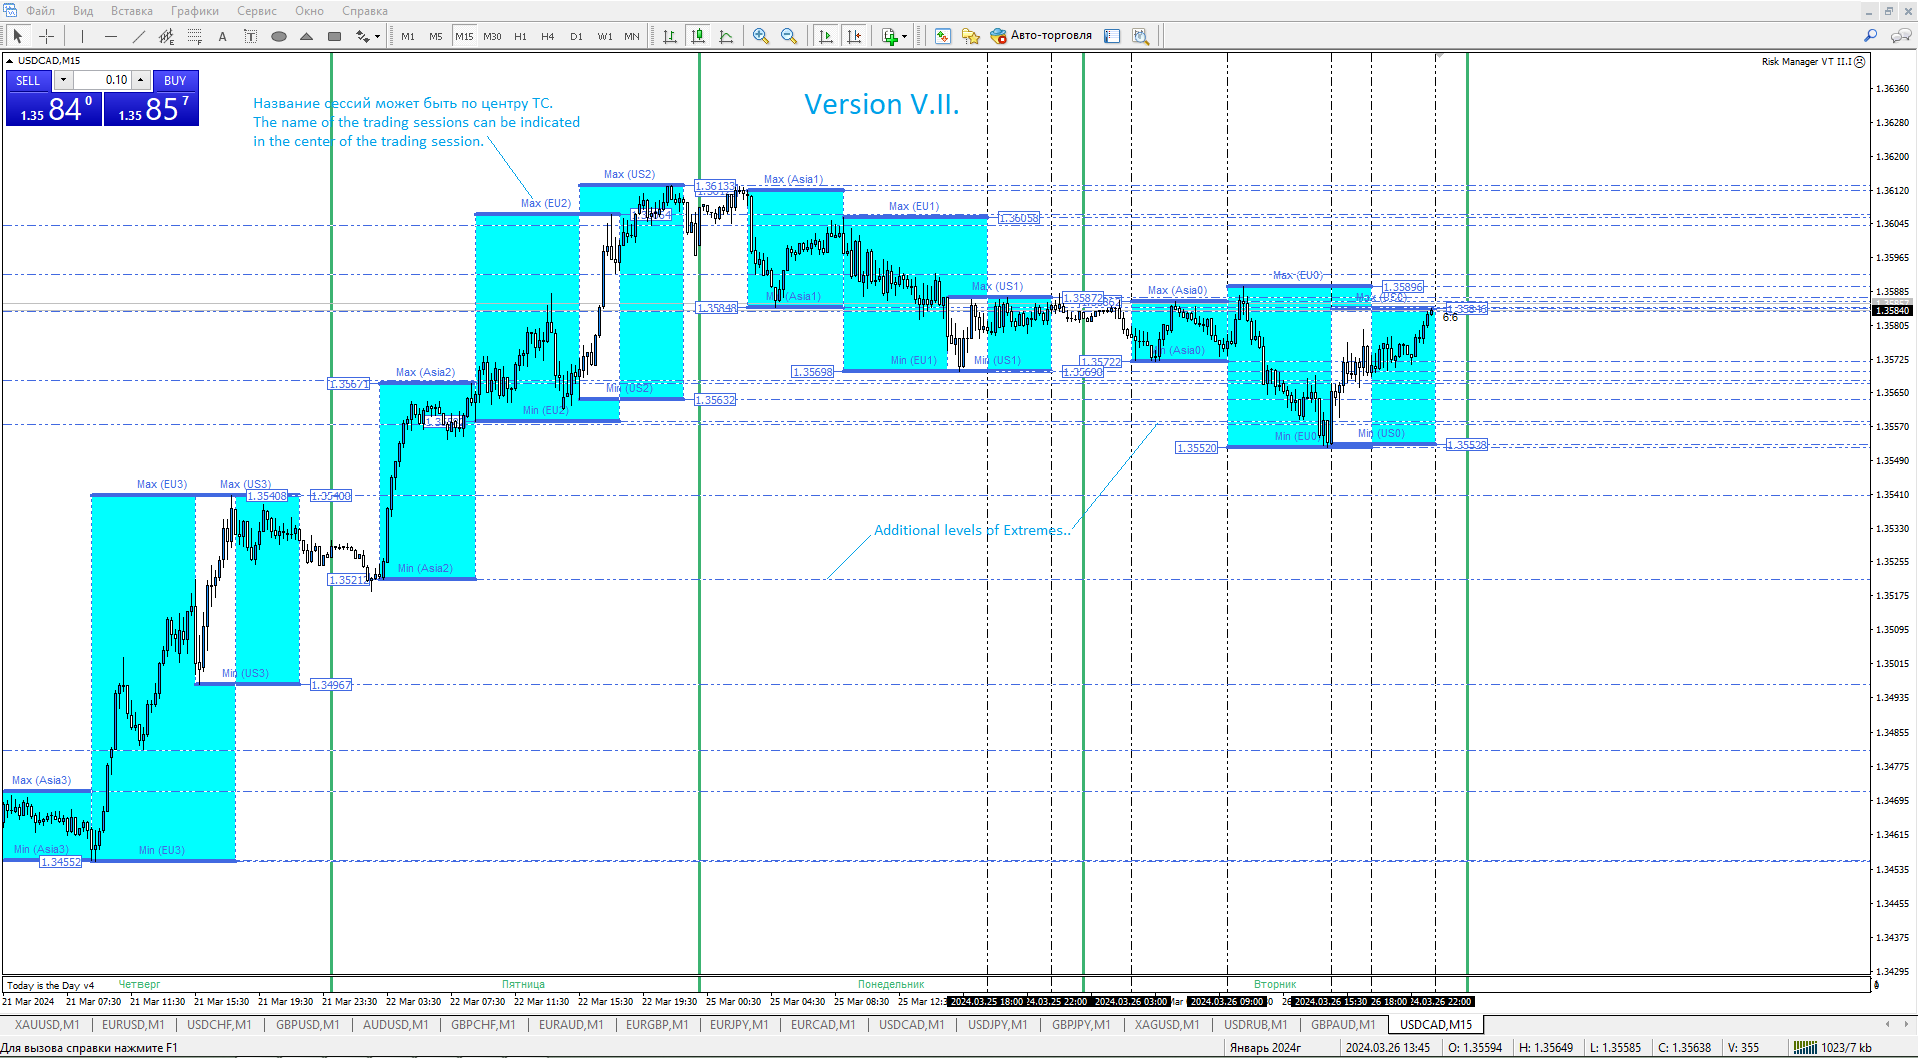
- On / Off the name of the sessions – Включить \Выключить только название ТС, по умолчанию: false.
- The color of the names of the session and ATR - Цвет текста АТР и пройденных пунктов, по умолчанию: DodgerBlue.
- The font size of the names of the session and ATR - Размер текста, по умолчанию: 8.
- Indent font name of the session and ATR - Отступ текста от прямоугольника торговых сессий вверх, по умолчанию: 20.
- The Number of days trading sessions are displayed - Количество дней для отображения индикатором сессий, по умолчанию: 5. (если много линий уменьши до 2.)
- Opening hours of the Asian session - Время открытия Азиатской торговой сессии, по умолчанию: 02:00. (мск)
- Closing hours of the Asian session - Время закрытия Азиатской торговой сессии, по умолчанию: 09:00. (мск)
- The color rectangle of the Asian session - Цвет прямоугольника Азиатской торговой сессии, по умолчанию: DodgerBlue.
- Opening hours of the European session - Время открытия Европейской торговой сессии, по умолчанию: 09:00. (мск)
- Closing hours of the European session - Время закрытия Европейской торговой сессии, по умолчанию: 17:00. (мск)
- The color rectangle of the European session - Цвет прямоугольника Европейской торговой сессии, по умолчанию: DodgerBlue.
- Opening hours of the American session - Время открытия Американской торговой сессии, по умолчанию: 15:30. (мск)
- Closing hours of the American session - Время закрытия Американской торговой сессии, по умолчанию: 22:00. (мск)
- The color rectangle of the American session - Цвет прямоугольника Американской торговой сессии, по умолчанию: DodgerBlue.
Примечание: Индикатор подходит для работы при любом цвете фона графика и очень удобен для анализа движений цены во времени.
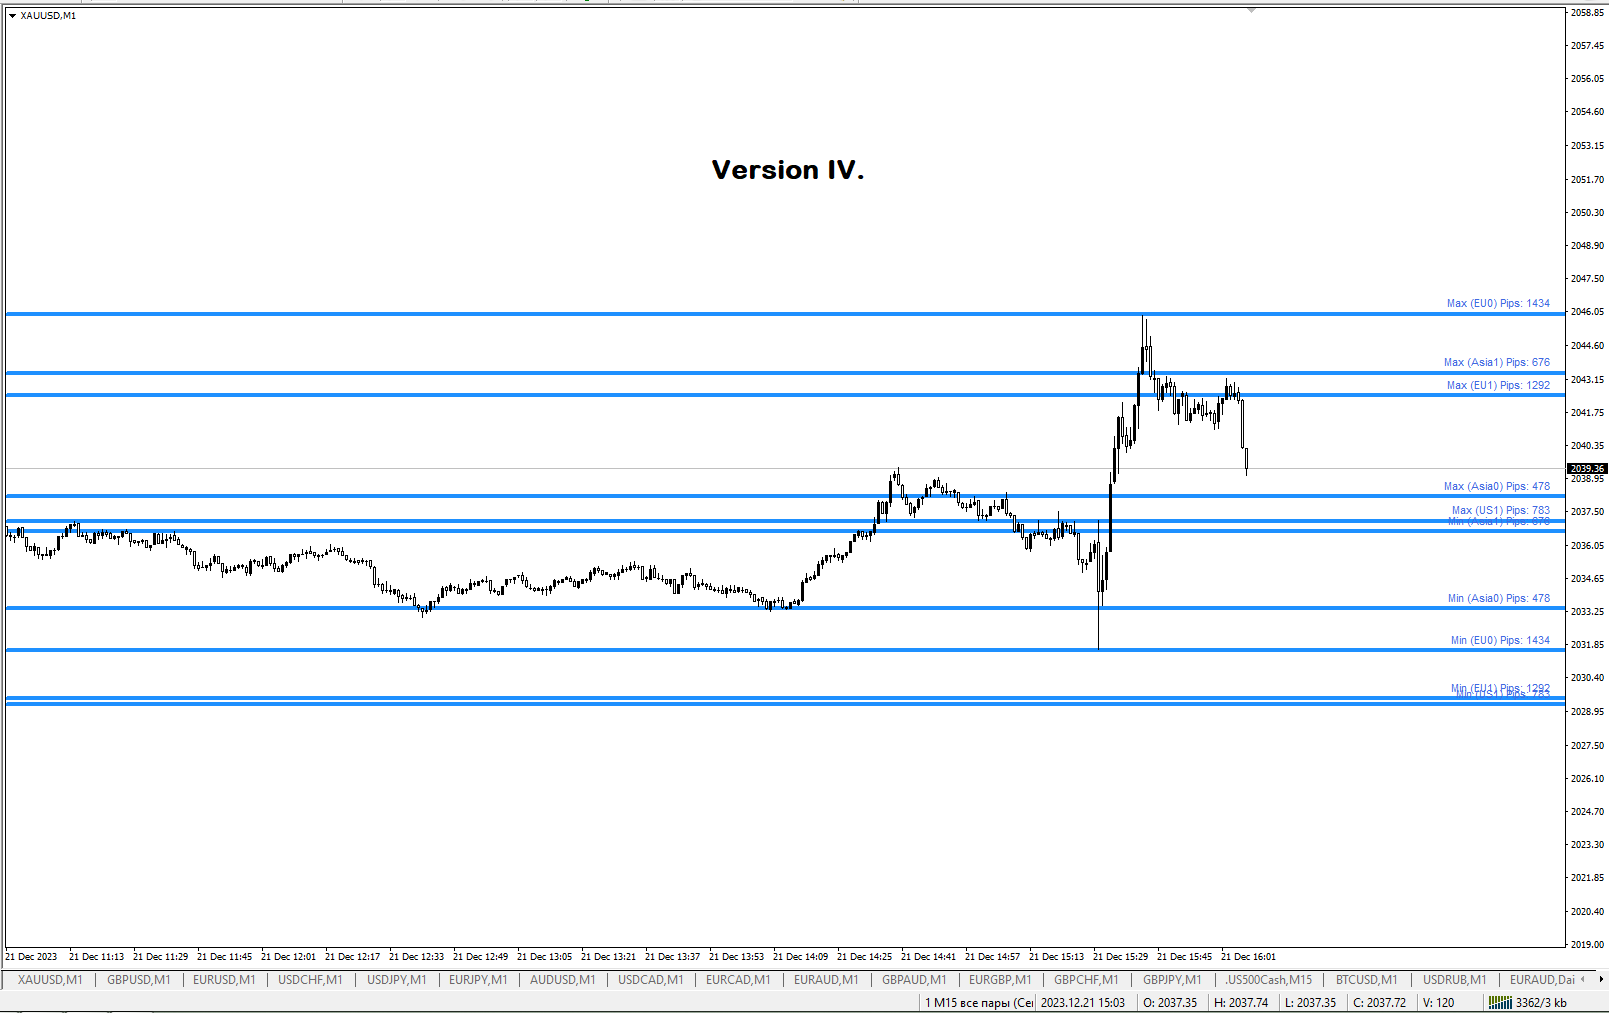
Примечание: В IV версии индикатора в названии торговых сессий добавлен текст Минимумы и Максимумы (max min).
К примеру: Min (Asia0) Pips: 478 - где 0 это сегодняшний день.. То есть минимум Азиатской сессии сегодняшнего дня.
Если 1, то день вчерашний.. Если 2, то день позавчерашний.. и .тд.
Важно: По умолчанию отображение количества дней, и торговых сессий в них может превышать ваше зрительное восприятие уровней. (можно сделать меньше).
Сдвиг текст очень удобен на таймфреймах не выше М15. Если индикатор не прорисовался дождись нового Тика т.е. обновления котировки.
Важные новые параметры индикатора:
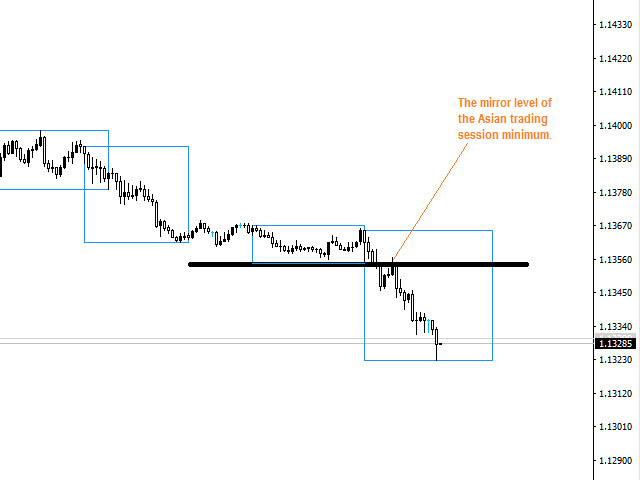
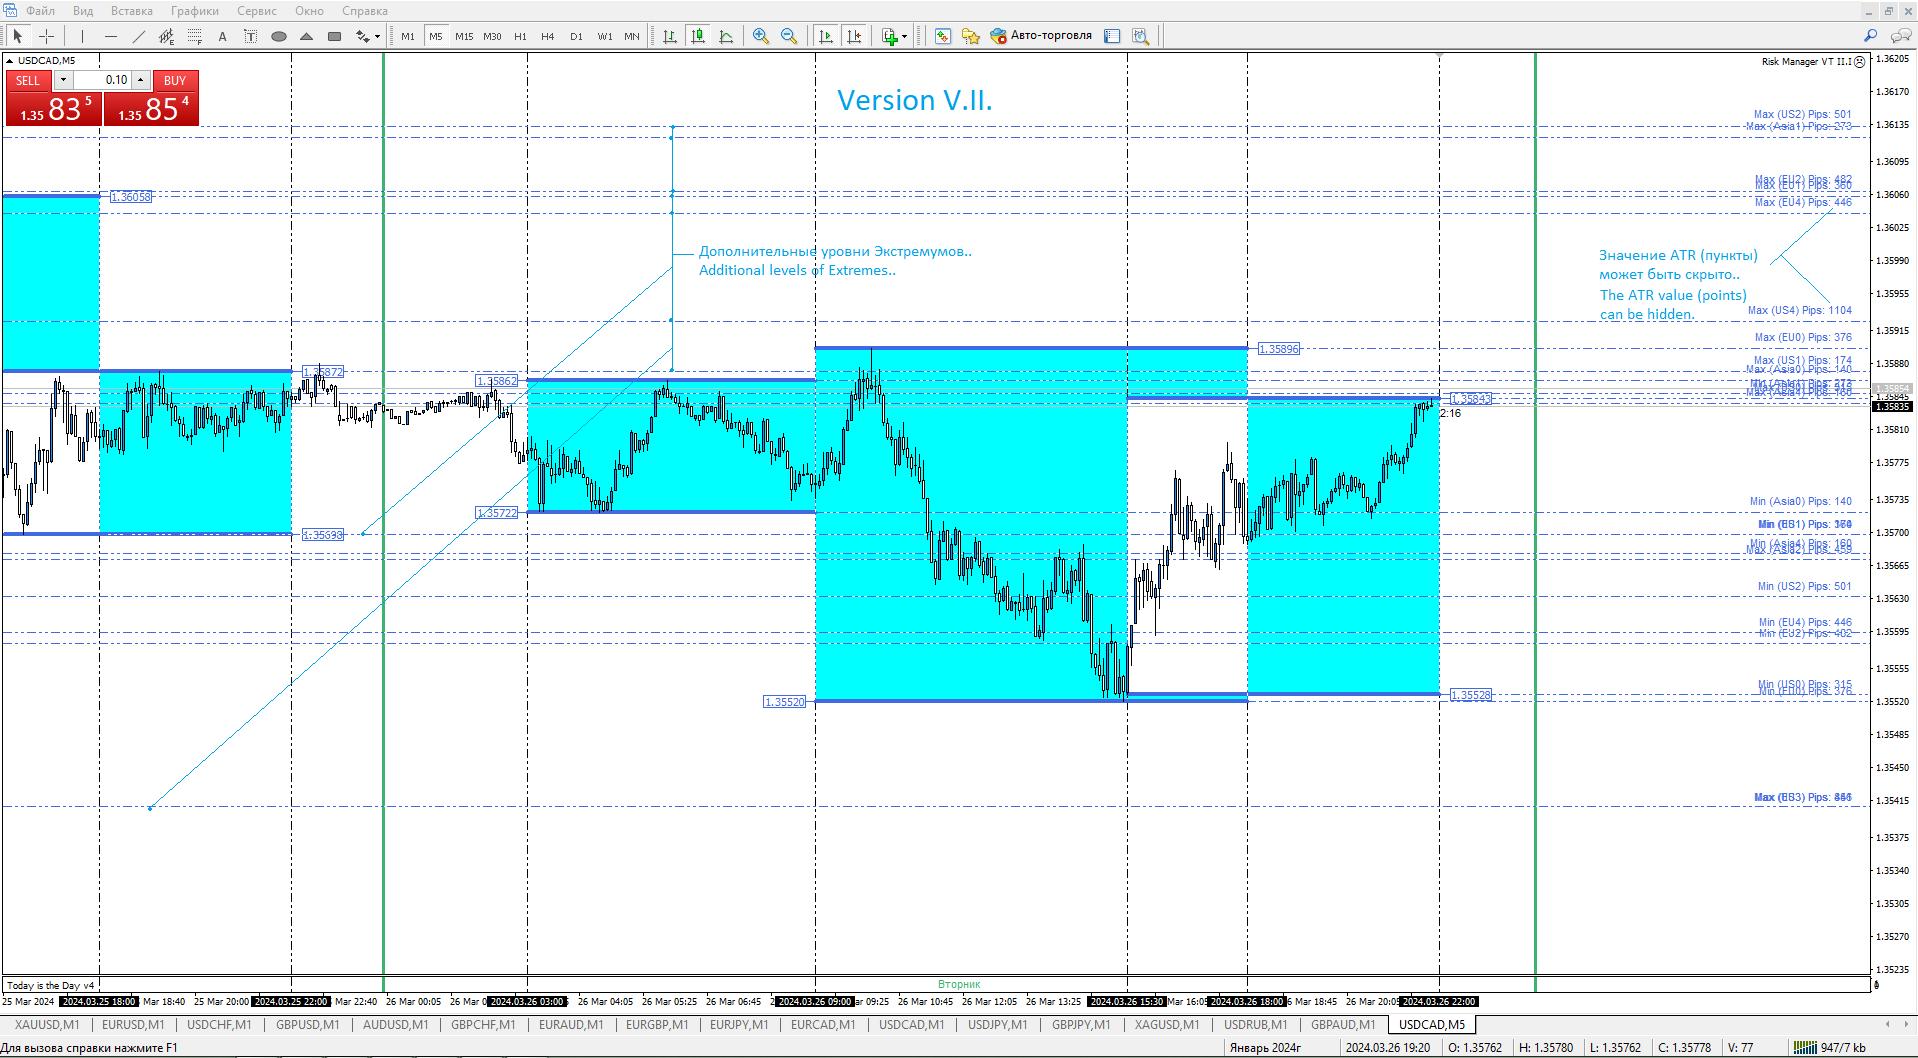
1. Добавлены дополнительные уровни экстремумов.
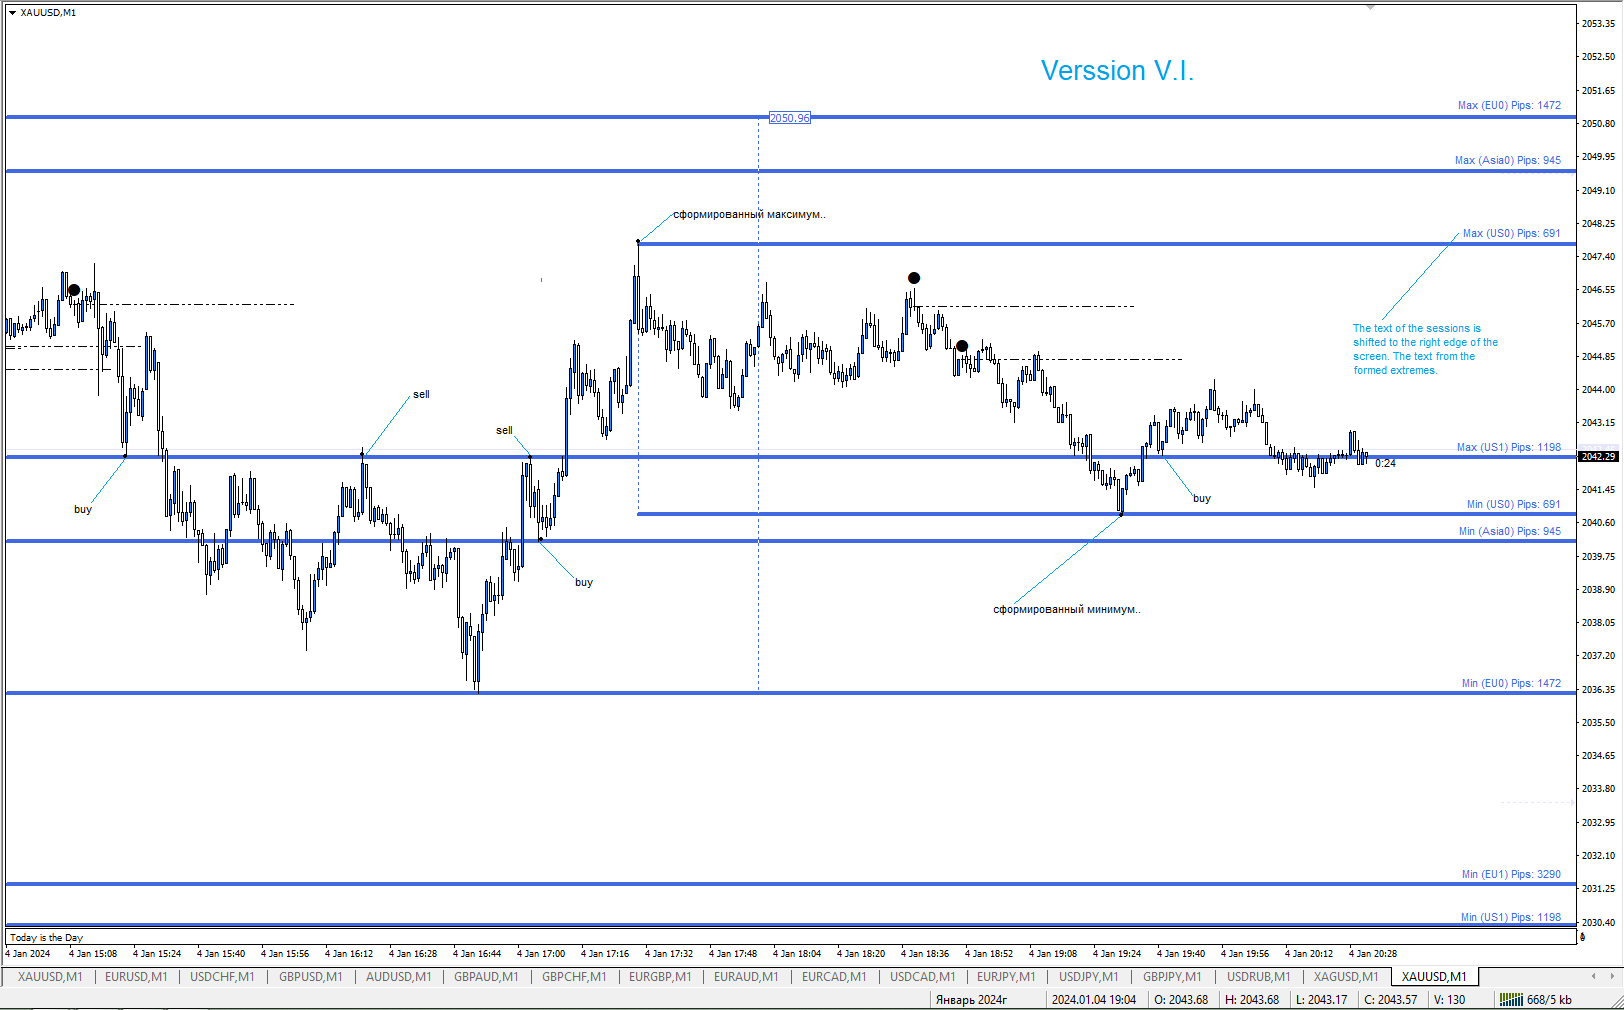
2. Название уровней и значение АТР можно сдвигать вправо.
3. Цифровое Значение АТР, в пунктах можно выключать.
4. Дополнительные уровни Экстремумов можно отключать.
5. Можно менять количество дней отображения сессий.
6. Можно включать и выключать заливку квадратов сессий.
При отображении текста индикатора, к примеру:
1. Max(EU0) - это максимум Европейской сессии "сегодня".
1.1. Min(EU0) - это минимум Европейской сессии "сегодня".
2. Max(EU1) - это максимум Европейской сессии "вчера".
2.1. Min(EU1) - это минимум Европейской сессии "вчера".
3. Max(EU2) - это максимум Европейской сессии "позавчера".
3.1. Min(EU2) - это минимум Европейской сессии "позавчера". и так далее.. 3,4,5.
Тоже самое и с другими торговыми сессиями. US1. US2. US3.. и так далее.., где
US1- это сессия вчерашнего дня. Сегодняшнего дня - это значение с цифрой 0.
Цифра 5 это сессия пятидневной давности. К примеру: Max(Asia5). Это максимум
Азиатской Торговой Сессии пять дней назад.