• Übersicht
  • Bewertungen (1)
  • Diskussion (1)

Strength Graph

5

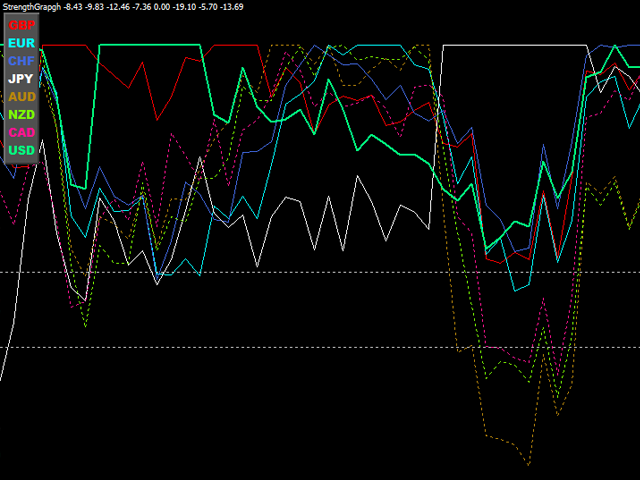
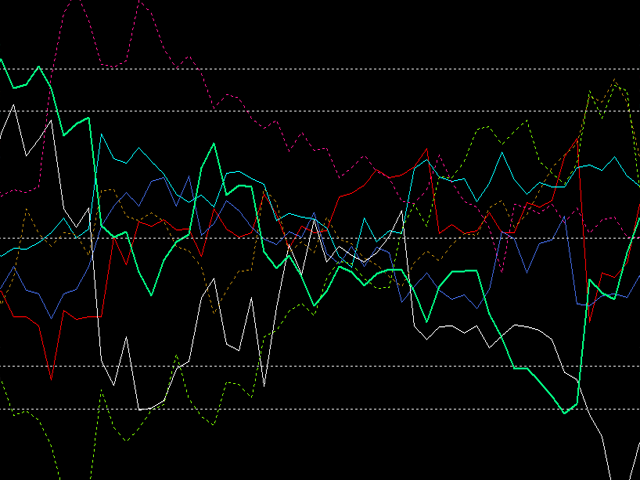
This indicator is a tool to measure the relative strength of different currency pairs. It present major currencies strength value base on their relative strength/weakness in custom period of time.


Indicator parameters

  • Strength Period - Change the strength period in the settings affects the number of bars used for calculation. The higher the period value, the smoother the indicator lines and the result will represent longer term strength of each currencies, rather than recent strength.
  • Display Options - Select the display options which affect how the data is visually displayed. (show strength/weakness/kebab).
    1. In mode "show strength", the stronger one currency gets, the higher its value. The weakest currency will be of value 0.
    2. In mode "show weakness", the weaker one currency gets, the lower its value. The strongest currency will be of value 0.
    3. In mode "show kebab", the stronger one currency gets, the higher its value. The average strength value will be 50.

It is useful when you are trying to trade not only major pairs but different cross pairs.

If this indicator is not working properly, it is likely that you have to switch between different timeframes and wait for it to refresh.

The indicator window displaying data value range can be customized it in the settings. You can change indicator line colors and styles for visual preference. To disable currency line, select "none" for its color.

Bewertungen 1
topline8000
1144
topline8000 2022.05.04 02:17 
 

for verification of winning rate

Empfohlene Produkte
This semaphore indicator is based in the standard RSI, which is applied over the Envelopes indicator that shows an envelope or envelope fluctuation borders. This is a version of RSI vs Envelopes drawn in the symbol window . A sell signal emerges when the upper envelope/border is broken by the RSI indicator from top to bottom. A buy signal emerges when the lower envelope/border is broken by the RSI indicator from bottom upwards. The indicator can draw arrows on the indicator, draw vertical lines
FREE
Necessary for traders: tools and indicators Waves automatically calculate indicators, channel trend trading Perfect trend-wave automatic calculation channel calculation , MT4 Perfect trend-wave automatic calculation channel calculation , MT5 Local Trading copying Easy And Fast Copy , MT4 Easy And Fast Copy , MT5 Local Trading copying For DEMO Easy And Fast Copy , MT4 DEMO Easy And Fast Copy , MT5 DEMO 砖图Renko PRO->>> The display of the brick map on the main map. The Renko chart ideally remo
FREE
Useful indicator that incorporates three moving averages, for your favorite trading strategy. Moving averages are fully configurable, Period, Method, Color, Etc Just place it on your favorite timeframe. The benefits you get : Never redesigns, does not retreat, never recalculates. Works on forex and CFD, timeframe from M1 to Monthly. Easy to use. Convenience for your trading. 
FREE
Useful indicator that incorporates two moving averages, for your favorite trading strategy. Moving averages are fully configurable, Period, Method, Color, Etc Just place it on your favorite timeframe. The benefits you get : Never redesigns, does not retreat, never recalculates. Works on forex and CFD, timeframe from M1 to Monthly. Easy to use. Convenience for your trading.
FREE
Donchian channels are a tool in technical analysis used to determine the relative volatility of a market and the potential for price breakouts. Can help identify potential breakouts and reversals in price, which are the moments when traders are called on to make strategic decisions. These strategies can help you capitalize on price trends while having pre-defined entry and exit points to secure gains or limit losses. Using the Donchian channel can thus be part of a disciplined approach to manag
FREE
RaysFX CCI e RSI
Davide Rappa
3 (2)
Il nostro Indicatore Combinato RaysFX CCI-RSI è uno strumento unico che combina due dei più popolari indicatori di analisi tecnica: l’Indice di Forza Relativa (RSI) e l’Indice del Canale delle Materie Prime (CCI). Caratteristiche : Combinazione di CCI e RSI : L’indicatore calcola la differenza tra i valori di CCI e RSI per ogni barra del grafico. Media Mobile Semplice (SMA) : L’indicatore calcola una SMA su queste differenze e traccia due linee sul grafico. Segnali di trading : Ogni volta che qu
FREE
Returns MT4
Fabrizio Malavasi
This indicator shows the value of returns in the selected time frame . They are calculated as logarithm of returns , rather than price or raw returns. For small returns, arithmetic and logarithmic returns will be similar. The benefit of using returns, versus prices, is normalization. It is possible measures all variables in a comparable metric despite originating from price series of unequal values. Inputs You can display data both as a Histogram  or a    Line It's also possible to display
FREE
Highly configurable Accumulation and Distribution (AD) indicator. Features: Alert functions.  Multi timeframe ability (lower and higher TF also).  Color customization.  Linear interpolation and histogram mode options.  Works on strategy tester in multi timeframe mode (at weekend without ticks also).  Adjustable Levels.  Parameters: Ad Timeframe:  You can set the lower/higher timeframes for Ad. Bar Shift for Lower Timeframe:   Shift left or right the lower timeframe's candle. Stepless (Linear I
FREE
ChannelRSI4
Iurii Tokman
5 (1)
ChannelRSI4   Der Relative Strength Index (RSI) Indikator mit dynamischen Niveaus von überkauften und überverkauften Zonen. Dynamische Niveaus ändern sich und passen sich den aktuellen Veränderungen des Indikators und der Preise an und stellen eine Art Kanal dar. Anzeigeeinstellungen period_RSI - Mittelungsperiode für die Berechnung des RSI-Index. angewandt_RSI - Der angewendete Preis. Es kann eine der Preiskonstanten sein: PRICE_CLOSE - Schlusskurs, PRICE_OPEN - Eröffnungspreis, PRICE_HIGH -
FREE
An improved version of the standard Standard Deviation indicator. It is now a responsive and smoothed line. The setup is not straightforward - but I hope you can do it. It is very easy to understand the readings of this indicator, the meaning is the same as that of the usual Standard Deviation. //////////////////////////////////////////////// /////////////////////////////////// I hope this indicator will be very useful to you in successful trading. Good luck.
FREE
A ratio between 0 and 1 with the higher values representing a more efficient or trending market,  It is used in the calculation of Perry J. Kaufman Adaptive Moving Average (KAMA), dividing the price change over a period by the absolute sum of the price movements that occurred to achieve that change. The Fractal Efficiency or also known as Efficiency Ratio was first published by Perry J. Kaufman in his book ‘Smarter Trading‘. This is mostly considered a filter for volatile markets none the less
FREE
Wave Reversal Indicator - determines the direction of trend waves and price reversals. The indicator shows wave movements and trend directions. It gives recommendations where to follow the trader, helps to follow the trading strategy. It is an addition to an intraday or medium-term strategy. Almost all parameters are selected for each time frame and are changed automatically, the only parameter for manual adjustment is the wavelength. Works on various trading instruments and timeframes, rec
FREE
The product   Divergence Cci Force Stddev Ac Atr   is designed to find the differences between indicators and price. It allows you to open orders or set trends using these differences. The indicator has 4 different divergence features. Divergence types Class A Divergence Class B Divergence Class C Divergence Hidden Divergence Product Features and Rec ommendations There are 5 indicators on the indicator Indicators =   CCI, Force, Stdandard Deviation, Acelereator, Atr 4 different divergence ty
FREE
Gravity Force
Salman A A A T Bakhash
Description: This indicator measures how far the price is away from Moving Average or multiple Moving Averages  (from Lowest MA Period to Highest MA Period). also you can apply  weighted factor that  increase / decrease from  lowest  MA to  highest  MA period. Inputs: Lowest MA Period Highest MA Period Weighted factor for Lowest MA Period Weighted factor for Highest MA Period MAs method MAs applied price ATR Period 1st band factor 2nd band factor 3rd band factor indicator Applied price
FREE
RCCMA is a general moving average indicator that works with ReviewCandleChart. Original is "Custom Moving Average" provided by MetaQuotes Software Corp. Based on that source code, I corresponded to ReviewCandleChart . Advantages When ReviewCandleChart is ON, no line will be displayed on the right side from the vertical reference line. When ReviewCandleChart is ON and you press a key such as "Z" or "X" Following that, the MA is drawn. When ReviewCandleChart is OFF, the same drawing as the origi
FREE
Envelopes Grid
Dominik Mandok
5 (1)
It's a simple but useful tool for creating a grid based on Envelopes. Only 2 parameters can be set: 1) "Period" - the period of all visible Envelopes (i.e. 4) and 1 Moving Average (Envelopes axis), 2) "Deviations Distance" - the distance between Envelopes. Naturally, the colors of all 9 lines can be changed as desired. It works with everything that is available in your Market Watch. Good luck!
FREE
Laguerre Dots 2 AM
Andriy Matviyevs'kyy
This indicator displays the signals of a highly effective oscillator -  Laguerre Osc 2 AM   - on the price chart. The presented indicator uses the Laguerre filter to build an oscillator. The indicator has the possibility of double additional smoothing, which can be useful for small values ​​of the Gamma parameter. The indicator gives three types of signals: Exit of the oscillator from the overbought / oversold zone; The oscillator crossing the middle of the value between the overbought/oversold
Kombajn Signal
Mariusz Piotr Rodacki
The indicator still has a few bugs but is ready for testing. This is my first indicator that determines entry and exit points. The entry point is based on breaking the peaks determined by a channel indicating highs and lows (invisible channels). TP1 is a probable target at which most positions can be closed. The channel determining the opening and closing of positions is based on different assumptions. The red stop loss line is determined based on lows and highs. The stop loss can be adjusted
FREE
ReturnAutoScale
Stanislav Korotky
5 (2)
The indicator calculates running total of linear weighted returns. It transforms rates into integrated and difference-stationary time series with distinctive buy and sell zones. Buy zones are shown in blue, sell zones in red. Parameters: period - number of bars to use for linear weighted calculation; default value - 96; smoothing - period for EMA; default value - 5; mode - an integer value for choosing calculation mode: 0 - long term trading; 1 - medium term trading; 2 - short term trading; defa
FREE
Comb
Iurii Tokman
Comb   Der Indikator zeigt ein Wabengitter oder ein regelmäßiges Sechseck an. Alternative zum Standard-Handelsterminalraster. Beschreibung der Anzeigeeinstellungen: color_comb - Gitterfarbe Breite - Breite, Beispiel: 22 für einen Bildschirm mit einer Auflösung von 1920 * 1080, 15 für einen Bildschirm mit einer Auflösung von 1366 * 768 usw. Höhe - Höhe, zum Beispiel: 6 für einen Bildschirm mit einer Auflösung von 1920 * 1080, 4 für einen Bildschirm mit einer Auflösung von 1366 * 768 usw.
FREE
Indicators are professional data statistics, position orders, historical order analysis->>>>>> <This version is in Chinese -> English version please move> Necessary for traders: tools and indicators Waves automatically calculate indicators, channel trend trading Perfect trend-wave automatic calculation channel calculation , MT4 Perfect trend-wave automatic calculation channel calculation , MT5 Local Trading copying Easy And Fast Copy , MT4 Easy And Fast Copy , MT5 Local Trading copying For DEMO
FREE
1、能显示货币之间的强弱 0是最弱 7是最强 2、能显示28个货币以及黄金 原油的 涨跌幅度 3、能切换货币对 4、能显示持仓订单的货币对 1、能显示货币之间的强弱 0是最弱 7是最强 2、能显示28个货币以及黄金 原油的 涨跌幅度 3、能切换货币对 4、能显示持仓订单的货币对 5、能利用键盘的的上下键切换货币对,左右键切换周期 1、能显示货币之间的强弱 0是最弱 7是最强 2、能显示28个货币以及黄金 原油的 涨跌幅度 3、能切换货币对 4、能显示持仓订单的货币对 5、能利用键盘的的上下键切换货币对,左右键切换周期 5、能利用键盘的的上下键切换货币对,左右键切换周期 1、能显示货币之间的强弱 0是最弱 7是最强 2、能显示28个货币以及黄金 原油的 涨跌幅度 3、能切换货币对 4、能显示持仓订单的货币对 5、能利用键盘的的上下键切换货币对,左右键切换周期
FREE
WPR Signal AM
Andriy Matviyevs'kyy
This indicator displays the signals based on the values of the classic WPR indicator. The WPR indicator can be used for determining the overbought or oversold areas on the chart. Reaching these levels means that the market can soon turn around, but it does not give signal, as in a strong trend the market can stay in the overbought or oversold state for quite a long time. As with most oscillators, the signals are generated when leaving these areas. This indicator allows to display three types of
FREE
The indicator calculates a combination of two moving averages and displays their trend in derivative units. Unlike traditional oscillators, the maximum and minimum values ​​in this indicator always correspond to the number of bars you want to track. This allows you to use custom levels regardless of volatility and other factors. The maximum and minimum values ​​are always static and depend only on the initial Bar review settings. The indicator can be used as an independent trading systemtradin
FREE
This simple indicator paints with a darker color on the volume bar when the quantity traded is above the average of select number of periods of the volume itself, highlighting the moments when there was a large volume of deals above the average. It is also possible to use a configuration of four colors where the color tone shows a candle volume strength. The indicator defaults to the simple average of 20 periods, but it is possible to change to other types of averages and periods. If you like
FREE
Updates 9/12/2023 - If you are looking for the Spock EA, I don't sell it anymore. DM me for more info. 24/10/2023  -  Check out my other products. Starting to roll out some EAs & indicators based on this range. Currently there is no MT5 version. I am using MT4 myself. So I will spend my time mostly to develop more extensive stats for the Stats version and maybe even an EA. But I might  develop a MT5 version. All depends on the demand. Meaning, the more people request it, the bigger the
FREE
RSI vs Envelopes
Yurij Izyumov
2 (2)
This semaphore indicator is based in the standard RSI, which is applied over the Envelopes indicator that shows an envelope or envelope fluctuation borders. This is a version of RSI vs Envelopes Graph drawn in a separate window . A sell signal emerges when the upper envelope/border is broken by the RSI indicator from top to bottom. A buy signal emerges when the lower envelope/border is broken by the RSI indicator from bottom upwards. The indicator can draw arrows on the indicator, draw vertical
FREE
Color Levels
Roman Podpora
4.84 (31)
Color Levels is a convenient tool for traders using a Trendline and a Rectangle in their technical analysis. It allows setting two empty rectangles, three filled ones, and two tredlines. The indicator parameters are very simple and divided into numbered blocks: The ones beginning with 1 and 2 - empty rectangle (frame) parameters; 3, 4, and 5 - filled rectangle parameters; 6 and 7 - trendline parameters. Simply click a desired object and it will appear in the upper left corner. Main Adjustable Pa
FREE
LyfUD指标专门 为黄金设计的趋势指标 ,也可以用于任何金融工具。用于及时反映多空力量,由U线和D线组成, 波动以0为中轴偏离运行, U线为快线D线为慢线。 LyfUD指标可以和 绝大多数策略结合使用 ,能够更加有效的把握风控。 U线和D线采用价格行为市场追踪算法,能及时反映市场方向, 可用在任意货币。 特性: 1. U线、D线在0轴上方,买入信号参考。 2. U线、D线 在0轴下方 ,卖出信号参考。 3. U线、D  线极限背离转向,行情可能出现反转。 4.  滞后性低,能及时反映趋势。 致力于结合其他指标,LyfUD和  均线、Pinbar  等搭配使用能迅速找到一些合理的关键位。 LyfUD只作为参考依据,其风险与作者无关。未经作者同意,禁止他售。
FREE
MWC Ratio
Joerg Hamann
4 (1)
The Commitments of Traders Ratio Indicator is one of these things you never thought about it before you really see the magic behind it. The indicator shows the Ratio of long/short positions released by the CFTC once a week. If you have a look on the Sreenshot you can see two (three) zones of interest. Zone 1: The Switches (Red -> Green, Green -> Red) Zone 2: MA cross Zone 3: If you combine this with the COX indicator an additional zone will appear. You also can experiment with Ratio crossing M
FREE
Käufer dieses Produkts erwarben auch
Gann Made Easy
Oleg Rodin
4.85 (82)
Gann Made Easy ist ein professionelles und einfach zu bedienendes Forex-Handelssystem, das auf den besten Handelsprinzipien unter Verwendung der Theorie von Mr. basiert. W.D. Gann. Der Indikator liefert genaue KAUF- und VERKAUFSsignale, einschließlich Stop-Loss- und Take-Profit-Levels. Mit PUSH-Benachrichtigungen können Sie auch unterwegs handeln. Bitte kontaktieren Sie mich nach dem Kauf! Ich werde meine Handelstipps und tolle Bonusindikatoren kostenlos mit Ihnen teilen! Wahrscheinlich haben Si
TPSpro RFI Levels
Roman Podpora
4.82 (22)
Umkehr der ersten Impulsniveaus (RFI)       ANWEISUNGEN       Russland       -        ENG    Die Empfehlung basiert auf dem Indikator -   TPSpro   TREND PRO -   Version MT5 Die wichtigsten Elemente in der Branche sind entweder in Zonen oder in der Fabrik enthalten, oder sie führen zu einer Lösung bei einem Kauf oder dem Verkauf eines anderen Instruments. Wenn viele Menschen ihre Rechte nicht auf dem Händlerkonto verschlüsseln, werden die Folgen nicht schnell genug sein. Ich habe es damit abgesc
Atomic Analyst
Issam Kassas
5 (2)
Zunächst einmal ist es erwähnenswert, dass dieser Handelsindikator nicht neu malt, nicht neu zeichnet und keine Verzögerung aufweist, was ihn sowohl für manuellen als auch für Roboterhandel ideal macht. Benutzerhandbuch: Einstellungen, Eingaben und Strategie. Der Atom-Analyst ist ein PA-Preisaktionsindikator, der die Stärke und das Momentum des Preises nutzt, um einen besseren Vorteil auf dem Markt zu finden. Ausgestattet mit fortschrittlichen Filtern, die helfen, Rauschen und falsche Signale z
Gold Stuff
Vasiliy Strukov
4.89 (238)
Gold Stuff-Ein Trendindikator, der speziell für Gold entwickelt wurde, kann auch auf allen Finanzinstrumenten verwendet werden. Der Indikator wird nicht neu gezeichnet und verzögert sich nicht. Empfohlener Zeitrahmen H1. Nach diesem Indikator geschrieben EA Gold Stuff Berater, können Sie es in meinem Profil finden. WICHTIG! Kontaktieren Sie mich sofort nach dem Kauf, um Anweisungen und Bonus zu erhalten!   Sie können eine kostenlose Kopie unseres Strong Support- und Trendscanner-Indikators
Trend Punch
Mohamed Hassan
4.95 (19)
This indicator is unstoppable when combined with our other indicator called  Support & Resistance . After purchase, send us a message and you will get it   for  FREE as a BONUS! Introducing Trend Punch , the revolutionary forex trend indicator that will transform the way you trade! Trend Punch is uniquely designed to provide precise buy and sell arrows during strong market trends, making your trading decisions clearer and more confident. Whether you're trading major currency pairs or exotic sym
TPSproTREND PrO
Roman Podpora
4.79 (19)
TPSpro TREND PRO   ist ein Trendindikator, der den Markt automatisch analysiert und Informationen über den Trend und jede seiner Änderungen liefert sowie Signale für den Einstieg in Geschäfte ohne Neuzeichnung gibt! Der Indikator verwendet jede Kerze und analysiert sie separat. bezieht sich auf verschiedene Impulse – Aufwärts- oder Abwärtsimpuls. Exakte Einstiegspunkte in Transaktionen für Währungen, Krypto, Metalle, Aktien, Indizes! Version MT5                   VOLLSTÄNDIGE BESCHREIBUNG DES
Scalper Inside PRO
Alexey Minkov
4.73 (56)
An exclusive indicator that utilizes an innovative algorithm to swiftly and accurately determine the market trend. The indicator automatically calculates opening, closing, and profit levels, providing detailed trading statistics. With these features, you can choose the most appropriate trading instrument for the current market conditions. Additionally, you can easily integrate your own arrow indicators into Scalper Inside Pro to quickly evaluate their statistics and profitability. Scalper Inside
FX Power MT4 NG
Daniel Stein
5 (12)
Erhalten Sie Ihr tägliches Marktupdate mit Details und Screenshots über unser Morning Briefing hier auf mql5 und auf Telegram ! FX Power MT4 NG ist die nächste Generation unseres langjährig sehr beliebten Währungsstärkemessers FX Power. Und was bietet dieser Stärkezähler der nächsten Generation? Alles, was Sie am ursprünglichen FX Power geliebt haben PLUS GOLD/XAU-Stärkeanalyse Noch präzisere Berechnungsergebnisse Individuell konfigurierbare Analysezeiträume Anpassbares Berechnungslimit für noc
Trend Screener
STE S.S.COMPANY
4.8 (87)
Trendindikator, bahnbrechende, einzigartige Lösung für Trendhandel und -filterung mit allen wichtigen Trendfunktionen in einem Tool! Es handelt sich um einen 100 % nicht neu zu malenden Multi-Timeframe- und Multi-Währungs-Indikator, der für alle Symbole/Instrumente verwendet werden kann: Forex, Rohstoffe, Kryptowährungen, Indizes und Aktien. ZEITLICH BEGRENZTES ANGEBOT: Der Support- und Resistance-Screener-Indikator ist für nur 50 $ und lebenslang verfügbar. (Ursprünglicher Preis 250 $) (Angebot
Derzeit 20% Rabatt! Die beste Lösung für jeden Neueinsteiger oder Expert Händler! Dieses Dashboard arbeitet mit 28 Währungspaaren. Es basiert auf 2 unserer Hauptindikatoren (Advanced Currency Strength 28 und Advanced Currency Impulse). Es bietet einen hervorragenden Überblick über den gesamten Forex-Markt. Es zeigt die Werte der Advanced Currency Strength, die Veränderungsrate der Währungen und die Signale für 28 Devisenpaare in allen (9) Zeitrahmen. Stellen Sie sich vor, wie sich Ihr Hande
FX Volume
Daniel Stein
4.58 (33)
Erhalten Sie Ihr tägliches Marktupdate mit Details und Screenshots über unser Morning Briefing hier auf mql5 und auf Telegram ! FX Volume ist der ERSTE und EINZIGE Volumenindikator, der einen ECHTEN Einblick in die Marktstimmung aus Sicht eines Brokers bietet. Es bietet fantastische Einblicke in die Positionierung von institutionellen Marktteilnehmern, wie z.B. Brokern, auf dem Forex-Markt, viel schneller als COT-Berichte. Diese Informationen direkt auf Ihrem Chart zu sehen, ist der wahre Game
DERZEIT 31% RABATT! Die beste Lösung für jeden Newbie oder Expert Trader! Dieser Indikator ist ein einzigartiges, qualitativ hochwertiges und erschwingliches Handelsinstrument, da wir eine Reihe von proprietären Funktionen und eine geheime Formel eingebaut haben. Mit nur EINEM Chart liefert er Alerts für alle 28 Währungspaare. Stellen Sie sich vor, wie sich Ihr Handel verbessern wird, weil Sie in der Lage sind, den genauen Auslösepunkt eines neuen Trends oder einer Scalping-Gelegenheit zu e
Enigmera
Ivan Stefanov
5 (3)
ENIGMERA: Der Kern des Marktes https://www.enigmera.com Einführung Dieser Indikator und dieses Handelssystem sind ein bemerkenswerter Ansatz für die Finanzmärkte. ENIGMERA nutzt die fraktalen Zyklen zur genauen Berechnung von Unterstützungs- und Widerstandsniveaus. Er zeigt die echte Akkumulationsphase an und gibt Richtung und Ziele vor.  Ein System, das funktioniert, egal ob wir uns in einem Trend oder in einer Korrektur befinden.  Wie funktioniert es? ENIGMERA besteht aus drei Linien: der
- Real price is 80$ - 40% Discount ( It is 49$ now ) Contact me for instruction, add group and any questions! Related EA Product: Bitcoin Expert Introduction The breakout and retest strategy is traded support and resistance levels. it involves price breaking through a previous level.  The break and retest strategy is designed to help traders do two main things, the first is to avoid false breakouts. Many false breakouts start with a candlestick that breaks out of a level but ends with an immedi
Der Chart Patterns All-in-One Indikator hilft Tradern, verschiedene Chartmuster, die häufig in der technischen Analyse verwendet werden, zu visualisieren. Dieser Indikator unterstützt die Identifizierung möglicher Marktbewegungen, garantiert jedoch keine Rentabilität. Es wird empfohlen, den Indikator vor dem Kauf im Demomodus zu testen. Aktuelles Angebot : 50 % Rabatt auf den "Chart Patterns All in One" Indikator. Enthaltene Muster : Muster 1-2-3 : Erkennt Marktumkehrungen mithilfe von drei Schl
DERZEIT 26% RABATT Die beste Lösung für jeden Newbie oder Expert Trader! Dieser Indikator ist ein einzigartiges, qualitativ hochwertiges und erschwingliches Trading-Tool, da wir eine Reihe von proprietären Funktionen und eine neue Formel integriert haben. Mit nur EINEM Chart können Sie die Währungsstärke für 28 Forex-Paare ablesen! Stellen Sie sich vor, wie sich Ihr Handel verbessern wird, weil Sie in der Lage sind, den genauen Auslösungspunkt eines neuen Trends oder einer Scalping-Gelegenh
Werden Sie Breaker Trader und profitieren Sie von Änderungen der Marktstruktur, wenn sich der Preis umkehrt. Der Order Block Breaker Indikator zeigt an, wann sich eine Trend- oder Preisbewegung der Erschöpfung nähert und bereit ist, sich umzukehren. Es weist Sie auf Änderungen in der Marktstruktur hin, die normalerweise auftreten, wenn eine Umkehrung oder ein größerer Rückzug bevorsteht. Der Indikator verwendet eine proprietäre Berechnung, die Ausbrüche und Preisdynamik identifiziert. Jedes
Bomb Bank Signal
Igor Pereira Calil
5 (1)
Bombenbanksignal: Ihr Vertrauensindikator in MetaTrader 4 Bomb Bank Signal ist ein leistungsstarker Indikator für MetaTrader 4, der entwickelt wurde, um die relevantesten Trends auf dem Finanzmarkt zu identifizieren. Wenn Sie nach einem Tool suchen, das Bewegungen genau vorhersieht, ist die Bomb Bank der Verbündete, den Sie brauchen. So funktioniert es: Dieser Indikator kombiniert drei unterschiedliche Methoden – Volumenanalyse, Kerzenschließungen und symmetrischer Trend –, um Kauf- und V
Trend Cutter
Oleg Rodin
5 (2)
Trend Cutter ist ein Trendindikator, der für jeden Zeitrahmen verwendet werden kann, einschließlich der niedrigeren Zeitrahmen wie M1 und M5. Der Indikator ist ideal für Händler, die den Intraday-Handel bevorzugen, und wird auch für diejenigen hilfreich sein, die den langfristigen Handel bevorzugen. Sie können diesen Indikator als Basis für Ihr Handelssystem oder als eigenständige Handelslösung verwenden. Der Indikator bietet alle Arten von Warnungen, einschließlich PUSH-Benachrichtigungen. Der
TakePropips Donchian Trend Pro
Eric John Pajarillaga Aldana
4.44 (16)
TakePropips Donchian Trend Pro   (MT4) ist ein leistungsstarkes und effektives Tool, das mithilfe des Donchian-Kanals automatisch die Richtung des Trends erkennt und Ihnen Handelssignale für den Ein- und Ausstieg liefert! Dieser Multifunktionsindikator umfasst einen Trendscanner, Handelssignale, ein statistisches Panel, einen Screener, Handelssitzungen und ein Dashboard für den Verlauf von Warnungen. Es wurde entwickelt, um Ihnen Handelssignale zu liefern und Ihnen Stunden beim Analysieren der C
IX Power MT4
Daniel Stein
5 (5)
IX Power bringt die unschlagbare Präzision von FX Power endlich auch zu Nicht-Forex-Symbolen. Es bestimmt präzise die Intensität von kurz-, mittel- und langfristigen Trends in Ihren Lieblingsindizes, Aktien, Rohstoffen, ETFs und sogar Kryptowährungen. Sie können alles analysieren, was Ihr Terminal zu bieten hat. Probieren Sie es aus und erleben Sie, wie sich Ihr Timing beim Handel deutlich verbessert . IX Power Hauptmerkmale 100% präzise, nicht nachpinselnde Berechnungsergebnisse - für
Stratos Pali Indicator   is a revolutionary tool designed to enhance your trading strategy by accurately identifying market trends. This sophisticated indicator uses a unique algorithm to generate a complete histogram, which records when the trend is Long or Short. When a trend reversal occurs, an arrow appears, indicating the new direction of the trend. Important Information Revealed Leave a review and contact me via mql5 message to receive My Top 5 set files for Stratos Pali at no cost! D
Gold Channel is a volatility-based indicator, developed with a specific timing algorithm for the XAUUSD pair, which consists of finding possible corrections in the market. This indicator shows two outer lines, an inner line (retracement line) and an arrow sign, where the theory of the channel is to help identify overbought and oversold conditions in the market. The market price will generally fall between the boundaries of the channel. If prices touch or move outside the channel it is a tra
Advanced Supply Demand
Bernhard Schweigert
4.91 (294)
Derzeit 33% Rabatt! Die beste Lösung für jeden Anfänger oder erfahrenen Händler! Dieser Indikator ist ein einzigartiges, qualitativ hochwertiges und erschwingliches Trading-Tool, da wir eine Reihe von proprietären Funktionen und eine neue Formel integriert haben. Mit diesem Update werden Sie in der Lage sein, doppelte Zeitrahmenzonen anzuzeigen. Sie können nicht nur einen höheren TF (Zeitrahmen) anzeigen, sondern sowohl den Chart-TF als auch den höheren TF: SHOWING NESTED ZONES. Alle Supply Dema
Zeichnen Sie automatisch Unterstützungs- und Widerstandsniveaus PLUS Antriebskerzenlücken auf Ihrem Chart ein, so dass Sie sehen können, wohin sich der Preis wahrscheinlich als Nächstes bewegen und/oder möglicherweise umkehren wird. Dieser Indikator wurde entwickelt, um als Teil der Positionshandelsmethodik verwendet zu werden, die auf meiner Website (The Market Structure Trader) gelehrt wird, und zeigt Schlüsselinformationen für die Zielsetzung und potenzielle Einstiege an. Der Indikator v
Currency Strength Wizard ist ein sehr leistungsstarker Indikator, der Ihnen eine Komplettlösung für erfolgreichen Handel bietet. Der Indikator berechnet die Stärke dieses oder jenes Forex-Paares anhand der Daten aller Währungen in mehreren Zeitrahmen. Diese Daten werden in Form von benutzerfreundlichen Währungsindizes und Währungsstärkelinien dargestellt, anhand derer Sie die Stärke dieser oder jener Währung erkennen können. Sie müssen lediglich den Indikator an das Diagramm anhängen, mit dem Si
Order Block Hunter
Noha Mohamed Fathy Younes Badr
5 (4)
Order block hunter indicator is the best indicator for  hunt the order blocks that area where there has been a large concentration of limit orders waiting to be executed Order blocks are identified on a chart by observing previous price action and looking for areas where the price experienced significant movement or sudden changes in direction .This indicator does that for you by using very complicated codes and helps you to take the best areas To buy and sell because it make marks at the best a
Dieses Dashboard ist ein Warntool zur Verwendung mit dem Indikator für die Umkehrung der Marktstruktur. Sein Hauptzweck besteht darin, Sie auf Umkehrmöglichkeiten in bestimmten Zeitrahmen und auch auf die erneuten Tests der Warnungen (Bestätigung) aufmerksam zu machen, wie es der Indikator tut. Das Dashboard ist so konzipiert, dass es auf einem eigenen Chart sitzt und im Hintergrund arbeitet, um Ihnen Benachrichtigungen zu Ihren ausgewählten Paaren und Zeitrahmen zu senden. Es wurde entwickelt,
PRO Renko System ist ein hochpräzises Handelssystem, das speziell für den Handel mit RENKO-Charts entwickelt wurde. Dies ist ein universelles System, das auf verschiedene Handelsinstrumente angewendet werden kann. Das System neutralisiert effektiv so genannte Marktgeräusche, die Ihnen Zugang zu genauen Umkehrsignalen geben. Der Indikator ist sehr einfach zu bedienen und hat nur einen Parameter, der für die Signalerzeugung verantwortlich ist. Sie können das Tool einfach an jedes Handelsinstr
Trend Pulse
Mohamed Hassan
5 (4)
Please contact me after purchase to immediately get your PDF strategy + documentation for Trend Pulse !  Introducing Trend Pulse , a unique and robust indicator capable of detecting bullish, bearish, and even ranging trends! Trend Pulse uses a special algorithm to filter out market noise with real precision. If the current symbol is moving sideways, Trend Pulse will send you a ranging signal, letting you know that it's not a good time to enter a trade. This excellent system makes Trend Pulse
Weitere Produkte dieses Autors
Strength Glance
Zi Feng Ding
5 (2)
This indicator is a tool to measure the relative strength of different currency pairs. It used a user selected base currency as a comparing standard, and evaluate all other major currencies base on their relative strength/weakness. the stronger one currency compare to the base currency, the higher its value. Base currency has a fix strength value of 50. Indicator parameters Strength Period - Change the strength period in the settings affects the number of bars used for calculation. The higher
FREE
Auswahl:
topline8000
1144
topline8000 2022.05.04 02:17 
 

for verification of winning rate

Antwort auf eine Rezension