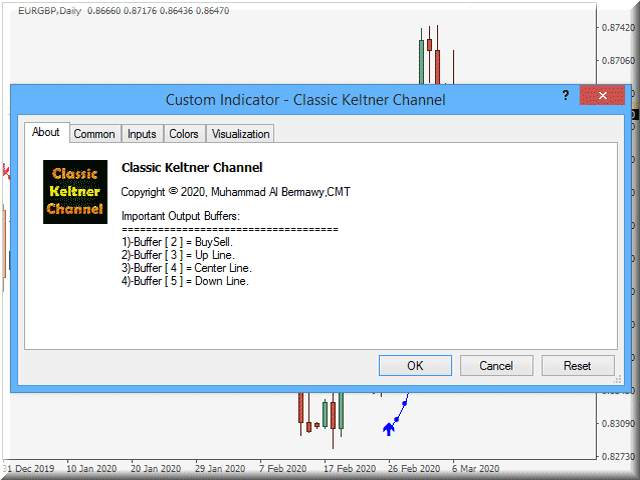
Classic Keltner Channel
- Indikatoren
- Muhammad Elbermawi
- Version: 2.2
- Aktualisiert: 8 März 2020
- Aktivierungen: 20
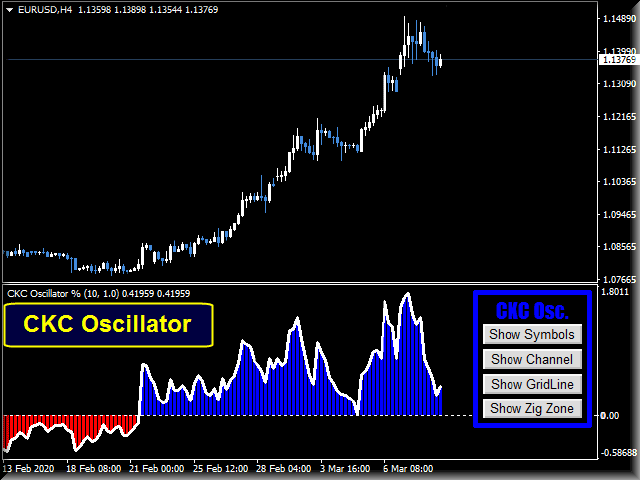
Oder CKC.
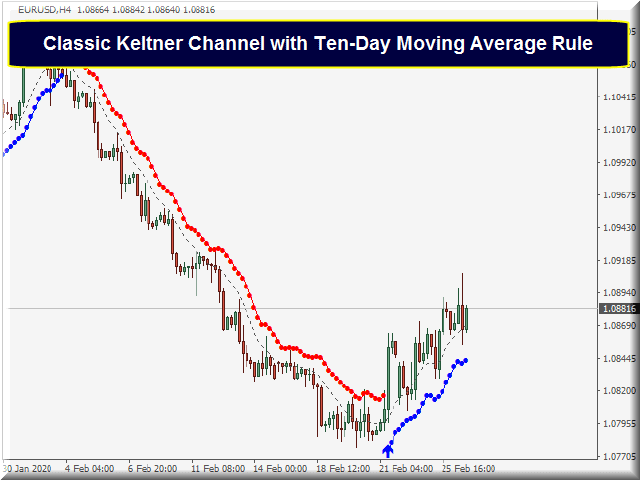
Dieser Indikator funktioniert in Abhängigkeit von der klassischen Zehn-Tage-Regel des gleitenden Durchschnitts, die von Chester W. Keltner (1909–1998) beschrieben wurde. Alle Parameter sind standardmäßig auf die klassische Version des Keltner-Systems eingestellt, während der Benutzer sie nach Belieben ändern kann.
Wichtige Informationen
Über die Keltner-Kanalformel
1. Berechnen Sie die Mittellinie als einfachen gleitenden Durchschnitt aus dem typischen Preis (= (Hoch + Tief + Schluss) / 3).
2. Berechnen Sie die durchschnittliche tägliche Spanne (ADR), die die durchschnittliche Differenz zwischen Hoch und Tief ist, mit dem gleichen Zeitraum und der gleichen Berechnungsmethode für die Mittellinie.
3. Keltner Kauflinie = Mittellinie + ADR.
4. Keltner Verkaufslinie = Mittellinie – ADR.
Keltner 10-Tage-Regel des gleitenden Durchschnitts
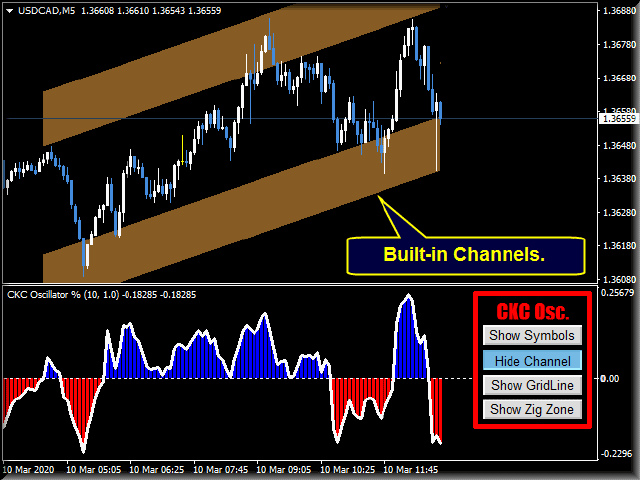
Die Keltner-Formel führt dazu, dass zwei grundlegende Linien auf dem Diagramm erstellt werden.
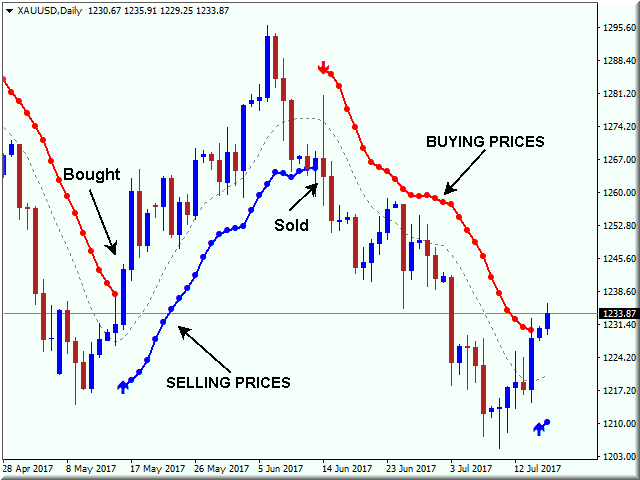
2. Keltner Verkaufslinie.Dies ist die Linie, in der Sie Ihre Kaufposition decken und verkaufen.
Durch die Verwendung dieser beiden Linien haben wir Handelsregeln erhalten, die auf dem in der technischen Analyse weit verbreiteten "Start and Reverse"-Prinzip basieren.
1. Wenn die Preislinie über der Keltner-Kauflinie (der roten Linie) schließt, dann kaufen. Verwenden Sie die Keltner-Verkaufslinie (die blaue Linie) als Stopp und kehren Sie vom Kauf zum Verkauf um.
2. Wenn die Preislinie unter der Keltner Sell Line (der blauen Linie) schließt, dann verkaufen. Verwenden Sie die Keltner-Kauflinie (die rote Linie) als Stopp und kehren Sie vom Verkauf zum Kauf um.
CKC-Funktionen
CKC zeichnet seine Ergebnisse nicht neu und berechnet sie auch nicht neu.
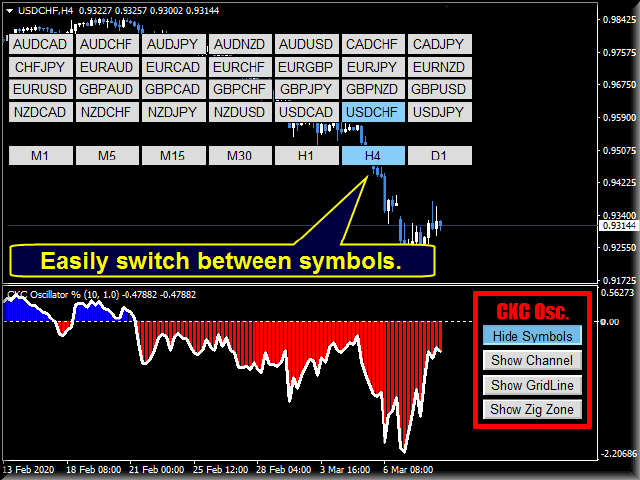
Es funktioniert auf Kryptowährungen, Aktien, Indizes, Öl, Gold und auf allen Zeitrahmen.
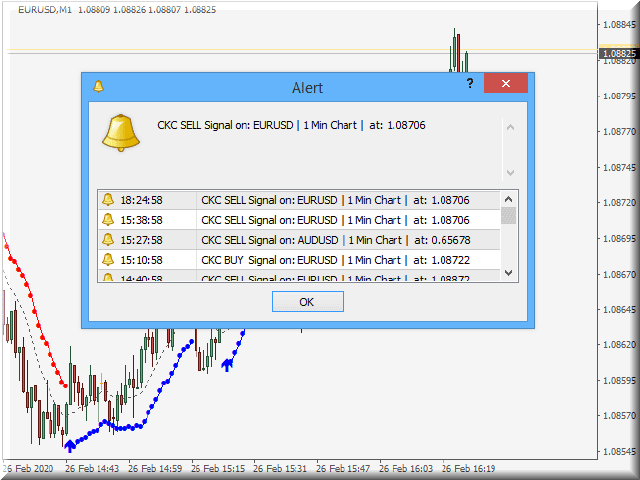
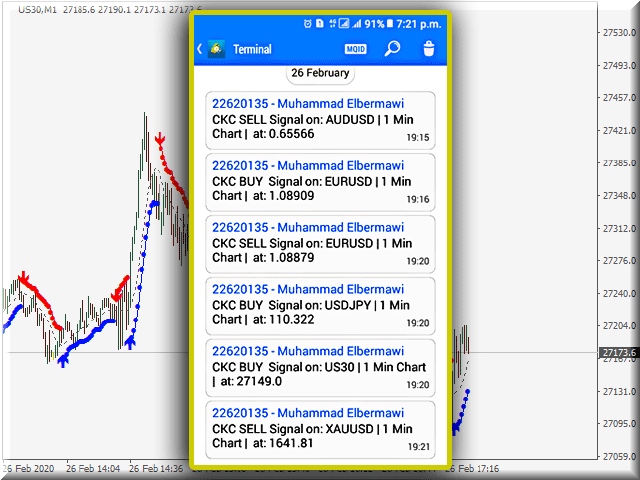
Ton, E-Mail-Benachrichtigungen und mobile Benachrichtigung.
Kaufen, verkaufen Sie Pfeile, um Trendsignale zu erkennen.
Gut gestaltete Parameter, die dem Benutzer helfen, leicht zwischen ihnen zu navigieren.
Puffer zum Aufbau eigener Fachberater.
Vier verschiedene Farblisten zur Auswahl.
CKC-Parameter
(1) ANZEIGEPARAMETER
- CKC-Kerzen.Die Anzahl der Kerzen, die in Bandberechnungen verwendet werden (Standard ist 10 Kerzen).
- CKC-Bereichsmultiplikator.Wie weit wird die Kauf-/Verkaufslinie von Keltner von ihrer Mittellinie getrennt (Standardwert ist 1,0).
- CKC-Methode des gleitenden Durchschnitts.Typ des gleitenden Durchschnitts, der in Berechnungen verwendet wird (einfacher gleitender Durchschnitt ist die Standardeinstellung).
- CKC angewandter Preis.Preis, der in Keltner-Mittellinienberechnungen verwendet wird (Typischer Preis ist die Standardeinstellung).
(2) WARNUNGEN
- Sirenenalarm.Wählen Sie aus, ob Sie den Warnton und die Nachricht verwenden oder stoppen möchten (Standard ist "true").
- E-Mail senden.Option zum Senden einer E-Mail an den Benutzer (Standard ist false).
- Senden Sie eine mobile Benachrichtigung.Option zum Senden einer mobilen Benachrichtigung an den Benutzer (Standard ist false).
(3) ANZEIGEART
- Liste der Diagrammfarben.Sie können zwischen vier verschiedenen Farblisten wählen (Standard ist Nichts tun).
- CKC obere Bandfarbe.Standard ist Rot.
- CKC untere Bandfarbe.Standard ist Blau.
- CKC-Breite.Standard ist eins.
Wenn Sie Fragen haben, kontaktieren Sie mich bitte über eine private Nachricht oder schreiben Sie diese in den Kommentarbereich.
Muhammad Al Bermaui, CMT


Indicator looks perfectly good and working fine, looking forward to learn it