MASi Impulse System Histogram
- Indikatoren
- Aleksey Terentev
- Version: 1.3
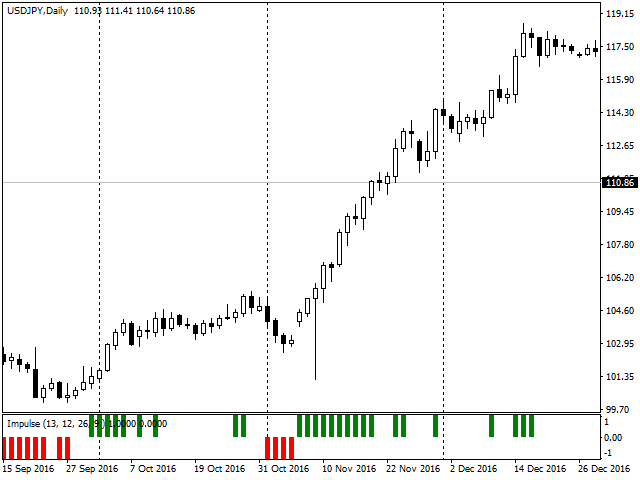
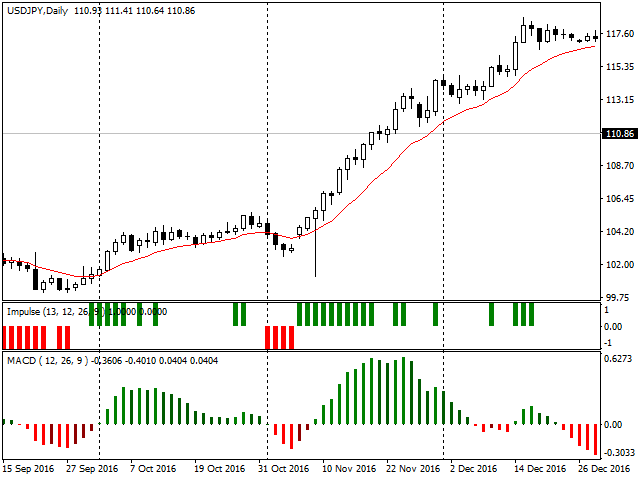
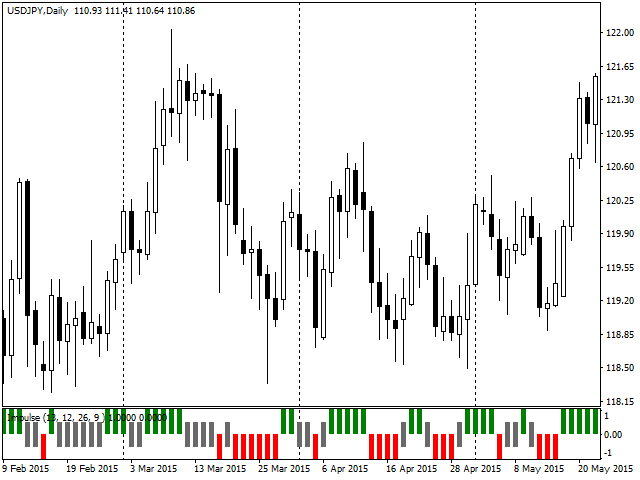
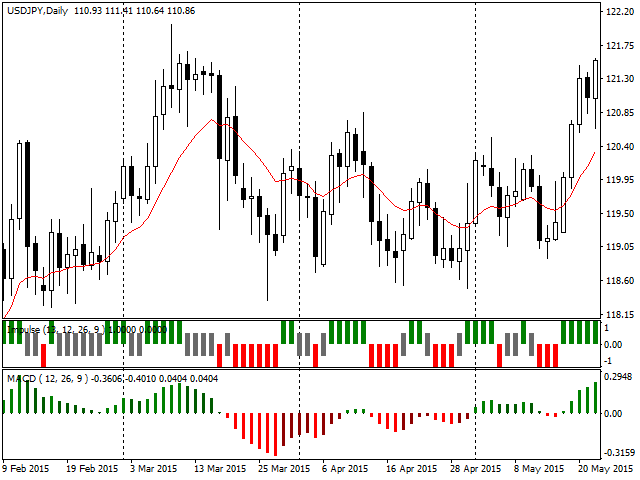
The implementation of the impulse system described by Dr. Alexander Elder.
The indicator generates signals according to the following pattern:
- Moving average and MACD histogram increase - green bar, it is forbidden to sell;
- Moving average and MACD histogram have different directions - gray (or empty) bar, the ban is removed;
- Moving average and MACD histogram decrease - red bar, it is forbidden to buy.
Indicator Parameters
- EMA - period of the indicator's moving average
- MACD Fast - period of the fast moving average of the MACD indicator
- MACD Slow - period of the slow moving average of the MACD indicator
- MACD Signal - period of the signal moving average of the MACD indicator
- Neutral Signal - enable/disable the display of the neutral signal


very nice indicator. Thanks!