• Übersicht
  • Bewertungen
  • Diskussion (4)
  • Neue Funktionen

Ejike Currency Basket

Ejike Currency Basket compiles and analyses foreign exchange currency strength and volatility dynamics for the 8 major currencies. Its data are formulated from market prices and volatility. ECB visually cross-references its own reports to generate high probability trade pairs, the build-up to which is interactive that the trader can easily assume the role of Analyst. Its 28-pair real time monitoring involves a constant comparison of its current to past data. On adjusting a parameter, it will change from a dashboard to an indicator used for trade entry and trade monitoring.

The advantages:

  • focus in trading
  • precision data presented in numerals
  • simplified real time data analyses
  • interactive application interface and
  • capacity to recall historic data without recourse to the Strategy Tester.

The use of this tool brings relaxed approach to FX trading, improves trader’s confidence, focus and the precision of his/her trading decisions. Past data analyses are made possible by the use of the Strategy Tester to regenerate past snapshots of reports or by simply adjusting ECBindex parameter.

How it works:

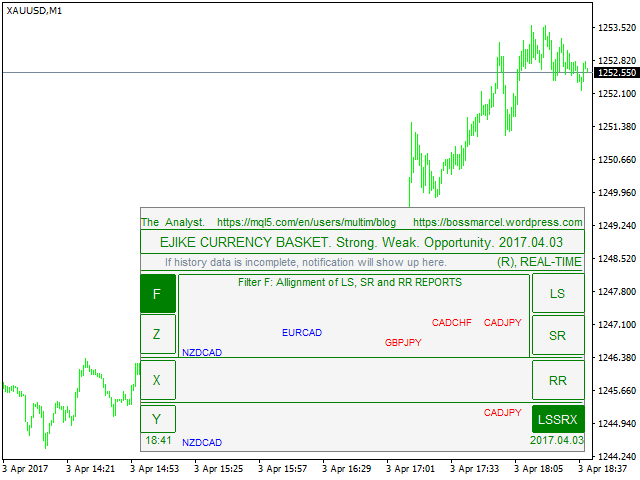
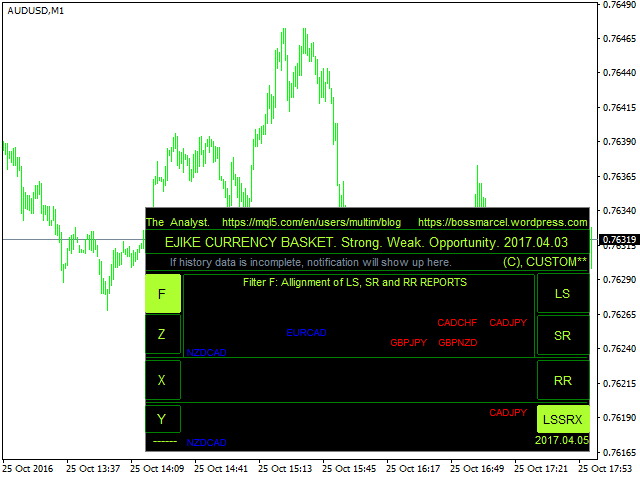
  • The robot computes, synchronizes and cross references the X, Y, Z, LS, SR, and RR sections reports and then publishes to the filters, LSSRX and "F", a summary of Strength, Weakness and Opportunity for Trade ("SWOT") in relevant currency pairs. Its suggestions are reliable.
  • The Trader observes, confirms and uses ECBmini indicator to enter and monitor trades. This is easy in practice.

Indicator parameters

The first four parameters in the list of parameters are:

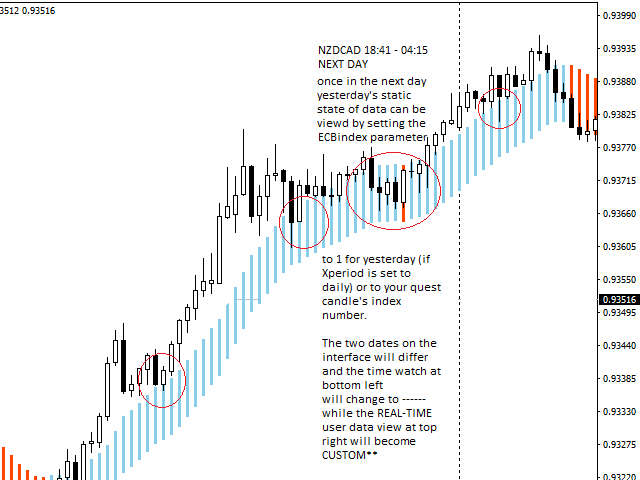
  • ECBindex - the candle or bar index that determines the position from which the strength computation and analyses are performed.
  • ECB Mode: Dashboard - the mode of operation of the application, when the value is set to true the application is in the ECB dashboard mode but when set to false the application goes into the ECBmini indicator mode. The dashboard is use for analyses while the indicator is used for trade management. It is recommended that ECBmini indicator is used on time frames M15 and M30 if Strength Computation Timeframe parameter is set to D1.
  • Strength Computation Timeframe - The time frame for strength computation and analyses.
  • Enable Automatic Refresh - The value of true means that data are updated automatically.

Apart from those displayed externally, crucial parameters have been optimized and configured to work internally and thus do not require further configuration by way of external inputs. For access to most of ECB information the trader may click on buttons on the application interface. When the trader arrives at the decision to take a trade, the second parameter in the list of parameters, "ECB Mode: Dashboard", is to be set to false to switch to the ECBmini indicator that is included to help the trader to NOT jump into trades but to anticipate “sweet spots” or points of entry. Trading this way ensures we can apply the method repeatedly. The trader is to “Enable Auto Refresh” by setting the very parameter to true otherwise he/she has to hit “F” or “LSSRX” button to refresh data manually.

New and Experienced Traders

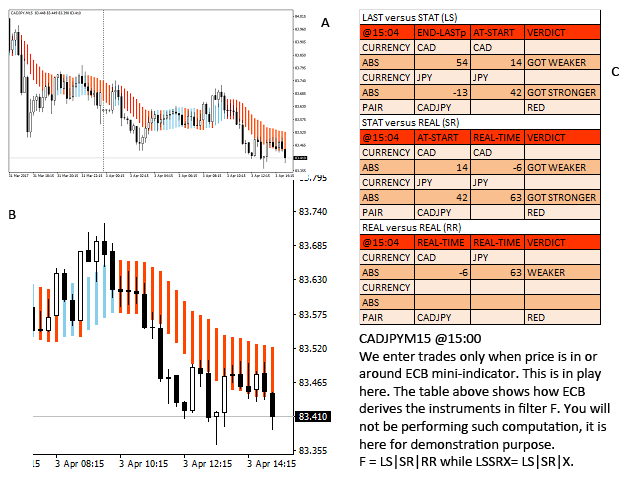
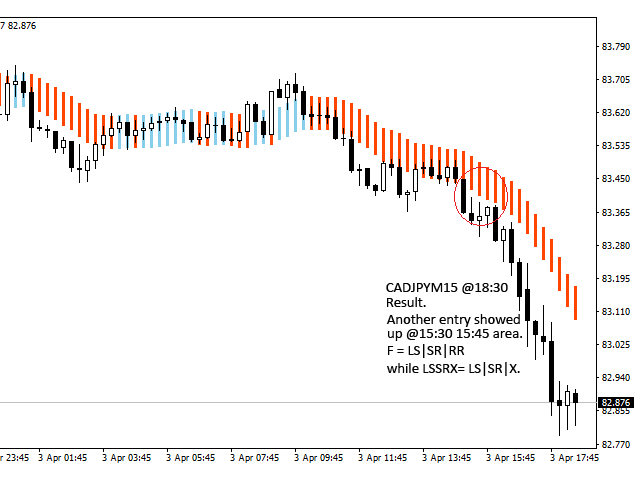
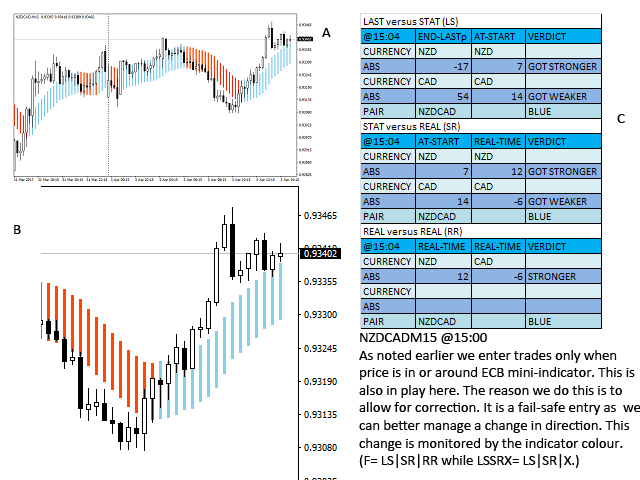
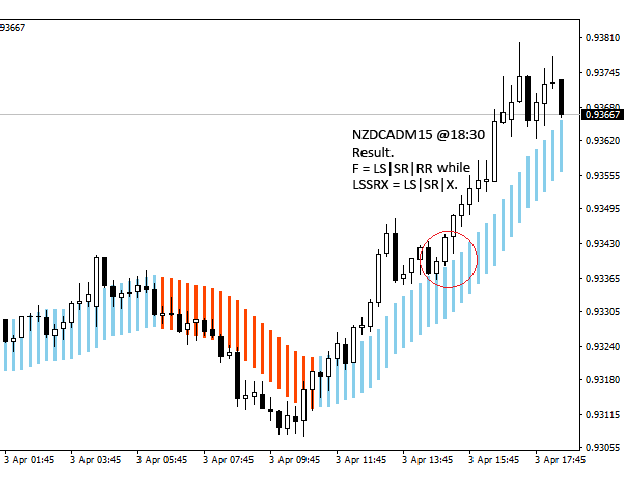
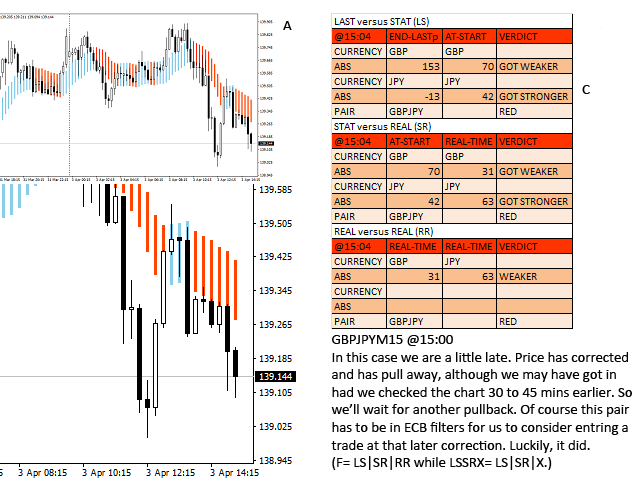
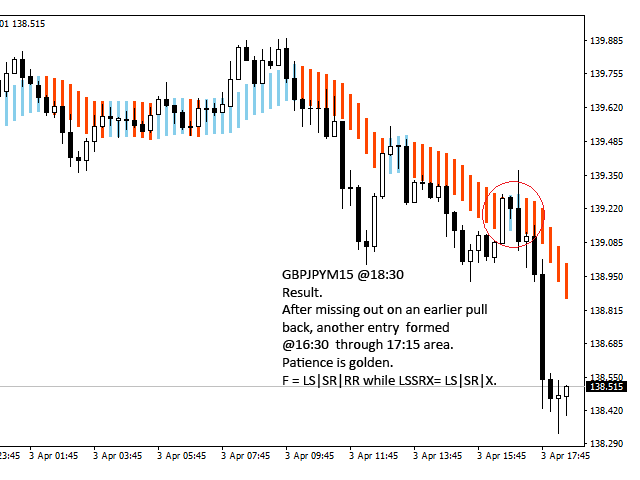
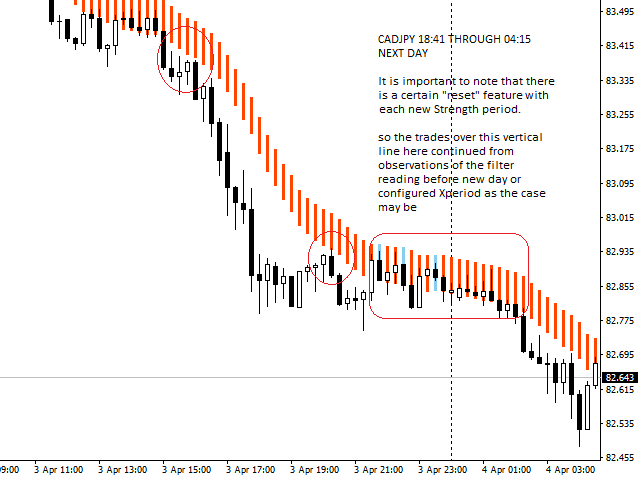
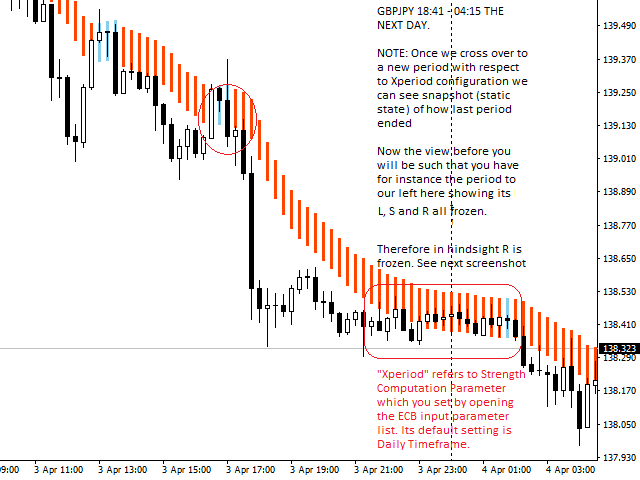
For the new/inexperienced or the trader who does not wish to task his/her mind further when trading, this tool was designed to be used at any level of experience. Therefore, selecting the pairs displayed in LSSRX or "F" for trading and following the simple entry rule may be sufficient. But, while an experienced trader already knows the power of a well formulated system of currency groups, a new trader has the potential to learn. That said a trader should combine the reports of "Y" and "Z" to reinforce those of "F" and LSSRX. He/she will find this an easy task, for the objective of ECB is to keep FX trading simple as well as profitable. "Y" report shows "resilience" in currency pairs while "Z" report shows alignment of absolute strengths (i.e the numbers in brackets) ordered left to right as "L", "S" and "R". The trader may use ECB as described in product description screenshots. These are useful because the examples therein were observed live on April 3, 2017, from 15:04 Alpari Standard3 Server Time to 18:41 same day and by extension from 18:41 to 04:15 next trading day. Do well to visit developer's blog on mql5.com for more and more examples. Happy trading.

Empfohlene Produkte
Forex Flow Equalizer is an indicator that helps to reduce 'noise' in forex price movements. Visit https://www.mql5.com/en/blogs/post/751167 for more detailed explanation. It is programmed to enhance traders' focus, and capacity to monitor or manage multiple instruments of interest on preferred timeframe without their minds being over loaded with data or information, thereby, saving them the mental strength for more important trading decision making. Range Mode: is for traders who like to trade
Breakeven line calculator MT4
Wafa Mohammed Omar Abou Alwafa
This indicator shows the breakeven line level for the total number of open positions of the current symbol with P/L value and total volume. This indicator is helpful to decide the exit level when using a trading grid strategy. The style of the breakeven line is customizable to choose the color, line shape and font size of the positions description. Send mobile notification when crossing a positive P/L target
FREE
The UNIVERSAL DASHBOARD indicator will eliminate the need of using dozens of indicators on dozens of charts. From one place you can monitor all the pairs and all the timeframes for each of the following indicators: MACD STOCHASTIC WPR RSI CCI You can also use any Custom indicator in the dashboard as long as it has a readable buffer. With a single click you can quickly navigate between charts, pairs and timeframes. Alerts will provide clear indication about what happens for your favorite pairs on
FREE
This indicator will display current logined mt4 account's orders information of current symbol chart. It also allow import some formated data: 1) MQL5 Signals History CSV file (*.csv) 2) MT4 Account History Statement file (*.htm -> *.txt) *[Next Version] Allow Import data form 'HF HistoryExporter (*.csv)' Sample Data of MQL5 Signals History File Time;Type;Volume;Symbol;Price;S/L;T/P;Time;Price;Commission;Swap;Profit;Comment 2023.12.20 23:00:02;Buy Limit;0.06;EURUSD;1.08994;1.06024;1.09464;2
Introducing the   “Symbol Cost Info MT4”   indicator – your ultimate tool for staying ahead in the forex market! This innovative indicator is designed to empower traders with real-time cost information, directly on their charts. Here’s why every trader needs the “Symbol Cost Info MT4” in their arsenal: Real-Time Spread Monitoring : Keep a close eye on the spread for any currency pair, ensuring you enter the market at the most cost-effective times. Pip Value at Your Fingertips : Instantly know t
FREE
US30 And US100 Top-Down Analysis EA MT4 analyzing the overall market environment and economic conditions first before zooming in to the lower timeframe for entry. Starting from the big picture DAILY and then narrowing down to 1 HOUR and take the entry in 5M timeframe This EA adapt to changing market conditions, continuously monitoring macroeconomic indicators and sector performance, and adjust the trading strategies to capitalize on emerging trends. US30 And US100 Top-Down Analysis EA MT4 does n
IX Power MT4
Daniel Stein
5 (5)
IX Power bringt die unschlagbare Präzision von FX Power endlich auch zu Nicht-Forex-Symbolen. Es bestimmt präzise die Intensität von kurz-, mittel- und langfristigen Trends in Ihren Lieblingsindizes, Aktien, Rohstoffen, ETFs und sogar Kryptowährungen. Sie können alles analysieren, was Ihr Terminal zu bieten hat. Probieren Sie es aus und erleben Sie, wie sich Ihr Timing beim Handel deutlich verbessert . IX Power Hauptmerkmale 100% präzise, nicht nachpinselnde Berechnungsergebnisse - für
This Dashboard displays signals in grid view for the 28 major fx currency pairs. It is Mainly used for forex scalping in between 10 to 20 pips maximum and can be used on major trend market decisions. It Uses mainly Moving average and does not give false signal. All you need to note is the point in the grid where the signal occurs.  A beep sound is heard whenever there is a new signal and it will be displayedat the top of the chart.
Super Mart
Evgeny Vlasov
Operation principles The Expert Advisor works on any timeframe and symbol. The robot analyzes the relative MAs position. Pending orders are opened after the necessary conditions are met. No next order is opened till the previous one is closed. The server time is analyzed when opening orders. The EA opens orders in the most appropriate trading periods. A lot volume ratio is used when entering the market. The lot volume is changed during trading. You only need to set six parameters. Parameters S
Delving deep into the sphere of finance and trading strategies, I decided to conduct a series of experiments, exploring approaches based on reinforcement learning as well as those operating without it. Applying these methods, I managed to formulate a nuanced conclusion, pivotal for understanding the significance of unique strategies in contemporary trading.  
FREE
Top Gun Oscillators
Safwan Rushdi Khalil Arekat
5 (3)
Note : New in 1.6: the indicator now exports the trade signal (but not displayed). Go long with light blue. Go short with red. Exit otherwise. Signal to be imported to your EA using iCustom. This indicator provides Best of the Best linear filter momentum oscillators that I am aware of (Low Pass Differentiators, LPD's) . All of them are  recent developments by this developer, or other researchers. The oscillator line is the first buffer of the indicator, and can be called  in other indicators or
FREE
This is the linear regression indicator for basic indicators included in the standard package of the MetaTrader 4 terminal. It is used for the analysis of price movements and market mood. The market mood is judged by the slope of the linear regression and price being below or above this line. Regression line breakthrough by the indicator line may serve as a market entry signal. There is possibility of setting the color for bullish and bearish sentiments of the basic indicators as well as plottin
PM Redefine
Samuel Akinbowale
PM Redefine : Is Simply, Simple, Straight and Direct in opening orders and closing of orders; PM Redefine : Can be run in all type of instrument.{Forex, Commodity ,Stock, or Cryptocurrencies}. PM Redefine : Can be run in all type of TimeFrame,{M1,M5,M15,M30 , H60, H240, D, W, M}. PM Redefine : can be used for scalping and day trading. Input Parameters typeFrom_0_to_9: type in between 0 and 9 ; upper_levelAlert: if line cross this predefine level up , Arrow Buy show if : showArrow =true: lo
Super volumes
Yerzhan Satov
4 (1)
Der Pfeilindikator für Forex und Binäre Optionen basiert auf Tick-Volumina. Im Gegensatz zu vielen Volumenindikatoren berechnet der Indikator "Super volumes" bullische und bärische Volumina und gibt Signale für die Vorherrschaft von irgendwelchen von ihnen aus. Wenn wir zu diesem Zeitpunkt sagen, dass es in diesem Bereich einen Vorteil von bullischen Volumina gab, bedeutet dies, dass das Signal auf Buy liegt. Oder wenn das Vorherrschen bärische Volumina war, wird das Signal dementsprechend auf
Virtual Exchange Reserve Equity Monitor In an environment where exchanges offer increasingly high leverage ratios, it is all the more important for traders to tightly regulate their level of equity .  This software is designed to be run in the background on any virtual private server that can run Meta Trader 4/5.  It implements basic equity control functions ahead of the broker---allowing users to set their own equity trailing stop, an equity limit to lock-in a certain profit margin, and a unive
FREE
Der Boom and Crash Spike Detector Indikator ist basierend auf einer fortschrittlichen Strategie kodiert, hauptsächlich um den Boom und Crash in den Preisen zu erkennen. Komplexe Algorithmen wurden implantiert, um Booms und Crashs mit hoher Wahrscheinlichkeit in den Preisen zu erkennen. Es warnt vor möglichen Boom- oder Crash-Phasen: Boom-Phase: Wenn der Preis zu schnell steigt. Crash-Phase: Wenn der Preis zu schnell sinkt. ZEITLICH BEGRENZTES ANGEBOT: Der Indikator ist für nur 30$ und lebens
Der Indikator berechnet Delta, die Differenz im Tick-Volumen zwischen Käufern und Verkäufern. Zeigt das Ungleichgewicht von Marktkäufen und -verkäufen an.  Das Delta-Ungleichgewicht ist eine spezielle Darstellungsart, die auf dem Verhältnis von Angebots- und Nachfragevolumen basiert Mithilfe des Indikators im realen Handelsmodus können Sie das Stimmungsverhalten großer Marktteilnehmer beobachten und so visuell erkennen, wer derzeit den Preis kontrolliert und die weitere Kontrolle behält.
Forex Indicator HTF MACD Oscillator for MT4 HTF means -   H igher Time Frame MACD   indicator itself is one of the most popular indicators for trend trading This indicator is excellent for   Multi-Time Frame trading systems   with Price Action entries   or in combination with other indicators HTF  MACD Indicator allows you to   attach    MACD  from Higher time frame to your current chart     --> this is   professional trading approach Indicator has built-in Mobile and PC alerts  // More great Ex
Introducing "TG Trade Service Manager" — your all-in-one solution for seamless trade management in both MQL4 and MQL5 environments. With a focus on speed, reliability, and convenience, this powerful library simplifies the complexities of trade execution and management, empowering developers with a single interface for enhanced efficiency. Metatrader5 Version |  All Products  |  Contact Key Features: Unified Interface : TG Trade Service Manager" provides a unified interface for   MQL4   and  
Candle finder robot MT4 Candle finder robot is one of the trading assistant tools that helps the trader, this tool helps the trader to examine all the currency pairs that are in the Metatrader watch list in detail within a few seconds. Find the desired signals. According to the strategy that is defined for this robot, in your watch list, it carefully looks for trend change candles, there are many trend change candles that traders use in their trading decisions. This robot can simply check all
Forex Market Profile (kurz FMP) Wenn Sie dies lieber in einem Live-Chart sehen möchten, anstatt die Beschreibung zu lesen, können Sie hier sofort eine kostenlose Demo herunterladen. Was das nicht ist: FMP ist nicht die klassische buchstabencodierte TPO-Anzeige , zeigt nicht die Berechnung des gesamten Diagrammdatenprofils an und segmentiert das Diagramm nicht in Perioden und berechnet diese nicht. Was es macht : Am wichtigsten ist, dass der FMP-Indikator Daten verarbeitet, die sich zwis
FREE
Every indicator has its advantages and disadvantages. Trending ones show good signals during a trend, but lag during a flat. Flat ones thrive in the flat, but die off as soon as a trend comes. All this would not be a problem, if it was easy to predict when a flat changes to a trend and when a trend changes to a flat, but in practice it is an extremely serious task. What if you develop such an algorithm, which could eliminate an indicator's flaws and enhance its strengths? What if such an algori
Der R Alligator Indikator wurde von Bill Williams eingeführt, er folgt dem Trend mit Hilfe von 3 geglätteten gleitenden Durchschnitten. Standardmäßig werden die folgenden Werte verwendet: Der geglättete gleitende Durchschnitt über 13 Perioden (bekannt als Jaw) Der geglättete gleitende Durchschnitt über 8 Perioden (bekannt als die Zähne) Der geglättete gleitende Durchschnitt über 5 Perioden (bekannt als Lips) Der R Alligator Indikator reduziert die Anzahl der falschen Trend Trades durch die
Unlimited Trade Copier Pro is a tool to copy trade remotely to multiple MT4, MT5 and cTrader accounts at different computers/locations over internet. This is an ideal solution for you if you are a signal provider and want to copy your trades to other receivers globally on your own rules. One provider can copy trades to multiple receivers and one receiver can get trade from multiple providers as well. The provider can even set the subscription expiry for each receiver, so that receiver will not b
I Permanent
Vladimir Gorbachev
Universal adaptable indicator. It determines the estimated trading range for the current day based on the available history a real data, and displays the area of the probable price rollback on the chart. All this thanks to the built-in algorithm that automatically adapts to any behavior models of the market quotes. With the parameters adjusted, the indicator shows its effectiveness on most of the currency pairs, that have a rollback from the reached extremums during the current or the next tradi
Praetor EA
Sergei Ozerov
Praetor EA   PRAETOR   is a moderately secure trading system based on a clustering model of trading patterns. It consists of many simple functions and has many parameters that allow you to memorize various market situations and interpret them correctly. The advisor opens one deal in a certain direction and places       Stop Loss       and       Take Profit   , and when a certain profit is reached, the advisor uses       Trailing Stop   . The signals of the model are based on such indicators as
Magic Balance
Daniil Evstratenko
The indicator shows which trading pairs, strategies, robots and signals that you use are profitable and which are not. The statistic of trades and balance graph are displayed in the account currency and pips - to switch simply click on the graph. button "$"(top left) - minimize/expand and move the indicator panel button ">"(bottom right) - stretching and resetting to the original size Statistic of trades 1 line - account balance, current profit and lot of open trades; 2 line - the number of al
Hi! Between the given time range. Adds profit and lot. This can be written on the charter in English and Hungarian. The name of the symbol must be entered exactly. Good used for it. :) Szia! A meg adott idősáv között Összeadja a profitot és lot-ot. Ezt ki írathatjuk Angolul és Magyarul a chartra. Pontosan kell beírni a szimbólum nevét. Jó használatott hozzá. :)
Laguerre SuperTrend Clouds adds an Adaptive Laguerre averaging algorithm and alerts to the widely popular SuperTrend indicator. As the name suggests, Laguerre SuperTrend Clouds (LSC) is a trending indicator which works best in trendy (not choppy) markets. The SuperTrend is an extremely popular indicator for intraday and daily trading, and can be used on any timeframe. Incorporating Laguerre's equation to this can facilitate more robust trend detection and smoother filters. The LSC uses the impro
CHF Portal
Ngo Yung Lau
CHF Portal is designed for Trading USDCHF specifically. Trading Concept The operation concept of CHF Portal is based on an algorithm which tries to determine the Trend. To be more specific, CHF Portal works with its own calculation logic according to historical volatility and price movement. It is trying to find out the Top or Bottom in a Trend, and open the Short or Long Position accordingly. Don't expect CHF Portal can be able to open the trade on the highest or lowest level, because CHF Por
Käufer dieses Produkts erwarben auch
Gann Made Easy
Oleg Rodin
4.93 (73)
Gann Made Easy ist ein professionelles und einfach zu bedienendes Forex-Handelssystem, das auf den besten Handelsprinzipien unter Verwendung der Theorie von Mr. basiert. W.D. Gann. Der Indikator liefert genaue KAUF- und VERKAUFSsignale, einschließlich Stop-Loss- und Take-Profit-Levels. Mit PUSH-Benachrichtigungen können Sie auch unterwegs handeln. Bitte kontaktieren Sie mich nach dem Kauf! Ich werde meine Handelstipps und tolle Bonusindikatoren kostenlos mit Ihnen teilen! Wahrscheinlich haben Si
Trend Punch
Mohamed Hassan
5 (10)
Manual guide:   Click here PROMO of  $79 for 2 copies left!  -- Next price is  $149 .  This indicator is unstoppable when combined with our other indicator called  Support & Resistance . After purchase, send us a message and you will get it   for  FREE as a BONUS! I like to use Trend Punch on XAUUSD & BTCUSD on the M1 timeframe!  Introducing Trend Punch , the revolutionary forex trend indicator that will transform the way you trade! Trend Punch is uniquely designed to provide preci
DERZEIT 26% RABATT Die beste Lösung für jeden Newbie oder Expert Trader! Dieser Indikator ist ein einzigartiges, qualitativ hochwertiges und erschwingliches Trading-Tool, da wir eine Reihe von proprietären Funktionen und eine neue Formel integriert haben. Mit nur EINEM Chart können Sie die Währungsstärke für 28 Forex-Paare ablesen! Stellen Sie sich vor, wie sich Ihr Handel verbessern wird, weil Sie in der Lage sind, den genauen Auslösungspunkt eines neuen Trends oder einer Scalping-Gelegenh
Werden Sie Breaker Trader und profitieren Sie von Änderungen der Marktstruktur, wenn sich der Preis umkehrt. Der Order Block Breaker Indikator zeigt an, wann sich eine Trend- oder Preisbewegung der Erschöpfung nähert und bereit ist, sich umzukehren. Es weist Sie auf Änderungen in der Marktstruktur hin, die normalerweise auftreten, wenn eine Umkehrung oder ein größerer Rückzug bevorsteht. Der Indikator verwendet eine proprietäre Berechnung, die Ausbrüche und Preisdynamik identifiziert. Jedes
Atomic Analyst
Issam Kassas
5 (3)
Zunächst einmal ist es erwähnenswert, dass dieser Handelsindikator nicht neu malt, nicht neu zeichnet und keine Verzögerung aufweist, was ihn sowohl für manuellen als auch für Roboterhandel ideal macht. Benutzerhandbuch: Einstellungen, Eingaben und Strategie. Der Atom-Analyst ist ein PA-Preisaktionsindikator, der die Stärke und das Momentum des Preises nutzt, um einen besseren Vorteil auf dem Markt zu finden. Ausgestattet mit fortschrittlichen Filtern, die helfen, Rauschen und falsche Signale z
TPSpro RFI Levels
Roman Podpora
4.83 (18)
Reversal First Impulse levels (RFI)    INSTRUCTIONS        RUS       -       ENG              R ecommended to use with an indicator   -   TREND PRO -  Version MT5 A key element in trading is zones or levels from which decisions to buy or sell a trading instrument are made. Despite attempts by major players to conceal their presence in the market, they inevitably leave traces. Our task was to learn how to identify these traces and interpret them correctly. Main functions: Displaying active zones
Scalper Inside PRO
Alexey Minkov
4.74 (58)
An exclusive indicator that utilizes an innovative algorithm to swiftly and accurately determine the market trend. The indicator automatically calculates opening, closing, and profit levels, providing detailed trading statistics. With these features, you can choose the most appropriate trading instrument for the current market conditions. Additionally, you can easily integrate your own arrow indicators into Scalper Inside Pro to quickly evaluate their statistics and profitability. Scalper Inside
Advanced Supply Demand
Bernhard Schweigert
4.92 (312)
Derzeit 33% Rabatt! Die beste Lösung für jeden Anfänger oder erfahrenen Händler! Dieser Indikator ist ein einzigartiges, qualitativ hochwertiges und erschwingliches Trading-Tool, da wir eine Reihe von proprietären Funktionen und eine neue Formel integriert haben. Mit diesem Update werden Sie in der Lage sein, doppelte Zeitrahmenzonen anzuzeigen. Sie können nicht nur einen höheren TF (Zeitrahmen) anzeigen, sondern sowohl den Chart-TF als auch den höheren TF: SHOWING NESTED ZONES. Alle Supply Dema
Derzeit 20% Rabatt! Die beste Lösung für jeden Neueinsteiger oder Expert Händler! Dieses Dashboard arbeitet mit 28 Währungspaaren. Es basiert auf 2 unserer Hauptindikatoren (Advanced Currency Strength 28 und Advanced Currency Impulse). Es bietet einen hervorragenden Überblick über den gesamten Forex-Markt. Es zeigt die Werte der Advanced Currency Strength, die Veränderungsrate der Währungen und die Signale für 28 Devisenpaare in allen (9) Zeitrahmen. Stellen Sie sich vor, wie sich Ihr Hande
Legacy of Gann
Pavel Zamoshnikov
4.83 (12)
The indicator very accurately determines the levels of the possible end of the trend and profit fixing. The method of determining levels is based on the ideas of W.D.Gann, using an algorithm developed by his follower Kirill Borovsky. Extremely high reliability of reaching levels (according to K. Borovsky  - 80-90%) Indispensable for any trading strategy – every trader needs to determine the exit point from the market! Precisely determines targets on any timeframes and any instruments (forex, met
TPSproTREND PrO
Roman Podpora
4.78 (18)
TPSpro TRENDPRO  - is a trend indicator that automatically analyzes the market and provides information about the trend and each of its changes, as well as giving signals for entering trades without redrawing! The indicator uses each candle, analyzing them separately. referring to different impulses - up or down impulse. Exact entry points into transactions for currencies, crypto, metals, stocks, indices!  -  Version MT5               DETAILED DESCRIPTION                R ecommended to use with
FX Power MT4 NG
Daniel Stein
5 (10)
Erhalten Sie Ihr tägliches Marktupdate mit Details und Screenshots über unser Morning Briefing hier auf mql5 und auf Telegram ! FX Power MT4 NG ist die nächste Generation unseres langjährig sehr beliebten Währungsstärkemessers FX Power. Und was bietet dieser Stärkezähler der nächsten Generation? Alles, was Sie am ursprünglichen FX Power geliebt haben PLUS GOLD/XAU-Stärkeanalyse Noch präzisere Berechnungsergebnisse Individuell konfigurierbare Analysezeiträume Anpassbares Berechnungslimit für noc
Entdecken Sie das Geheimnis des erfolgreichen Forex -Handels mit unserem benutzerdefinierten MT4 -Indikator! Haben Sie sich jemals gefragt, wie Sie Erfolg auf dem Forex -Markt erzielen können und gleichzeitig Gewinne erzielen und gleichzeitig das Risiko minimieren können? Hier ist die Antwort, nach der Sie gesucht haben! Erlauben Sie uns, unseren proprietären MT4 -Indikator vorzustellen, der Ihren Handelsansatz revolutionieren wird. Einzigartige Vielseitigkeit Unser Indikator ist speziell
Currency Strength Wizard ist ein sehr leistungsstarker Indikator, der Ihnen eine Komplettlösung für erfolgreichen Handel bietet. Der Indikator berechnet die Stärke dieses oder jenes Forex-Paares anhand der Daten aller Währungen in mehreren Zeitrahmen. Diese Daten werden in Form von benutzerfreundlichen Währungsindizes und Währungsstärkelinien dargestellt, anhand derer Sie die Stärke dieser oder jener Währung erkennen können. Sie müssen lediglich den Indikator an das Diagramm anhängen, mit dem Si
Gold Stuff
Vasiliy Strukov
4.89 (259)
Gold Stuff-Ein Trendindikator, der speziell für Gold entwickelt wurde, kann auch auf allen Finanzinstrumenten verwendet werden. Der Indikator wird nicht neu gezeichnet und verzögert sich nicht. Empfohlener Zeitrahmen H1. Nach diesem Indikator geschrieben EA Gold Stuff Berater, können Sie es in meinem Profil finden. WICHTIG! Kontaktieren Sie mich sofort nach dem Kauf, um Anweisungen und Bonus zu erhalten!   Sie können eine kostenlose Kopie unseres Strong Support- und Trendscanner-Indikators
Auto Order Block with break of structure based on ICT and Smart Money Concepts (SMC) Futures Break of Structure ( BoS )             Order block ( OB )            Higher time frame Order block / Point of Interest ( POI )    shown on current chart           Fair value Gap ( FVG ) / Imbalance   -  MTF      ( Multi Time Frame )    HH/LL/HL/LH  -  MTF      ( Multi Time Frame )  Choch  MTF      ( Multi Time Frame )  Volume Imbalance     ,  MTF          vIMB Gap’s Power of 3 Equal High
Zunächst einmal ist es wichtig zu betonen, dass dieses Handelstool ein Nicht-Repaint-, Nicht-Redraw- und Nicht-Verzögerungsindikator ist, was es ideal für professionelles Trading macht. Online-Kurs, Benutzerhandbuch und Demo. Der Smart Price Action Concepts Indikator ist ein sehr leistungsstarkes Werkzeug sowohl für neue als auch erfahrene Händler. Er vereint mehr als 20 nützliche Indikatoren in einem und kombiniert fortgeschrittene Handelsideen wie die Analyse des Inner Circle Traders und Stra
Trend Screener
STE S.S.COMPANY
4.83 (88)
Trendindikator, bahnbrechende, einzigartige Lösung für Trendhandel und -filterung mit allen wichtigen Trendfunktionen in einem Tool! Es handelt sich um einen 100 % nicht neu zu malenden Multi-Timeframe- und Multi-Währungs-Indikator, der für alle Symbole/Instrumente verwendet werden kann: Forex, Rohstoffe, Kryptowährungen, Indizes und Aktien. Trend Screener ist ein effizienter Trendfolgeindikator, der Pfeiltrendsignale mit Punkten im Diagramm liefert. Die Funktionen, die im Trendanalysator-Indika
Volatility Trend System – ein Handelssystem, das Signale für Einstiege gibt. Das Volatilitätssystem liefert lineare und punktuelle Signale in Richtung des Trends sowie Signale zum Verlassen des Trends, ohne Neuzeichnung und Verzögerungen. Der Trendindikator überwacht die Richtung des mittelfristigen Trends, zeigt die Richtung und deren Änderung an. Der Signalindikator basiert auf Änderungen der Volatilität und zeigt Markteintritte an. Der Indikator ist mit mehreren Arten von Warnungen ausgest
ICT, SMC, SMART MONEY CONCEPTS, SMART MONEY, Smart Money Concept, Support and Resistance, Trend Analysis, Price Action, Market Structure, Order Blocks, BOS/CHoCH,   Breaker Blocks ,  Momentum Shift,   Supply&Demand Zone/Order Blocks , Strong Imbalance, HH/LL/HL/LH,    Fair Value Gap, FVG,  Premium  &   Discount   Zones, Fibonacci Retracement, OTE, Buy Side Liquidity, Sell Side Liquidity, BSL/SSL Taken, Equal Highs & Lows, MTF Dashboard, Multiple Time Frame, BigBar, HTF OB, HTF Market Structure, 
TakePropips Donchian Trend Pro
Eric John Pajarillaga Aldana
4.82 (17)
TakePropips Donchian Trend Pro   (MT4) ist ein leistungsstarkes und effektives Tool, das mithilfe des Donchian-Kanals automatisch die Richtung des Trends erkennt und Ihnen Handelssignale für den Ein- und Ausstieg liefert! Dieser Multifunktionsindikator umfasst einen Trendscanner, Handelssignale, ein statistisches Panel, einen Screener, Handelssitzungen und ein Dashboard für den Verlauf von Warnungen. Es wurde entwickelt, um Ihnen Handelssignale zu liefern und Ihnen Stunden beim Analysieren der C
M1 Arrow
Oleg Rodin
5 (14)
Eine Intraday-Strategie, die auf zwei Grundprinzipien des Marktes basiert. Der Algorithmus basiert auf der Analyse von Volumina und Preiswellen mit zusätzlichen Filtern. Der intelligente Algorithmus des Indikators gibt nur dann ein Signal, wenn sich zwei Marktfaktoren zu einem vereinen. Der Indikator berechnet Wellen eines bestimmten Bereichs auf dem M1-Diagramm unter Verwendung der Daten des höheren Zeitrahmens. Und um die Welle zu bestätigen, verwendet der Indikator eine Volumenanalyse. Dieser
NAM Order Blocks
NAM TECH GROUP, CORP.
5 (1)
MT4-Erkennungsanzeige für Auftragsblöcke mit mehreren Zeitrahmen. Eigenschaften - Vollständig anpassbar auf dem Diagrammbedienfeld, bietet vollständige Interaktion. - Verstecken und zeigen Sie das Bedienfeld, wo immer Sie möchten. - Erkennen Sie OBs in mehreren Zeiträumen. - Wählen Sie die anzuzeigende OB-Menge aus. - Verschiedene OBs Benutzeroberfläche. - Verschiedene Filter an OBs. - OB-Näherungsalarm. - ADR High- und Low-Leitungen. - Benachrichtigungsdienst (Bildschirmwar
FX Volume
Daniel Stein
4.6 (35)
Erhalten Sie Ihr tägliches Marktupdate mit Details und Screenshots über unser Morning Briefing hier auf mql5 und auf Telegram ! FX Volume ist der ERSTE und EINZIGE Volumenindikator, der einen ECHTEN Einblick in die Marktstimmung aus Sicht eines Brokers bietet. Es bietet fantastische Einblicke in die Positionierung von institutionellen Marktteilnehmern, wie z.B. Brokern, auf dem Forex-Markt, viel schneller als COT-Berichte. Diese Informationen direkt auf Ihrem Chart zu sehen, ist der wahre Game
BullsEye Signal NoRepaint
Martin Alejandro Bamonte
BullseyeSignal – NoRepaint ist ein Signal, das, wie der Name schon sagt, unter keinen Umständen neu gezeichnet wird. Das Signal wird auf der gleichen Kerze ausgegeben, die im Bild zu sehen ist. Es ist ideal für stark volatile Märkte wie Forex, Kryptowährungen, Aktien, Indizes und Futures. Sie werden nur einen grünen Pfeil für den Kauf und einen roten Pfeil für den Verkauf sehen, aber hinter ihnen arbeiten viele Indikatoren zusammen, um ein vereinfachtes Handelserlebnis zu bieten. Es ist speziell
Break and Retest
Mohamed Hassan
4.43 (14)
New update to V.4 where  Break & Retest automatically draws the take profit & stop loss levels and you also have more signals per day! ‍You can visually backtest Break & Retest to see how it behaved in the past!     Manual guide:   Click here $60 for a very limited time. Next price is $120   This Indicator only places quality trades when the market is really in your favor with a clear break and retest. Patience is key with this price action strategy! If you want more alert s
PRO Renko System ist ein hochpräzises Handelssystem, das speziell für den Handel mit RENKO-Charts entwickelt wurde. Dies ist ein universelles System, das auf verschiedene Handelsinstrumente angewendet werden kann. Das System neutralisiert effektiv so genannte Marktgeräusche, die Ihnen Zugang zu genauen Umkehrsignalen geben. Der Indikator ist sehr einfach zu bedienen und hat nur einen Parameter, der für die Signalerzeugung verantwortlich ist. Sie können das Tool einfach an jedes Handelsinstr
DERZEIT 31% RABATT! Die beste Lösung für jeden Newbie oder Expert Trader! Dieser Indikator ist ein einzigartiges, qualitativ hochwertiges und erschwingliches Handelsinstrument, da wir eine Reihe von proprietären Funktionen und eine geheime Formel eingebaut haben. Mit nur EINEM Chart liefert er Alerts für alle 28 Währungspaare. Stellen Sie sich vor, wie sich Ihr Handel verbessern wird, weil Sie in der Lage sind, den genauen Auslösepunkt eines neuen Trends oder einer Scalping-Gelegenheit zu e
Scalper Vault
Oleg Rodin
5 (29)
Scalper Vault ist ein professionelles Scalping-System, das Ihnen alles bietet, was Sie für erfolgreiches Scalping benötigen. Dieser Indikator ist ein komplettes Handelssystem, das von Forex- und Binäroptionshändlern verwendet werden kann. Der empfohlene Zeitrahmen ist M5. Das System liefert Ihnen genaue Pfeilsignale in Richtung des Trends. Es liefert Ihnen auch Top- und Bottom-Signale und Gann-Marktniveaus. Die Indikatoren bieten alle Arten von Warnungen, einschließlich PUSH-Benachrichtigungen.
Der ADR-Umkehrindikator zeigt Ihnen auf einen Blick, wo der Preis derzeit im Verhältnis zu seiner normalen durchschnittlichen Tagesspanne gehandelt wird. Sie erhalten sofortige Benachrichtigungen per Pop-up, E-Mail oder Push, wenn der Preis seine durchschnittliche Spanne und darüber liegende Niveaus Ihrer Wahl überschreitet, sodass Sie schnell in Pullbacks und Umkehrungen einsteigen können. Der Indikator zeichnet horizontale Linien auf dem Chart an den durchschnittlichen täglichen Range-Extreme
Weitere Produkte dieses Autors
Forex Flow Equalizer is an indicator that helps to reduce 'noise' in forex price movements. Visit https://www.mql5.com/en/blogs/post/751167 for more detailed explanation. It is programmed to enhance traders' focus, and capacity to monitor or manage multiple instruments of interest on preferred timeframe without their minds being over loaded with data or information, thereby, saving them the mental strength for more important trading decision making. Range Mode: is for traders who like to trade
Auswahl:
Keine Bewertungen
Antwort auf eine Rezension
Version 2.0 2021.11.28
Changes that improve the workings and also makes the application more interactive have been made is areas such as:

1. Indicator Parameters:
(a) Two parameters - "Date Time Seek" and "Seek Strength to the nearest" have replaced the former "ECBindex" parameter bringing two new improvements. Now instead of using candle shift to find out past state of strength information, all the trader needs is to simply enter a datetime string. Secondly, the trader can now track past state of strength information down to the nearest time by configuring the "Seek Strength to the nearest" parameter.
(b) Another parameter "Hide Graph and Number data" enables trader to collapse the interface to display less information, please check this out.

2. The Interface:
(a) The filter "LS" which stood for LAST versus STAT (or end of LAST period state of strength data versus beginning of new period state of strength data) has become more current (or dynamic) in its operation. It is now "LR" standing for LAST versus REAL, comparing end of LAST period with current or real time data. The change improves forecast, it is no longer a static prediction as "LS" was used to being.
(b) The above change also means that filter "F" will now report alignment of "LR", "SR" and "RR" while the more restrictive (than "F") filter "LSSRX" becomes "LRSRX". Remember "X" is more restrictive than "RR".
(c) ECB now displays its computed data without the need to click on button "Z" as was the case with earlier version. Therefore, at a glance, the trader can view this information. But once the interface is collapsed, the trader can still display the information by clicking the then visible "Z".
(d) Graphical representation of the data is a new feature for those traders who are more graphic oriented. For each currency the bars are arranged from top down as LR, SR and RR, representing the numbers within brackets ordered from left to right.
(e) Lastly, for the purpose of confirmation when the trader is viewing past state of strength information, the date at the top right corner has now being enlarged to show the hour and minutes. It used to simply read the date in the earlier version in which the trader was only able to back track information accurate to the size of the "Strength Computation Timeframe" parameter configuration.