BoxChart MT4
33 USD
Demo heruntergeladen:
1 943
Veröffentlicht:
17 September 2015
Aktuelle Version:
4.3
Keinen passenden Roboter gefunden?
Geben Sie Ihren Eigenen in Auftrag
auf Freelance!
Gehen Sie zu Freelance
Geben Sie Ihren Eigenen in Auftrag
auf Freelance!
Wie man einen Roboter oder Indikator kaufen kann
Starte Deinen EA im
Virtual Hosting
Virtual Hosting
Teste einen Indikator/Roboter vor dem Kauf
Möchtest Du Geld im Market verdienen?
Wie man Produkte richtig präsentiert
Sie verpassen Handelsmöglichkeiten:
- Freie Handelsapplikationen
- Über 8.000 Signale zum Kopieren
- Wirtschaftsnachrichten für die Lage an den Finanzmärkte
Registrierung
Einloggen
Sie stimmen der Website-Richtlinie und den Nutzungsbedingungen zu.
Wenn Sie kein Benutzerkonto haben, registrieren Sie sich
Как я понял, например пурпурный говорит о сильном скоплении и вероятном развороте?
Алгоритм такой: На графике, в его видимой части просмотра, всегда найдется некое самое максимальное скопление. Оно принимается за 100%, то есть за 8/8, поскольку у нас используется восемь градаций.
Цветовое соответствие переменных (скриншот): Box1Color - до 1/8, Box2Color - до 2/8, Box3Color - до 3/8, Box4Color - до 4/8, Box5Color - до 5/8, Box6Color - до 6/8, Box7Color - до 7/8, Box8Color - до 8/8 от максимального скопления в видимой области просмотра.
У пользователя есть возможность отключать, делать невидимой, любую из этих градаций, просто настроив её цвет, таким же, как цвет фона под графиком. То есть, в данном случае, белый - не отображается вообще, ну а пурпурный - это максимальное скопление, и вероятный разворот.
Скриншот сделан из версии 1.1, она буквально скоро заменит собой текущую версию 1.0.
Why is this the second Indicator I've had problems downloading in a week!
I know there is nothing wrong at my end.
I have enough money on my Mql account, but cannot download and pay for it.
There must be something wrong with the mql authentication protocol!
Уважаемый разработчик индикатора! Все здорово, но где же рекомендации и алгоритм торговли по данному индикатору?)
то что есть явно недостаточно ((((
managed to sort it!
:-)
Уважаемый разработчик индикатора! Все здорово, но где же рекомендации и алгоритм торговли по данному индикатору?)
то что есть явно недостаточно ((((
Александр, методикой торговли с помощью данного индикатора является общеизвестная VSA. Но не только анализ свечных паттернов (аптрасты и пр.), а анализ объёмов в комплексе - когда, сколько, на каком уровне. Индикатор этот не даёт никаких сигналов, он даёт нам поле для размышлений, для анализа, для понимания действий маркет-мейкера.
Посмотрите на картинку, ну разве не всё очевидно (стоп-лосс я уже придвинул, он был подальше). На этом уровне я получил стоп-лосс, но всё же зашёл повторно, потому что, ну очевидно и понятно, что цена пойдёт вверх.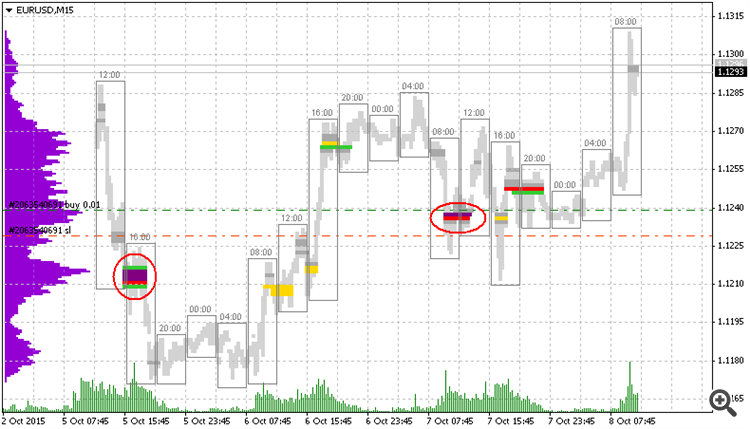
managed to sort it!
:-)
Скриншоты реальных сделок, последовательно, одна за другой, совершенных с помощью индикатора BoxChart.
Удачной торговли!!!
Made a mistake with my BSP and BSPP Numbers.
How do you reset them?
My chart is all messed up.
I tried removing the indicator and adding it again, but it appears to remember the original settings.
Is it possible for you make this work on a tick chart?
Thanks
Made a mistake with my BSP and BSPP Numbers.
How do you reset them?
My chart is all messed up.
I tried removing the indicator and adding it again, but it appears to remember the original settings.
Use the "Reset" button - the indicator will set the default settings. If not, then remove the indicator from the chart, then you need to clean the global variables - press button F3 on the keyboard, then in the terminal will open window with a list of global variables, you must remove all the variables have at the end of their name the letters "BC". For example, "gDBspBC" or for example "gDBsppBC", and all the others. Then set the indicator to the chart.
Description how to use BSP and BSPP are on the tab "What's new" in the paragraph "Version 1.8 from 2015.11.05".
So is this kind of along the same line as Volume footprint chart like MarketDelta ? Are you attempting to show the cluster imbalance same as you would on footprint charts ?
Not quite.
This indicator does not calculate the imbalance (or the delta).
This indicator calculate only the volume within each cluster, and sorts the clusters by color, depending on the contained volume.
In the description of the indicator is described in more detail how to do sorting.
Hello Dear developer bought the BoxChart indicator is an excellent tool is my first purchase to install on MT5 and I can not because I buy for MT4, MT5 would like to install.
Greetings.
Hello Dear developer bought the BoxChart indicator is an excellent tool is my first purchase to install on MT5 and I can not because I buy for MT4, MT5 would like to install.
Greetings.
The same exists indicator for MT5 - https://www.mql5.com/ru/market/product/11796 .
If I understand correctly your question?
El mismo existe indicador para MT5 - https://www.mql5.com/ru/market/product/11796.
Si he entendido bien su pregunta?
Hello, I think I did not explain properly, buy indicator for use in MT5 and I can not because I was wrong in buying. as I fix my first purchase if I can help in a solution?
Hello, I think I did not explain properly, buy indicator for use in MT5 and I can not because I was wrong in buying. as I fix my first purchase if I can help in a solution?
Now I understand. With this question you have to contact Service Desk. I think, they can help you.
А откуда индикатор берёт данные для вычисления объёма,открытого интереса ?
А откуда индикатор берёт данные для вычисления объёма,открытого интереса ?