Dashboard Multi Currency MTF Stochastic
- Indikatoren
- Anon Candra N
- Version: 1.10
- Aktualisiert: 29 April 2024
- Aktivierungen: 20
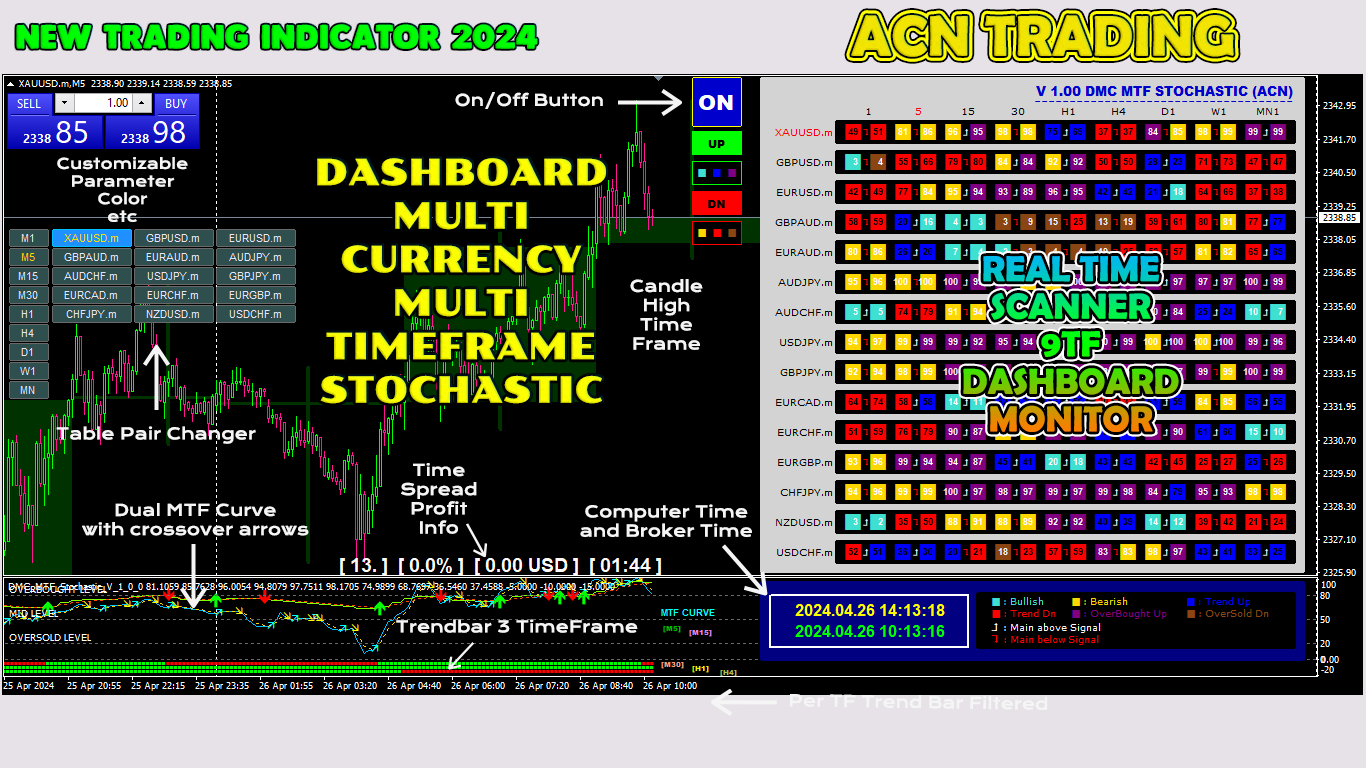
Mit diesem Handelstool können Sie 15 Märkte gleichzeitig scannen.
Einführung eines neuen Handelsindikators 2024:
➡️ Dashboard Multi-Währung Multi-Time-Frame Stochastic.
Es gibt mindestens zwei Gründe, warum ich dieses Handelstool entwickelt habe:
Erstens ist es mir langweilig, nur einen Markt zu beobachten.
Zweitens möchte ich den Einstieg in einen anderen Markt nicht verpassen.
Deshalb möchte ich gleichzeitig auch andere Marktbedingungen kennen.
Aus diesem Grund benötige ich einen Scanner, der die Konditionen mehrerer Märkte gleichzeitig scannen kann.
Ich suche oft nach Märkten, bei denen die stochastische Hauptlinie > (oder <=) stochastische Signallinie von M1 bis H4 (oder einfach von M1 bis M30) beginnt.
Wenn Sie meiner Analyse zustimmen, dann ist dies der Handelsindikator, nach dem Sie gesucht haben.
Verpassen Sie nicht den Moment, in dem die Marktbedingungen die oben genannten Anforderungen erfüllen.
Dies ist ein Scanner oder Dashboard von Stochastik mit vielen tollen Funktionen:
Kann die Daten der stochastischen Hauptlinie anzeigen
Kann die Daten der stochastischen Signalleitung anzeigen
Kann die Position der stochastischen Hauptlinie und der Signallinie anzeigen (Hauptlinie über der Signallinie oder Hauptlinie unter der Signallinie)
Kann das Datenniveau sowohl der stochastischen Hauptlinie als auch der Signallinie anzeigen (bullisch, bärisch, Aufwärtstrend, Abwärtstrend, überkauft, aber immer noch im Aufwärtstrend und überverkauft, aber immer noch im Abwärtstrend)
Kann Echtzeitdaten von M1 bis MN1 anzeigen
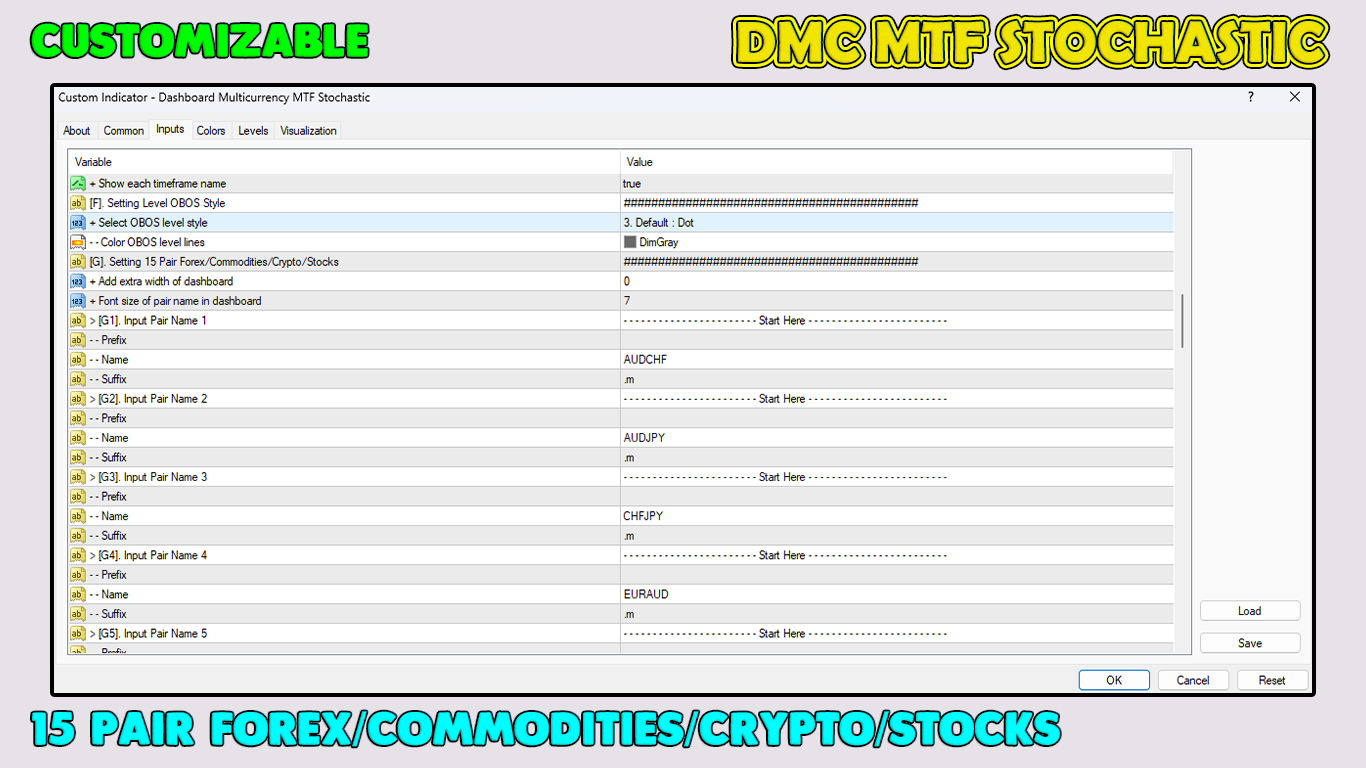
Kann die Daten von 15 Währungspaaren anzeigen (Mehrwährungs-Forex/Rohstoffe/Krypto/Aktien)
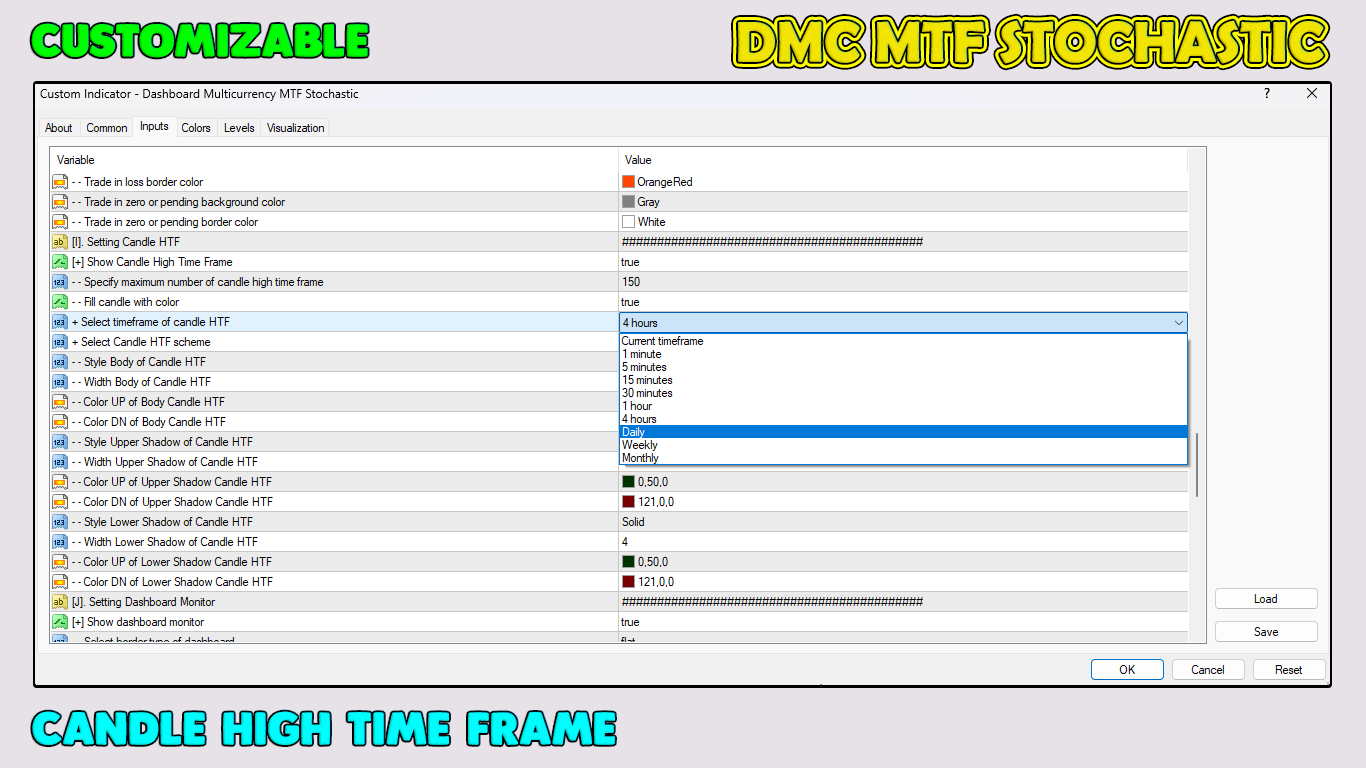
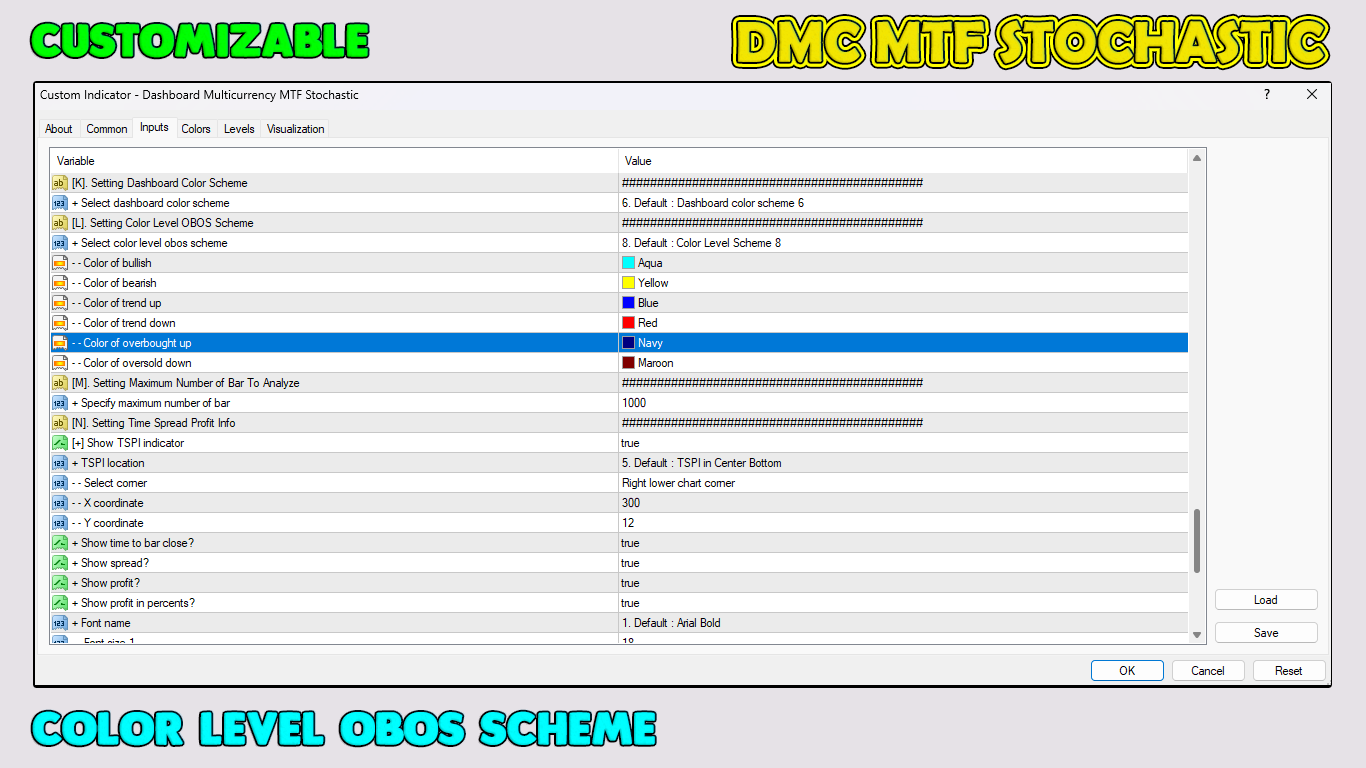
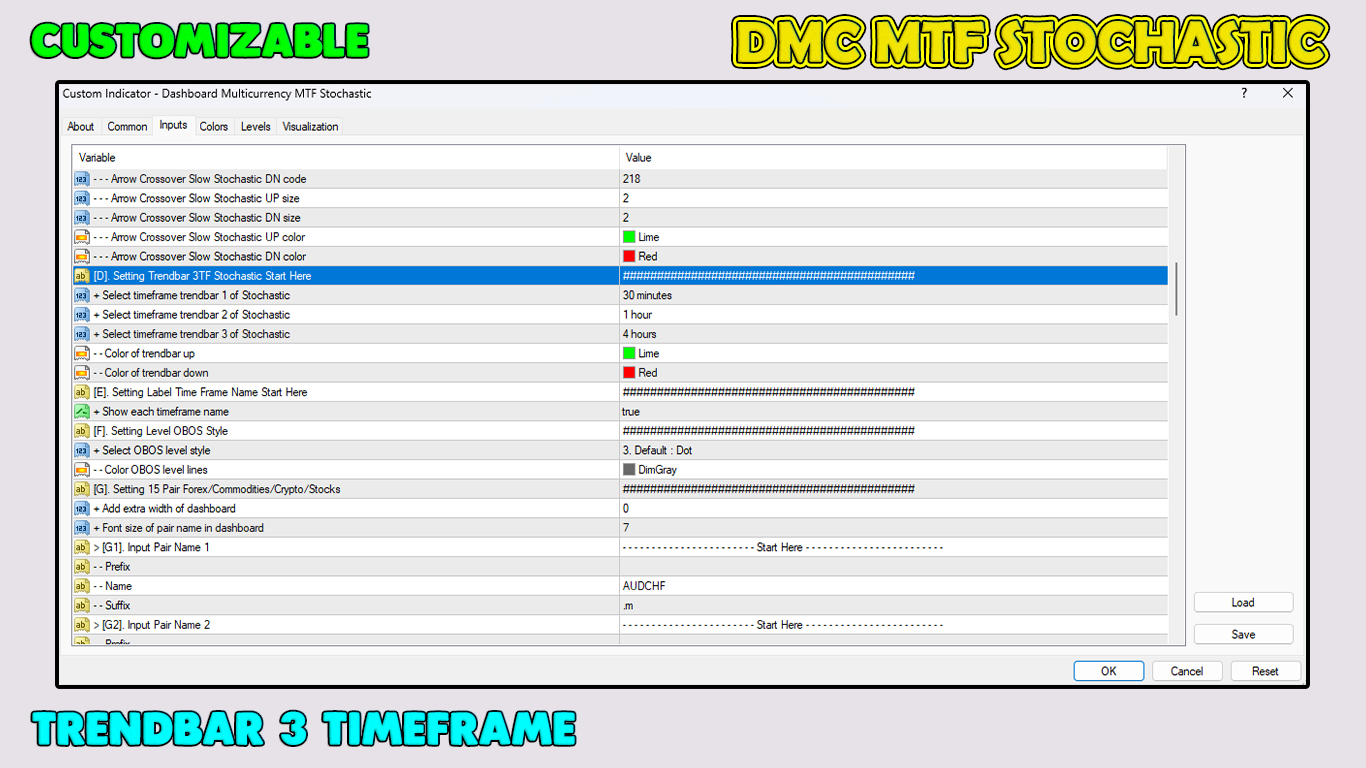
Anpassbarer Parameter
Anpassbare Farb-OBOS-Ebene
Wunderschönes 20-Dashboard-Farbschema
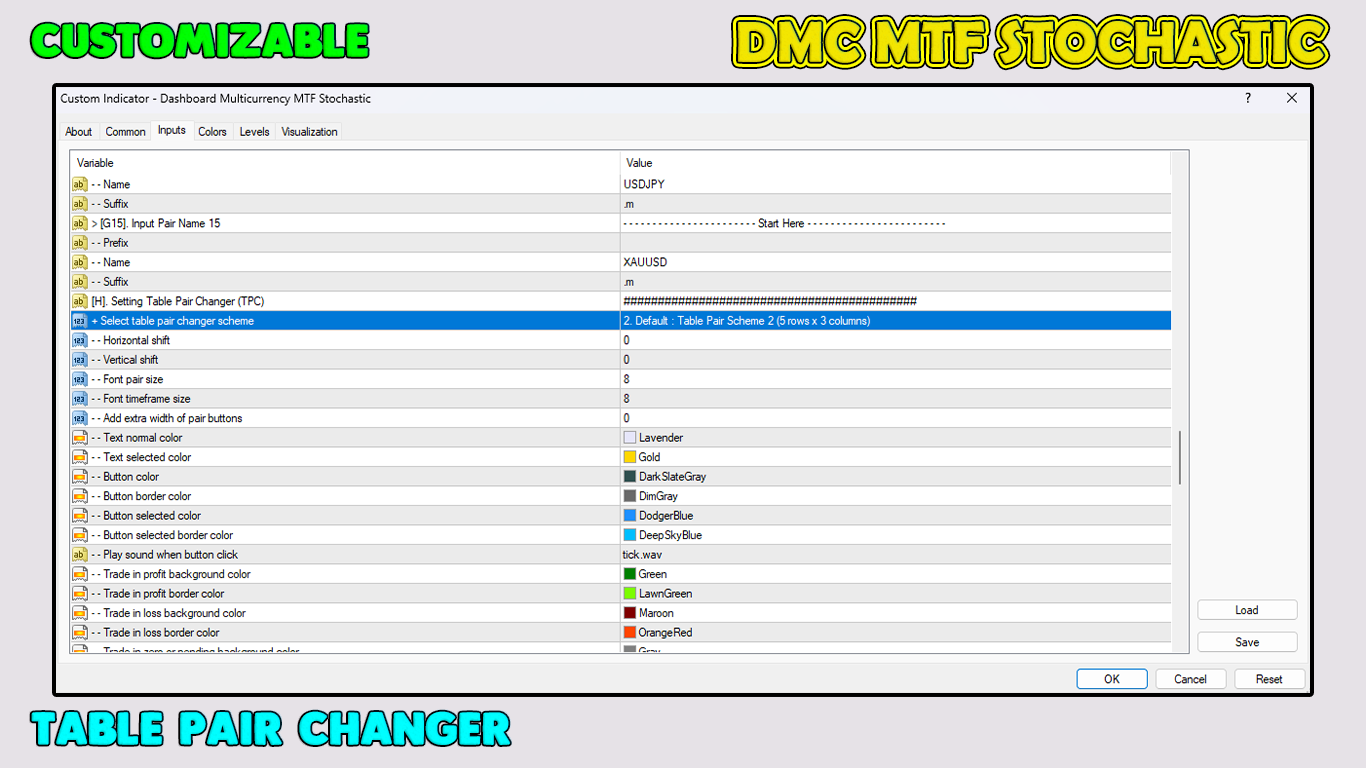
Ausgestattet mit einem Ein-/Aus-Währungspaarwechsler
Ausgestattet mit Kerzen-Hochzeitsrahmen
Ausgestattet mit Time-Spread-Gewinninformationen
Ausgestattet mit der aktuellen lokalen Computerzeit und Brokerzeit
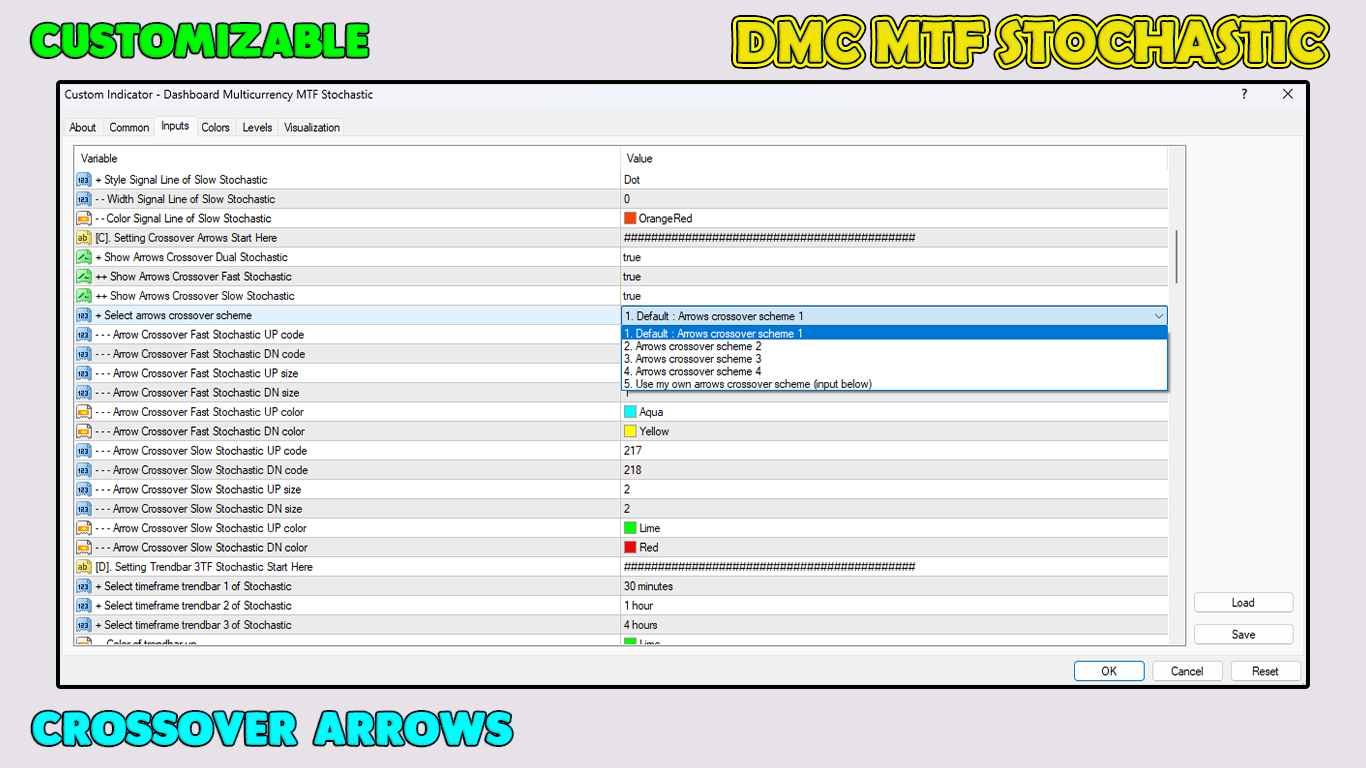
Ausgestattet mit einer dualen MTF-Stochastikkurve
Ausgestattet mit Crossover-Pfeilen der dualen MTF-Stochastikkurve
Ausgestattet mit Trendbar 3TF stochastisch
Dieses Handelstool ist absolut das, was jeder Händler braucht.
Laden Sie es noch heute herunter.
Machen Sie sichere Eingaben und handeln Sie wie ein Profi!
Danke schön.