• Übersicht
  • Bewertungen
  • Diskussion

Channel Mirosh

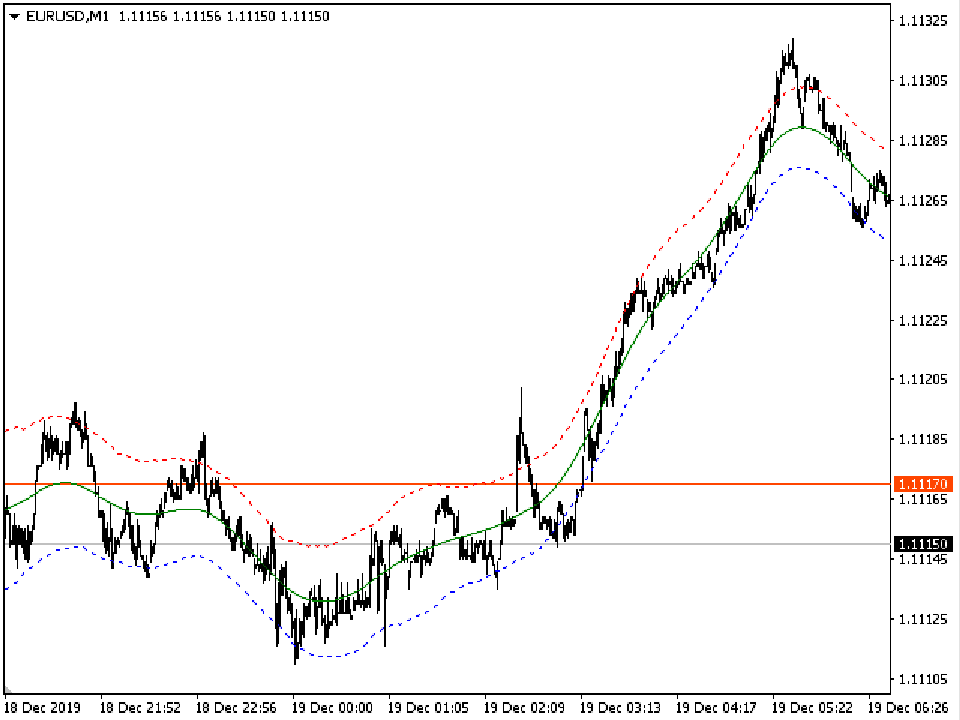
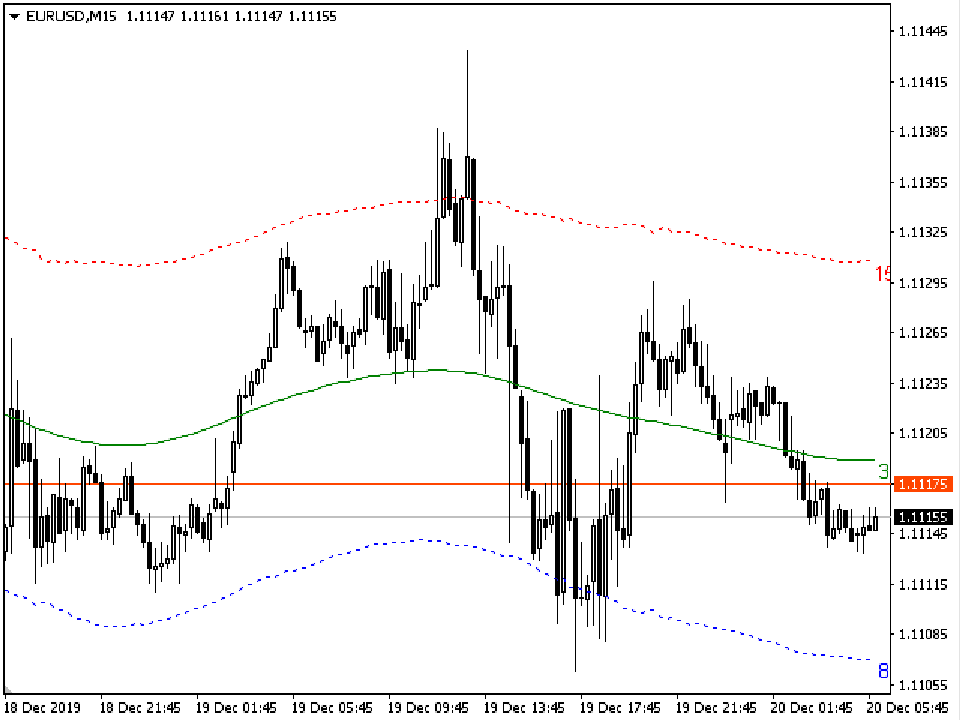
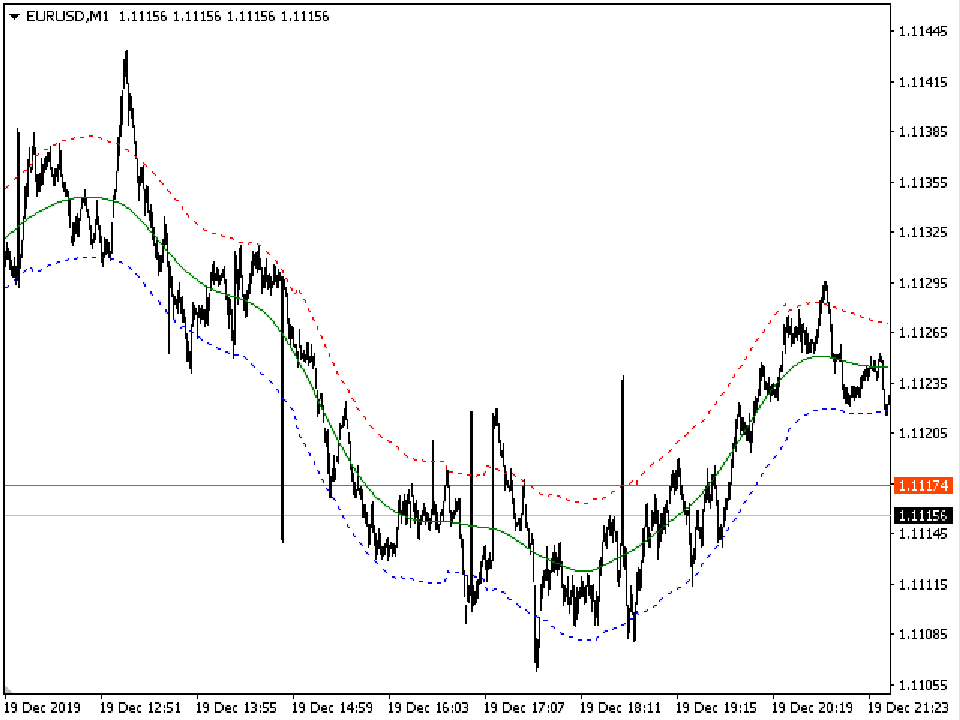
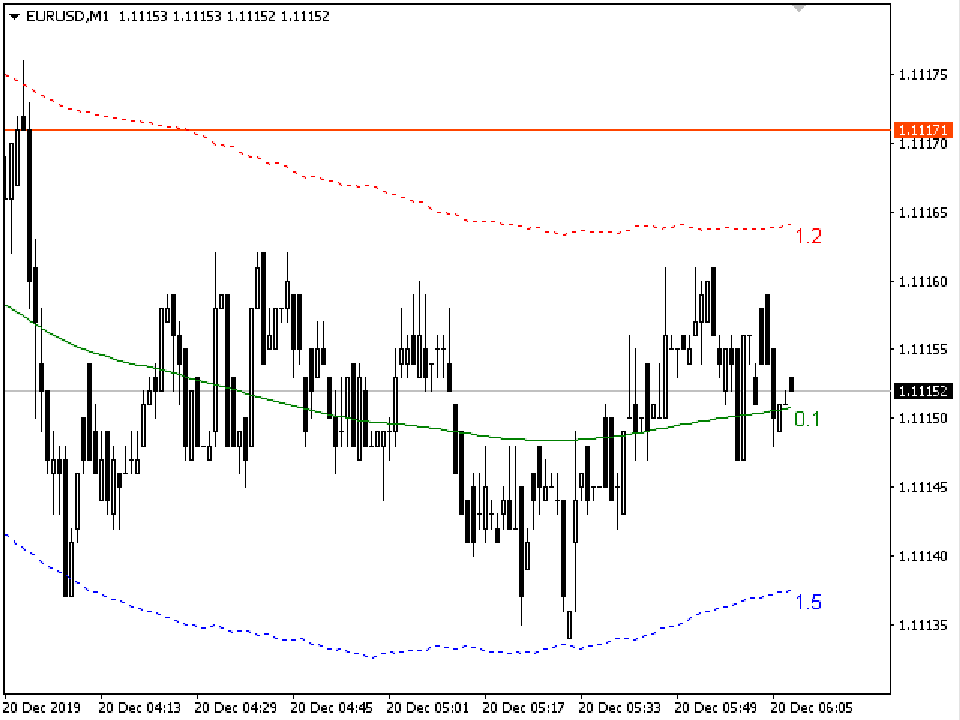
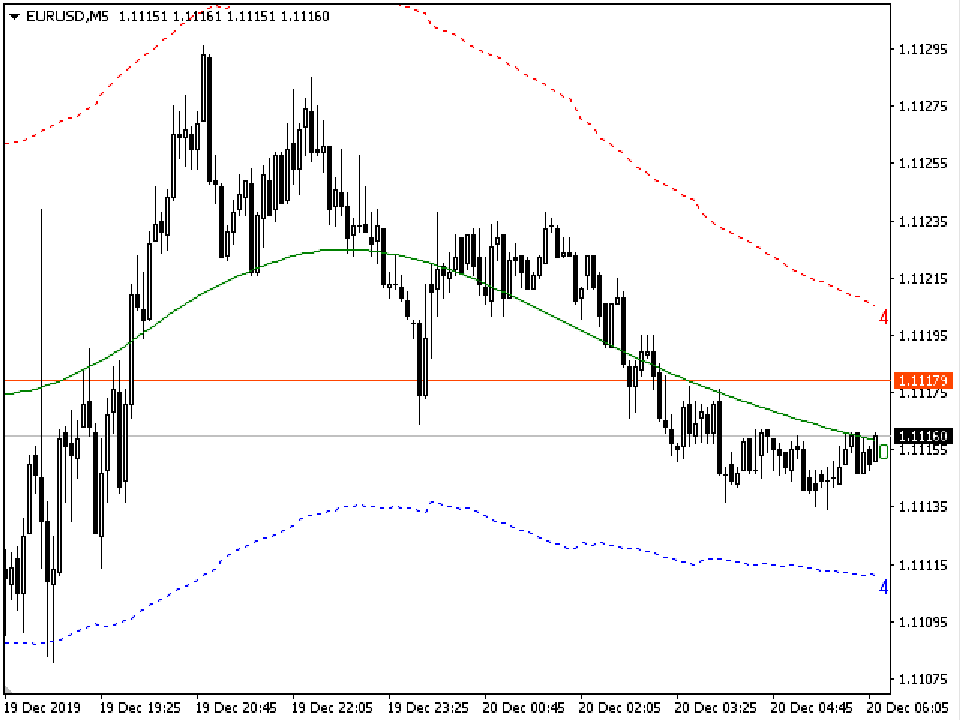
It is no secret that the movements of currency pairs for a certain part of the time occur in a certain price corridor, which is called a channel. The lower limit is considered the level of support, the upper one - resistance. Do not confuse with horizontal support and resistance levels! The distance between the support and resistance levels of a channel is called the range or channel width. The key difference between the Channel Mirosh indicator and other channel indicators (for example, from the same Bollinger) is that Channel Mirosh takes into account not simple moving averages, but twice smoothed ones, which, on the one hand, allows you to more clearly determine the market movement, and on the other side makes the indicator less sensitive. Channel Mirosh is a non-redrawing channel indicator based on moving averages.
Empfohlene Produkte
Die Struktur des Indikators.               Der Cunning Krokodil Indikator (Klug Krokodil) besteht aus drei gleitenden Durchschnitten (angewandt auf den Median Preis = (hoch + niedrig) / 2): 1) ein konventioneller MA ( SMA , EMA , SMMA ,   LWMA )  oder durchschnittlicher <X> Prozess X und zwei Verallgemeinerungen 2) <XF> = < X / <X >> * <X>   und  3) <XS> = <X * <X >> / <X>, aus der gleichen Mittelungsperiode.   Alle drei Kurven kreuzen sich an einzelnen Punkten, was (eine solche Kreuzung, in der
Indicator for binary options arrow is easy to use and does not require configuration works on all currency pairs, cryptocurrencies buy signal blue up arrow sell signal red down arrow tips do not trade during news and 15-30 minutes before their release, as the market is too volatile and there is a lot of noise it is worth entering trades one or two candles from the current period (recommended for 1 candle) timeframe up to m 15 recommended money management fixed lot or fixed percentage of the depo
LordAutoFibonnaci
Igor Pereira Calil
5 (1)
Lord Auto Fibonnaci is a free indicator for Meta Trader, in order to show the most famous chart in the financial market known as "Fibonnaci". As we can see in the images below, the fibonnaci table will automatically analyze the graph for you, with trend factors through percentage, almost infallible use, you can always work when the percentage is low or high, start shopping and sales on time, great for analyzing entries! In the images below we can see an example in gold in H4, where we are a
FREE
Market Structure Zig Zag
Lesedi Oliver Seilane
4.77 (22)
Free Market structure zig zag to assist in price action trading the screenshots describe how to use and how to spot patterns new version comes with alerts, email alert and  push notification alert can be used on all pairs  can be used on all timeframes  you can add additional confirmation indicators the indicator shows you your higher high and low highs as well as your lower lows and lower highs  the indication makes price action analysis easier to spot.
FREE
Forex Gump
Andrey Kozak
2.83 (6)
Forex Gump is a fully finished semi-automatic trading system. In the form of arrows, signals are displayed on the screen for opening and closing deals. All you need is to follow the instructions of the indicator. When the indicator shows a blue arrow, you need to open a buy order. When the indicator shows a red arrow, you need to open a sell order. Close orders when the indicator draws a yellow cross. In order to get the most effective result, we recommend using the timeframes H1, H4, D1. There
HMA Trend Professional MT4
Pavel Zamoshnikov
4.63 (8)
Improved version of the free HMA Trend indicator (for MetaTrader 4) with statistical analysis. HMA Trend is a trend indicator based on the Hull Moving Average (HMA) with two periods. HMA with a slow period identifies the trend, while HMA with a fast period determines the short-term movements and signals in the trend direction. The main differences from the free version: Ability to predict the probability of a trend reversal using analysis of history data. Plotting statistical charts for analyz
The indicator allows you to trade binary options. The recommended time frame is М1 and the expiration time is 1,2,3 minutes. The indicator suitable for auto and manual trading. A possible signal is specified as a arrows above/under a candle. You should wait until the candle closes! Arrows are not re-painted Trade sessions: TOKYO section (Half-end) Currency pairs: USD/JPY Working time frame: M1 Expiration time: 1,2,3 minutes. The indicator also shows good results when using the martingale strateg
FREE
Noize Absorption Index MT4
Ekaterina Saltykova
5 (1)
Noize Absorption Index - is the manual trading system that measures the difference of pressure between bears forces and bulls forces. Green line - is a noize free index that showing curent situation. Zero value of index shows totally choppy/flat market.Values above zero level shows how powerfull bullish wave is and values below zero measures bearish forces.Up arrow appears on bearish market when it's ready to reverse, dn arrow appears on weak bullish market, as a result of reverse expectation. S
RSX Signal 2 AM
Andriy Matviyevs'kyy
The indicator displays the signals of the RSX oscillator on the price chart. (To display these signals in a separate window, along with the oscillator, another indicator is used -  RSX Osc 4 AM ). It is optimal to use the indicator signals as signals to open a trade when the price overcomes the maximum or minimum of the bar at which the signal was given. An opposite signal cancels the previous signal. Settings: Data period for indicator calculation - data period for indicator calculation; Data
FREE
VR Cub
Vladimir Pastushak
VR Cub ist ein Indikator für den Erhalt hochwertiger Einstiegspunkte. Der Indikator wurde entwickelt, um mathematische Berechnungen zu erleichtern und die Suche nach Einstiegspunkten in eine Position zu vereinfachen. Die Handelsstrategie, für die der Indikator geschrieben wurde, hat sich seit vielen Jahren bewährt. Ihr großer Vorteil liegt in der Einfachheit der Handelsstrategie, die es auch unerfahrenen Händlern ermöglicht, erfolgreich damit zu handeln. VR Cub berechnet Positionseröffnungspunkt
ZhiBiCCI MT4
Qiuyang Zheng
5 (1)
[ZhiBiCCI] Indikatoren sind für alle Zyklusanwendungen und auch für alle Marktsorten geeignet. [ZhiBiCCI] Die grüne durchgezogene Linie ist eine Umkehrung der bullischen Divergenz. Die grüne gestrichelte Linie ist eine klassische bullische Divergenz. [ZhiBiCCI] Die durchgehende Linie zum Rot ist eine umgekehrte bearishe Divergenz. Die rote gepunktete Linie ist eine klassische bearishe Divergenz. [ZhiBiCCI] kann in den Parametern (Alert, Mail senden, Benachrichtigung senden) eingestellt wer
GTAS FibTdi
Riviera Systems
3.2 (5)
GTAS FidTdi is a trend indicator using combination of volatility and potential retracement levels. This indicator was created by Bernard Prats Desclaux, proprietary trader and ex-hedge fund manager, founder of E-Winvest. Description The indicator is represented as a red or green envelope above or under prices. How to use Trend detecting When the envelope is green, the trend is bullish. When it is red, the trend is bearish. Trading Once a trade is opened, GTAS FibTdi shows retracement zones
FREE
Owl smart levels
Sergey Ermolov
4.63 (54)
MT5-Version  |  FAQ Der   Owl Smart Levels Indikator   ist ein komplettes Handelssystem innerhalb eines Indikators, der so beliebte Marktanalysetools wie die   fortschrittlichen Fraktale von Bill Williams , Valable ZigZag, das die   richtige Wellenstruktur   des Marktes aufbaut, und   Fibonacci-Levels , die die genauen Einstiegslevels markieren, enthält in den Markt und Orte, um Gewinne mitzunehmen. Detaillierte Strategiebeschreibung Anleitung zur Verwendung des Indikators Berater-Assistent im
Sto Signal AM
Andriy Matviyevs'kyy
This indicator displays Stochastic osc signals on the price chart and allows the user to receive notifications of such signals. The Stochastic indicator is a classic and proven indicator of the technical analysis of the markets. Despite its age, it is still relevant today. Depending on the settings, the indicator allows you to work effectively on various TFs and any markets. Signals are given on fully formed bars and are not redrawn. Custom Parameters: Stochastic_Price (0-1) - The applied pric
FREE
The indicator simplifies the decision-making process by recognizing the reversals using the built-in algorithm, and then confirms the signals at the support / resistance levels. In this way, the indicator tracks the market trend with unsurpassed reliability, ignoring the sharp fluctuations in the market and the noise around the average price. The indicator can be used for both small periods and long-term trading. The indicator is not redrawn and not late. 94% of deals are profitable. Take profit
MA Crosses PRO MT4
Vladimir Gribachev
5 (1)
MA CROSSES PRO MT4 ist ein Kreuzpfeil-Indikator für den gleitenden Durchschnitt. Die Indikatorparameter haben intuitive Namen und jede der Zeilen wird separat konfiguriert. Der Indikator kann ein Signal signalisieren, indem er Pfeile anzeigt, ein Tonsignal ausgibt, eine Benachrichtigung an mobile Endgeräte und eine E-Mail sendet. Der Indikator zeichnet NICHT neu Signale nur beim Schließen der Kerze Hervorragend zum Scalping Funktioniert bei jedem Paar und jedem Zeitrahmen Je älter der Zei
The indicator is a trading system for short-term trading. Scalper Assistant helps to determine the direction of the transaction, and also shows the entry and exit points. The indicator draws two lines (possible points for opening positions). At the moment of the breakdown of the upper line up (and when all trading conditions are met), an up arrow appears (a buy signal), as well as 2 goals. At the moment of the breakdown of the lower line down (and when all trading conditions are met), a do
Binary Options Support Resistance Indicator This indicator is designed for binary options trading and effectively shows retracements from support and resistance levels. Signals appear on the current candle. A red arrow pointing downwards indicates a potential selling opportunity, while a blue arrow pointing upwards suggests buying opportunities. All that needs adjustment is the color of the signal arrows. It is recommended to use it on the M1-M5 timeframes as signals are frequent on these timef
FTU Idioteque Der Indikator ist für die MT4-Plattform bestimmt und kann allein verwendet werden, am besten jedoch mit anderen Indikatoren oder Strategien kombiniert werden Kombiniert verschiedene Indikatoren wie MACD und ADX, um einen Pfeil als Hinweis auf einen Einstieg oder eine Trendänderung zu zeichnen Sehen Sie sich ein kurzes Einführungsvideo auf YouTube an: https://youtu.be/lCRJ3mFNyOQ Anzeigefunktionen: Pfeile verkaufen und kaufen Visuelle und akustische Warnung Trendfortsetzung / Frühz
FREE
TrendPlus
Sivakumar Subbaiya
4.21 (14)
Trend Plus   Trendplus  Indicator   Time Frame: Suitable for any time frame.  Purpose: Trend Prediction. Blue and red candle indicate the buy and sell call respectively. Buy: When the blue candle is formed buy call is initiated. close the buy trades when the next red candle will formed.   Sell: When the Red candle is formed Sell call is initiated. close the Sell trades when the next blue candle will formed.   Happy trade!!
FREE
RSI heatmap
Mr Pimook Chokdamrongsuk
Welcome to the world of trading and technical analysis. In today's fast-paced markets, understanding market sentiment and identifying potential entry and exit points is crucial for successful trading. One essential tool in a trader's arsenal is the Relative Strength Index, or RSI. And now, we introduce the Free RSI Heat Map, a powerful visualization tool that brings RSI data to life. RSI Heat Map offers a comprehensive overview of the RSI values across multiple instruments, allowing trade
FREE
Trend Ray
Andriy Sydoruk
The indicator shows the potential trend direction by cyclical-wave dependence. Thus, all the rays of the intersection will be optimal rays, in the direction of which the price is expected to move, taking into account the indicator period. Rays can be used as a direction for potential market movement. But we must not forget that the approach must be comprehensive, the indicator signals require additional information to enter the market.
DYJ Alligator SignalSource   is based on Alligator   indicator. It can be used for any currency pair and timeframe. The blue line (Alligator's Jaw) is the Balance Line for the timeframe that was used to build the chart (13-period Smoothed Moving Average, moved into the future by 8 bars); Red Line (Alligator's Teeth) is the Balance Line for the value timeframe of one level lower (8-period Smoothed Moving Average, moved by 5 bars into the future); Green Line (Alligator's Lips) is the Balance Line
PipFinite Breakout EDGE
Karlo Wilson Vendiola
4.94 (654)
The Missing Edge You Need To Catch Breakouts Like A Pro. Follow a step-by-step system that detects the most powerful breakouts! Discover market patterns that generate massive rewards based on a proven and tested strategy. Unlock Your Serious Edge Important information here www.mql5.com/en/blogs/post/723208 The Reliable Expert Advisor Version Automate Breakout EDGE signals using "EA Breakout EDGE" Click Here Have access to the game changing strategy that will take your trading to the n
This multi time frame and multi symbol indicator alerts about Heiken Ashi Smoothed color changes. As a bonus it can also scan for Hull Moving Average trend (color) changes. Combined with your own rules and techniques, this indicator will allow you to create (or enhance) your own powerful trading system. Features Can monitor all symbols visible in your Market Watch window at the same time. Apply the indicator to just one chart and instantly monitor the entire market. Can monitor every time frame
Forex 3d
Andrey Kozak
Forex 3D ist ein fertiges Handelssystem zum Scalping für jedes Währungspaar. Empfohlener Zeitraum M5. Die durchschnittliche Anzahl der Transaktionen, die wir jeden Tag eröffnen können, liegt zwischen 5 und 15. Dieses Handelssystem eignet sich für den Handel mit allen Währungspaaren, einschließlich Gold und Silber. Forex 3D ist ein sehr einfaches Handelssystem, das für Forex-Anfänger geeignet ist. Es erfordert keine zusätzliche Marktanalyse mit anderen Handelsinstrumenten. Wir können uns ausschl
Laguerre BoB AM
Andriy Matviyevs'kyy
5 (1)
The indicator improves the idea implemented in the standard Bulls and Bears indicator. This indicator displays the difference between the High and Low for the current period of time and the values ​​of the channel constructed at the maximum and minimum prices, which are smoothed by Laguerre method. The growth of the indicator values ​​above zero indicates that the High for the current period is greater than the average of the High prices. This situation in most cases indicates an increase in the
FREE
Hermes Gold PRO
Igor Pereira Calil
Der HERMES-Spezialist ist ein Roboter für Meta Trader mit dem Ziel, mit den eigenen Trends und Strategien des Roboters zu arbeiten. LASSEN SIE HERMES GOLD PRO KOSTENLOS IN IHREM KONTO INSTALLIEREN UND FUNKTIONIEREN. FRAGEN SIE MIR EINE PRIVATE NACHRICHT. ZEITRAHMEN-NUTZUNGSEMPFEHLUNG: H1 HERMES wurde entwickelt, um mit dem amerikanischen Metall XAUUSD (GOLD) zu arbeiten. HERMES ist ein langjähriger Experte für durchsetzungsfähiges SCALPING und kann daher je nach Wert seiner „Risikokonfigura
Forex Indicator HTF Ichimoku for MT4 Ichimoku indicator is   one of the most powerful trend indicators .  H TF means -   H igher Time Frame This indicator is excellent for Trend Traders as well as combination with Price Action entries. HTF Ichimoku  Indicator allows you to attach Ichimoku from Higher time frame to your current chart. Up trend   - red line above blue one (and both lines are above cloud) /   Down trend   - red line below blue one  (and both lines are below cloud) Open BUY orders
Käufer dieses Produkts erwarben auch
Atomic Analyst
Issam Kassas
5 (2)
Zunächst einmal ist es erwähnenswert, dass dieser Handelsindikator nicht neu malt, nicht neu zeichnet und keine Verzögerung aufweist, was ihn sowohl für manuellen als auch für Roboterhandel ideal macht. Der Atom-Analyst ist ein PA-Preisaktionsindikator, der die Stärke und das Momentum des Preises nutzt, um einen besseren Vorteil auf dem Markt zu finden. Ausgestattet mit fortschrittlichen Filtern, die helfen, Rauschen und falsche Signale zu entfernen, und das Handelspotenzial zu erhöhen. Durch
TPSproTREND PrO
Roman Podpora
5 (15)
TPSpro TRENDPRO  - is a trend indicator that automatically analyzes the market and provides information about the trend and each of its changes, as well as giving signals for entering trades without redrawing! The indicator uses each candle, analyzing them separately. referring to different impulses - up or down impulse. Exact entry points into transactions for currencies, crypto, metals, stocks, indices!  -  Version MT5               DETAILED DESCRIPTION        /       TRADING SETUPS           
DERZEIT 26% RABATT Die beste Lösung für jeden Newbie oder Expert Trader! Dieser Indikator ist ein einzigartiges, qualitativ hochwertiges und erschwingliches Trading-Tool, da wir eine Reihe von proprietären Funktionen und eine neue Formel integriert haben. Mit nur EINEM Chart können Sie die Währungsstärke für 28 Forex-Paare ablesen! Stellen Sie sich vor, wie sich Ihr Handel verbessern wird, weil Sie in der Lage sind, den genauen Auslösungspunkt eines neuen Trends oder einer Scalping-Gelegenh
Derzeit 20% Rabatt! Die beste Lösung für jeden Neueinsteiger oder Expert Händler! Dieses Dashboard arbeitet mit 28 Währungspaaren. Es basiert auf 2 unserer Hauptindikatoren (Advanced Currency Strength 28 und Advanced Currency Impulse). Es bietet einen hervorragenden Überblick über den gesamten Forex-Markt. Es zeigt die Werte der Advanced Currency Strength, die Veränderungsrate der Währungen und die Signale für 28 Devisenpaare in allen (9) Zeitrahmen. Stellen Sie sich vor, wie sich Ihr Hande
Scalper Inside PRO
Alexey Minkov
4.75 (55)
SALE NOW! Limited Time Offer! An exclusive indicator that utilizes an innovative algorithm to swiftly and accurately determine the market trend. The indicator automatically calculates opening, closing, and profit levels, providing detailed trading statistics. With these features, you can choose the most appropriate trading instrument for the current market conditions. Additionally, you can easily integrate your own arrow indicators into Scalper Inside Pro to quickly evaluate their statistics and
TPSpro RFI Levels
Roman Podpora
5 (13)
A key element in trading is zones or levels from which decisions to buy or sell a trading instrument are made. Despite attempts by major players to conceal their presence in the market, they inevitably leave traces. Our task was to learn how to identify these traces and interpret them correctly. Reversal First Impulse levels (RFI)   -  Version MT5                INSTRUCTIONS                 RUS                 ENG                                       R ecommended to use with an indicator   -  
Wir stellen vor       Quantum Trend Sniper Indicator   , der bahnbrechende MQL5-Indikator, der die Art und Weise, wie Sie Trendumkehrungen erkennen und handeln, verändert! Entwickelt von einem Team erfahrener Händler mit über 13 Jahren Handelserfahrung,       Quantum Trend Sniper-Indikator       wurde entwickelt, um Ihre Trading-Reise mit seiner innovativen Methode zur Identifizierung von Trendumkehrungen mit extrem hoher Genauigkeit auf ein neues Niveau zu heben. ***Kaufe Quantum Trend Snipe
Quantum Breakout Indicator PRO
Bogdan Ion Puscasu
4.96 (26)
Wir stellen vor       Quantum Breakout PRO   , der bahnbrechende MQL5-Indikator, der die Art und Weise, wie Sie mit Breakout-Zonen handeln, verändert!   Quantum Breakout PRO   wurde von einem Team erfahrener Händler mit über 13 Jahren Handelserfahrung entwickelt und soll Ihre Handelsreise mit seiner innovativen und dynamischen Breakout-Zonen-Strategie auf ein neues Niveau bringen. Der Quantum Breakout Indicator zeigt Ihnen Signalpfeile auf Breakout-Zonen mit 5 Gewinnzielzonen und Stop-Loss
Advanced Supply Demand
Bernhard Schweigert
4.92 (310)
Derzeit 33% Rabatt! Die beste Lösung für jeden Anfänger oder erfahrenen Händler! Dieser Indikator ist ein einzigartiges, qualitativ hochwertiges und erschwingliches Trading-Tool, da wir eine Reihe von proprietären Funktionen und eine neue Formel integriert haben. Mit diesem Update werden Sie in der Lage sein, doppelte Zeitrahmenzonen anzuzeigen. Sie können nicht nur einen höheren TF (Zeitrahmen) anzeigen, sondern sowohl den Chart-TF als auch den höheren TF: SHOWING NESTED ZONES. Alle Supply Dema
Präsentation des Miraculous Forex Indikators: Entfesseln Sie die Kraft präzisen Tradings Sind Sie es leid, nach dem besten Forex-Indikator zu suchen, der wirklich herausragende Ergebnisse in allen Zeitebenen liefert? Suchen Sie nicht weiter! Der Miraculous Forex Indikator ist da, um Ihre Trading-Erfahrung zu revolutionieren und Ihre Gewinne auf neue Höhen zu bringen. Basierend auf modernster Technologie und jahrelanger sorgfältiger Entwicklung steht der Miraculous Forex Indikator als Höhepunkt v
Entry Points Pro
Yury Orlov
4.7 (225)
Dies ist ein Indikator für MT4, der genaue Signale für den Einstieg in einen Handel ohne Repainting (Neuzeichnen) liefert. Er kann auf alle Finanzwerte angewendet werden: Forex, Kryptowährungen, Metalle, Aktien, Indizes. Er liefert ziemlich genaue Schätzungen und sagt Ihnen, wann es am besten ist, eine Position zu eröffnen und zu schließen. Sehen Sie sich das Video (6:22) mit einem Beispiel für die Verarbeitung nur eines Signals an, das sich für den Indikator gelohnt hat! Die meisten Händler ver
TrendMaestro
Stefano Frisetti
5 (2)
note: this indicator is for METATRADER4, if you want the version for METATRADER5 this is the link: TRENDMAESTRO recognizes a new TREND in the bud, he never makes mistakes. The certainty of identifying a new TREND is priceless. DESCRIPTION TRENDMAESTRO identifies a new TREND in the bud, this indicator examines the volatility, volumes and momentum to identify the moment in which there is an explosion of one or more of these data and therefore the moment in which prices have strong probability of f
FX Volume
Daniel Stein
4.6 (35)
Erhalten Sie Ihr tägliches Marktupdate mit Details und Screenshots über unser Morning Briefing hier auf mql5 und auf Telegram ! FX Volume ist der ERSTE und EINZIGE Volumenindikator, der einen ECHTEN Einblick in die Marktstimmung aus Sicht eines Brokers bietet. Es bietet fantastische Einblicke in die Positionierung von institutionellen Marktteilnehmern, wie z.B. Brokern, auf dem Forex-Markt, viel schneller als COT-Berichte. Diese Informationen direkt auf Ihrem Chart zu sehen, ist der wahre Game
Price Action Entry Alerts
Stephen Sanjeeve Sahayam
5 (3)
Dieser Indikator überprüft jeden Balken auf Kauf- oder Verkaufsdruck und identifiziert 4 Arten von Kerzenmustern mit dem höchsten Volumen. Diese Kerzen werden dann mithilfe mehrerer linearer Filter gefiltert, um Kauf- oder Verkaufssignale anzuzeigen. Signale funktionieren am besten in Verbindung mit einer höheren Zeitrahmenrichtung und wenn sie während der Stunden mit hohem Handelsvolumen gehandelt werden. Alle Filter sind anpassbar und funktionieren unabhängig voneinander. Kann Signale einer e
How to use Pair Trading Station Pair Trading Station is recommended for H1 time frame and you can use it for any currency pairs. To generate buy and sell signal, follow few steps below to apply Pair Trading Station to your MetaTrader terminal. When you load Pair Trading Station on your chart, Pair Trading station will assess available historical data in your MetaTrader platforms for each currency pair. On your chart, the amount of historical data available will be displayed for each currency pai
FX Power MT4 NG
Daniel Stein
5 (8)
Erhalten Sie Ihr tägliches Marktupdate mit Details und Screenshots über unser Morning Briefing hier auf mql5 und auf Telegram ! FX Power MT4 NG ist die nächste Generation unseres langjährig sehr beliebten Währungsstärkemessers FX Power. Und was bietet dieser Stärkezähler der nächsten Generation? Alles, was Sie am ursprünglichen FX Power geliebt haben PLUS GOLD/XAU-Stärkeanalyse Noch präzisere Berechnungsergebnisse Individuell konfigurierbare Analysezeiträume Anpassbares Berechnungslimit für noc
Cycle Sniper
Elmira Memish
4.4 (35)
NEW YEAR SALE PRICE FOR LIMITED TIME!!! Please contact us after your purchase and we will send you the complimentary indicators to complete the system Cycle Sniper is not a holy grail but when you use it in a system which is explained in the videos, you will feel the difference. If you are not willing to focus on the charts designed with Cycle Sniper and other free tools we provide, we recommend not buying this indicator. We recommend watching the videos about the indiactor and system before pu
PTS Precision Index Oscillator V2
PrecisionTradingSystems
5 (1)
Der Precision Index Oscillator (Pi-Osc) von Roger Medcalf von Precision Trading Systems Version 2 wurde sorgfältig neu codiert, um extrem schnell auf Ihrem Chart geladen zu werden, und es wurden einige andere technische Verbesserungen eingearbeitet, um die Erfahrung zu verbessern. Pi-Osc wurde entwickelt, um genaue Handelstimingsignale bereitzustellen, die darauf abzielen, extreme Erschöpfungspunkte zu finden, an die die Märkte gezwungen werden, um einfach die Stops aller herauszunehmen.
TakePropips Donchian Trend Pro
Eric John Pajarillaga Aldana
4.82 (17)
TakePropips Donchian Trend Pro   (MT4) ist ein leistungsstarkes und effektives Tool, das mithilfe des Donchian-Kanals automatisch die Richtung des Trends erkennt und Ihnen Handelssignale für den Ein- und Ausstieg liefert! Dieser Multifunktionsindikator umfasst einen Trendscanner, Handelssignale, ein statistisches Panel, einen Screener, Handelssitzungen und ein Dashboard für den Verlauf von Warnungen. Es wurde entwickelt, um Ihnen Handelssignale zu liefern und Ihnen Stunden beim Analysieren der C
GOLD Impulse with Alert
Bernhard Schweigert
4.56 (9)
Dieser Indikator ist eine hervorragende Kombination aus unseren 2 Produkten Advanced Currency IMPULSE with ALERT  +   Currency Strength Exotics . Es funktioniert für alle Zeitrahmen und zeigt grafisch Impulse der Stärke oder Schwäche für die 8 wichtigsten Währungen plus ein Symbol! Dieser Indikator ist darauf spezialisiert, die Beschleunigung der Währungsstärke für beliebige Symbole wie Gold, Exotische Paare, Rohstoffe, Indizes oder Futures anzuzeigen. Als erster seiner Art kann jedes Sym
PTS - Divergence Buy Finder von Precision Trading Systems Der Precision Divergence Finder wurde entwickelt, um Markt-Tiefpunkte mit höchster Genauigkeit zu finden und tut dies häufig. In der technischen Analyse ist das Aufspüren von Tiefpunkten im Allgemeinen viel einfacher als das Aufspüren von Höchstpunkten. Dieses Tool wurde genau für diese Aufgabe entwickelt. Nachdem eine bullische Divergenz identifiziert wurde, ist es ratsam, auf die Trendwende zu warten, bevor Sie kaufen. Sie können e
Der PTS Divergence Finder Sell Indicator von Roger Medcalf - Precision Trading Systems. Dieser Indikator gibt nur bärische - Verkaufssignale. Zuallererst wurde ich oft gefragt, warum ich über viele Jahre hinweg einen Kaufsignal-Divergenzfinder zur Verfügung stellte, aber keinen Verkaufsdifferenz-Indikator anbot. Ich antwortete, dass Verkaufsdifferenzen weniger zuverlässig sind als Kaufdifferenzen, was immer noch zutrifft. Es wurden einige Lösungen gefunden, nicht indem ich dem Gruppendruck nachg
Der Forex TPA Indikator deckt die wahren Aktionen der Marktmacher auf, immer dann wenn sie passieren. "Kämpfe nicht gegen die Marktmacher an, sondern folge ihnen", ist wohl der beste Rat, den ein Trader bekommen kann. Der TPA Indikator zeigt jedesmal seine Signale an wenn die Bullen definitiv stärker sind als die Bären und umgekehrt. Dieser Indikator wurde VON Tradern FÜR Trader gemacht und ist 100% NICHT NACHZEICHNEND! Signale werden STRENG am Schluss einer Kerze  generiert. Das sagen unsere Ku
Indicator : RealValueIndicator Description : RealValueIndicator is a powerful tool designed specifically for trading on the EURUSD pair. This indicator analyzes all EUR and USD pairs, calculates their real currency strength values, and displays them as a single realistic value to give you a head start on price. This indicator will tell you moves before they happen if you use it right. RealValueIndicator allows you to get a quick and accurate overview of the EURUSD currency pair tops and bottoms,
Reversal Sniper
Elmira Memish
5 (3)
Reversal Sniper is designed to find the extreme reversals of the price. Indicator collects data of Cycle Sniper Indicator. NOTE: REVERSAL SNIPER Indicator is made for Cycle Sniper Users as an additional tool.  However, it can be used by the traders who look for finding out strong reversal levels. Indicator works on all timeframes and all instruments. Reversal  Sniper  Checks: Harmonic Patterns RSI Zig Zag and Harmonic Swings Cycle Sniper Indicator's Buy / Sell Signals The complex algo i
XQ Indicator MetaTrader 4
Marzena Maria Szmit
3 (2)
Step into the realm of Forex trading with confidence and precision using XQ, a cutting-edge Forex indicator designed to elevate your trading game to unprecedented heights. Whether you're a seasoned trader or just stepping into the world of currency exchange,   XQ Forex Indicator   empowers you with the insights and signals needed to make informed trading decisions. The signal conditions are a combination of three indicators, and XQ Forex Indicator only display  medium and long-term trends . The
XPointer
Andrey Kozak
5 (3)
XPointer is a completely ready trading system. It shows the trader when to open and close a trade. It works on all currency pairs and all time frames. Very easy to use and does not require additional indicators for its operation. Even a beginner trader can start working with XPointer. But it will also be useful for professional traders to confirm the opening of orders. Features of the XPointer indicator It does not redraw its values. It works on all currency pairs and all time frames. It has a
Wir stellen Ihnen ON Trade Waves Patterns Harmonic Elliot Wolfe vor, einen fortschrittlichen Indikator, der entwickelt wurde, um verschiedene Markt-Muster mithilfe sowohl manueller als auch automatischer Methoden zu erkennen. Hier ist, wie er funktioniert: Harmonische Muster: Dieser Indikator kann harmonische Muster erkennen, die auf Ihrem Chart erscheinen. Diese Muster sind für Trader, die die Theorie des harmonischen Handels praktizieren, wie sie in Scott Carney's Buch "Harmonic Trading vol 1
NO REPAINT ADVANCED CHART PATTERN INDICATOR By definition, a price ( chart)  pattern is a recognizable configuration of price movement that is identified using a series of  trendlines  and/or curves. When a price pattern signals a change in trend direction, it is known as a reversal pattern; a continuation pattern occurs when the trend continues in its existing direction following a brief pause. Advanced Chart Pattern Tracker is designed to find the MOST ACCURATE patterns. A special script is
Currency Strength Exotics
Bernhard Schweigert
4.88 (33)
Stärke von 8 Währungen plus EIN EXOTISCHES Paar oder Rohstoffe oder Indexe! Jedes Produkt kann als 9. Linie hinzugefügt werden. Fügen Sie Rohstoffe, Indexes oder exotische Währungen hinzu (Gold, Silber, Öl, DAX, US30, MXN, TRY, CNH ...). Eine neue noch nie dagewesene TRADING STRATEGIE  !!! Dieser Indikator ist einzigartig, weil wir eine Reihe von proprietäre Funktionen und neue Formeln eingebaut haben. Es funktioniert für alle Zeitrahmen. Basierend auf neuen zugrunde liegenden Algorithmen ist
Weitere Produkte dieses Autors
Description of the Doctor Winston bot General characteristics: Name: Doctor Winston Type: Ultramodern Forex trading bot Instruments: Trades on most currency pairs and instruments Timeframe: Can be set to any timeframe Bot settings: Money Management (Capital Management): MMOn: Enabling/disabling capital management (true/false) DefaultVolume: Default transaction volume (0.01) MMCalc: Base amount for capital management (1000) Indicators: ALength, BLength, CLength, DLength, ELength: Parameters
Gyroscope        professional forex expert   (for EURUSD, GBPUSD, USDJPY, AUDUSD, USDCHF, EURGBP, EURJPY, NZDUSD, USDCAD, EURCHF, AUDJPY, CADJPY pairs)   alyzing the market using the Elliot Wave Index. Elliott wave theory is the interpretation of processes in financial markets through a system of visual models (waves) on price charts. The author of the theory, Ralph Elliott, identified eight variants of alternating waves (of which five are in the trend and three are against the trend). The mo
Milioron mt5
Nadiya Mirosh
The   Milioron   robot, developed for the Forex market, has significant flexibility and offers many mechanisms for maintaining a series of orders. It allows traders to automate and optimize their trading using built-in strategies and risk management approaches. Some of the main features and capabilities of the Milioron robot include: 1. **Flexibility of settings**: The robot provides traders with a wide range of parameters and settings that can be adapted to specific trading strategies and
Smoking
Nadiya Mirosh
I suggest that everyone who is interested in the Smoking indicator try to trade. Smoking is a technical analysis tool that uses mathematical calculations to determine various aspects of price movement and is based on historical data. Smoking reveals special aspects of price movement and allows traders to make the right decision. All trading indicators analyze the price from different angles based on historical data. Therefore, it is not entirely correct to say that they can predict the future
Fracture
Nadiya Mirosh
The Fracture indicator uses many moving averages that are with a given Length step. As a result of the work, the resulting lines are formed, which are displayed on the price chart as blue and red lines. The simplest use case for the indicator is to open a trade in the direction of an existing trend. The best result is obtained by combining the indicator with fundamental news; it can act as a news filter, that is, show how the market reacts to this or that news. The indicator lines can also be in
Looking for a quality pivot point indicator? So Prosecution is what you need! To identify pivot points, the Prosecution indicator analyzes many conditions, as the aggregate analysis provides a more accurate picture of the market situation. What are pivot points? Pivot point analysis is often used in conjunction with the calculation of support and resistance levels, as is the case with trend line analysis. When analyzing pivot points, the first support and resistance levels are calculated usin
Before
Nadiya Mirosh
The Before indicator predicts the most likely short-term price movement based on complex mathematical calculations. Most of the standard indicators commonly used in trading strategies are based on fairly simple calculations. This does not mean that there were no outstanding mathematicians in the world at the time of their creation. It is just that computers did not yet exist in those days, or their power was not enough for the sequential implementation of complex mathematical operations. Nowa
AnalizatorMTF is an oscillator indicator, a more progressive version of the indicator, with easy customization and ease of use. The following levels are used to identify signals: 0; 0.75 / -0.75; 0.9 / -0.9, as well as the configuration of the indicator curve itself. The difference from other similar indicators is in the pointers of entry points in the form of arrows of the corresponding direction and color and the possibility of displaying higher timeframes on lower ones. The indicator can b
AnalizatorSSRC is an oscillator indicator that is easy to set up and easy to use. The following levels are used to identify signals: 0; 0.75 / -0.75; 0.9 / -0.9, as well as the configuration of the indicator curve itself. Its main difference is the absence of a signal line and signals associated with its intersections. The indicator can be used as part of various strategies. Like other oscillators, it shows trend and flat zones, as well as oversold and overbought areas.
The correlation coefficient reflects the relationship between two values. It shows the dependence of changes in one value on changes in another. For example, from changes in the price of EURUSD and EURNZD. The correlation coefficient in trade, currency relations is constantly changing. Special indicators of correlation help to define it, trace changes, draw correct conclusions. One of them is the Hubbles Correlator indicator. The indicator allows you to simultaneously display several other char
Trend Indicator, a revolutionary trend trading and filtering solution with all the important trend tool features built into one tool! The Step Success indicator is good for any trader, suitable for any trader for both forex and binary options. You do not need to set up anything, everything is perfected with time and experience, it works great during a flat and a trend.
The Analytical cover trend indicator is a revolutionary trend trading and filtering solution with all the important features of a trend tool built into one tool! The Analytical cover indicator is good for any trader, suitable for any trader for both forex and binary options. You don’t need to configure anything, everything is perfected by time and experience, it works great during a flat and in a trend. The Analytical cover trend indicator is a tool for technical analysis of financial markets
What are "pivot points"? Pivot point analysis is often used in conjunction with the calculation of support and resistance levels, as is the case with trend line analysis. Pivot point analysis calculates the first support and resistance levels using the trading range width between the pivot point and the previous day's high or low price. The second support and resistance levels are calculated using the entire width between the previous day's high and low prices. Looking for a quality pivot poi
The Trend Live indicator is a development for trend trading. Trend indicators make it possible to classify the direction of price movement by determining its strength. Solving this problem helps investors enter the market on time and get a good return. The Trend Live indicator helps to analyze the market on the selected time interval. They define the mainstream. Easy to set up and works on all pairs and all time frames. Trend Live is a trend trading and filtering solution with all the important
With the help of the Impulses Enter forex indicator algorithm, you can quickly understand what kind of trend is currently developing in the market. The Elephant indicator accompanies long trends, can be used without restrictions on instruments or timeframes. With this indicator, you can try to predict future values. But the main use of the indicator is to generate buy and sell signals. The indicator tracks the market trend, ignoring sharp market fluctuations and noises around the average price.
Trend Oracle trend indicator, shows entry signals. Displays both entry points and the trend itself. Shows statistically calculated moments for entering the market with arrows. When using the indicator, it is possible to optimally distribute the risk coefficient. The indicator can be used for both short-term pipsing and long-term trading. Uses all one parameter for settings. Length - the number of bars to calculate the indicator. When choosing a parameter, it is necessary to visually similarize s
Using the Trend alternate indicator algorithm, you can quickly understand what kind of trend is currently developing on the market. The Trend Alternate Indicator accompanies lengths, can be used without instruments or timframes. With this indicator, you can try to predict future values. But the main application of the indicator is to generate signals for the purchase and sale. The indicator monitors the market trend with ignoring the sharp fluctuations in the market and the noise around the aver
Bot Speed
Nadiya Mirosh
B ot Speed Forex trading advisor is an automatic scalping system that opens and closes deals using a special tick analysis algorithm programmed in code without human intervention. The main task of the ego is to instantly make a deal where a person loses time for analysis and decision making. They also automate trading, removing the emotional burden from a person and allowing you to save time. Scalping is one of the varieties of short-term strategies, moreover, the shortest of them. Using this t
Using the Arrow Effect forex indicator algorithm, you can quickly understand what kind of trend is currently developing in the market. The Elephant indicator accompanies long trends, can be used without restrictions on instruments or timeframes. With this indicator, you can try to predict future values. But the main use of the indicator is to generate buy and sell signals. The indicator tracks the market trend, ignoring sharp market fluctuations and noises around the average price. The indicator
The Riko Trend indicator is a revolutionary trend trading and filtering solution with all the important features of a trend tool built into one tool! The Riko Trend indicator is good for any trader, suitable for any trader for both forex and binary options. You don’t need to configure anything, everything is perfected by time and experience, it works great during a flat and in a trend. The Riko Trend indicator is a technical analysis tool for financial markets that reflects the current price
With the help of the Fine Market Forex indicator algorithm, you can quickly understand what kind of trend is currently developing in the market. Fine Market is a combined indicator based on several instruments. Fine Market is based on classic basic technical indicators - MA, RSI, MACD, Bollinger Bands, Stochastic. A trader does not need to impose several lines on Forex charts and set up each indicator separately. Fine Market is already successfully combined and has simplified settings, convenie
Профессиональный эксперт форекс   Associate Manager   (для пар EURUSD, GBPUSD, USDJPY, AUDUSD, USDCHF) ализирующий рынок при помощи индекса волн эллиота. Волновая теория Эллиотта — интерпретация процессов на финансовых рынках через систему визуальных моделей (волн) на ценовых графиках.  Автор теории Ральф Эллиотт выделил восемь вариантов чередующихся волн (из них пять по тренду и три против тренда). Движение цен на рынках принимает форму пяти волн. Три из них (1, 3, 5) вызывают направленное д
With the help of this Practica Trend forex indicator algorithm, you can quickly understand what kind of trend is currently developing in the market. The Practical Trend indicator accompanies long trends, can be used without restrictions on instruments or timeframes. With this indicator, you can try to predict future values. But the main use of the indicator is to generate buy and sell signals. The Practical Trend indicator is used in the forex markets. One of the main definitions for monitori
Trend analysis is perhaps the most important area of technical analysis and is the key to determining the overall direction of an instrument's movement. The Quest Trend indicator determines the prevailing trend. They help analyze the market on a selected time interval. Trends are based on the principle of higher highs, higher lows (for an uptrend) and lower highs, lower lows (for a downtrend). They can have different time periods and they can be related to each other like fractals. For example,
Arog
Nadiya Mirosh
Forex trading advisor     Arog     is an automatic scalping system that opens and closes transactions using a special tick analysis algorithm programmed in code without human intervention. The main task is to instantly make a deal where a person wastes time on analysis and decision-making. Scalp trading or scalping is a short-term trading strategy that a trader uses to frequently make small profits from small price changes that add up to a large amount over time. This strategy is very popular i
Gyroscopes
Nadiya Mirosh
Gyroscope        professional forex expert   (for EURUSD, GBPUSD, USDJPY, AUDUSD, USDCHF, EURGBP, EURJPY, NZDUSD, USDCAD, EURCHF, AUDJPY, CADJPY pairs)   alyzing the market using the Elliot Wave Index. Elliott wave theory is the interpretation of processes in financial markets through a system of visual models (waves) on price charts. The author of the theory, Ralph Elliott, identified eight variants of alternating waves (of which five are in the trend and three are against the trend). The mo
NeoX
Nadiya Mirosh
Using the Neo Forex indicator algorithm, you can quickly understand what trend is currently developing in the market. The NeoX indicator accompanies long trends and can be used without restrictions on instruments or timeframes. Using this indicator you can try to predict future values. But the main use of the indicator is to generate buy and sell signals. The indicator tracks the market trend, ignoring sharp market fluctuations and noise around the average price. The indicator implements a type
Description of the Doctor Winston bot General characteristics: Name: Doctor Winston Type: Ultramodern Forex trading bot Instruments: Trades on most currency pairs and instruments Timeframe: Can be set to any timeframe Bot settings: Money Management (Capital Management): MMOn: Enabling/disabling capital management (true/false) DefaultVolume: Default transaction volume (0.01) MMCalc: Base amount for capital management (1000) Indicators: ALength, BLength, CLength, DLength, ELength: Parameters
Barry Hood's leading trend indicator is designed to more accurately determine the direction of the trend in financial markets. Here are the main characteristics and operating principles of this indicator: Adaptive Four-Level Smoothing: The indicator uses a mechanism that allows it to effectively adapt to changing market conditions. This allows you to more accurately determine the current trend. Characteristics and features: Redraws only on the zero candle: This means that the indicator is r
Billi mt4
Nadiya Mirosh
" Billi " is an advanced trading bot designed for modern traders in the Forex market. This innovative tool serves as a reliable assistant for anyone aiming for efficient and automated trading. Key Features of " Billi ": Reliability and Stability: " Billi " is developed using cutting-edge technologies to ensure its reliability and stability in the market. Smart Risk Management: With built-in Money Management, " Billi " allows controlling the risk level and optimizing trading strategies. Real-T
Auswahl:
Keine Bewertungen
Antwort auf eine Rezension