Wie man einen Handelsroboter schnell bestellen kann
Lesen Sie bitte zuerst die Regeln durch
Wie man einen Handelsroboter in MQL5 und MQL4 in Auftrag gibt
Hier ist das Muster einer Anforderungsspezifikation, um einen Roboter zu bestellen
Neuer Aufträge in dieser Kategorie:
50 - 100 USD
30 - 50 USD
50 - 250 USD
30 - 200 USD
30 - 500 USD
Spezifikation
Upgrade indicator , Collect data from indicator (Harmonic Pattern Finder V2) multiple symbols & multiple timeframes - dashboard.
This is the indicator I want to get some modifications on : https://www.mql5.com/en/code/16852 and called (Harmonic Pattern Finder V2).
I want to do two things on the indicator:
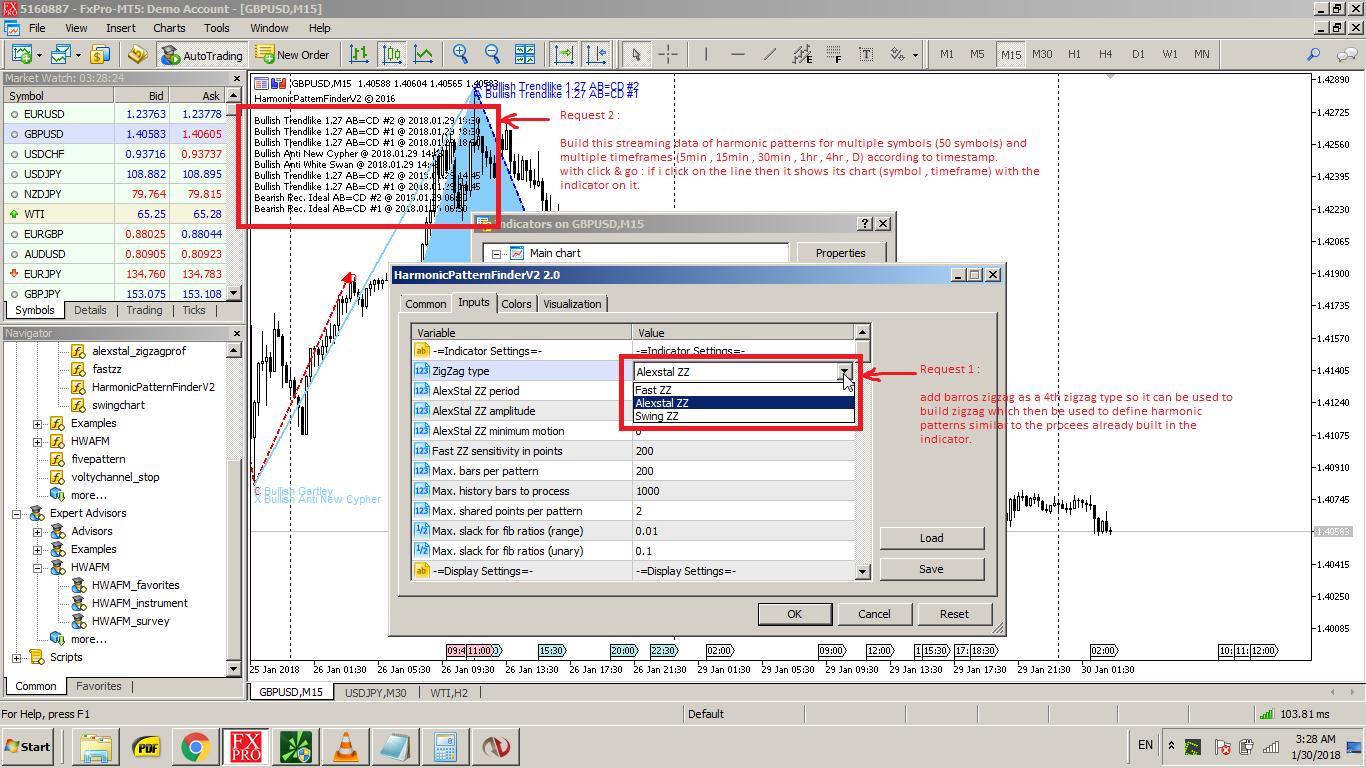
1- the indicator (Harmonic Pattern Finder V2) is using different zigzag's indicators (alexstall zz , fast zz , swing zz) to define swings for which it then use to search for harmonic patterns.
i have (barros zigzag = Barros2.mq4) attached which is much better in defining swings .. plz have a look at it.
I want to update the indicator (Harmonic Pattern Finder V2) by adding (barros zigzag = Barros2.mq4) as a 4th zigzag option and use barros zigzag swings to build harmonic patterns using (Harmonic Pattern Finder V2)?
as you see in the attached pictures that the (Harmonic Pattern Finder V2) is using 3 zigzag's options types and I want to add (barros zigzag) as a 4th zigzag option which can be used to define the harmonic patterns already built in the indicator but by using the barros zigzag = Barros2.mq4.
2- After you do the first request : if you put the (Harmonic Pattern Finder V2) on the chart then it will stream the latest harmonic patterns appeared on that chart on the upper left corner.
I want to build streaming dashboard for multiple symbols and multiple timeframes to show the latest harmonic pattern for symbols on these timeframes .. just show arrow (or blue/red arrows : if many patterns happen to occur on same swing point) .. just show the status of the most recent pattern/patterns (arrow , arrows) for the (last pattern = first line).
I want to combine this streaming of patterns (last pattern = first line) for multiple symbols (50 symbols) and ,multiple timeframes (5m , 15m , 30m , 1hr , 4hr , d) on one table >> just i define the 50 symbols and timeframes i want to track then it stream the latest patterns appear for symbol x on timeframe y @ timestamp z.
I'm looking to build dashboard (table showing multiple symbols , multiple TF's) showing the status of the indicator in each TF for each symbol using only arrow (or arrows). I just want to show arrows in the dashboard for each symbol in each TF (maybe many arrows in each cell).
it show the latest pattern appeared for these symbols/timeframes/timestamp on one chart by using arrow/arrows.
then if i click on any line then it take me to that symbol/timeframe arranged by the timestamp of the pattern appearance.
P.S. Please look at the attachments.
Ähnliche Aufträge
ENTRY EXIT TIMING (ET BANDS)
30 - 50 USD
QUIERO CONSEGUIR EL CODIGO FUENTE DE ESTE INDICADOR QUE ME GUSTA MUCHO TAMBIEN TIENE EL NOMBRE DE ET BANDS O ENTRY EXIT TIMING . no se los componentes pero estas son las imagenes. que mejor lo describen
Hello Developers, I want to build a custom Expert Advisor (EA) for MetaTrader 5 (MT5) to trade Gold (XAUUSD) and Bitcoin (BTCUSD). This will be based on my own custom strategy. Here are the project requirements: 1. Platform: MetaTrader 5 (MQL5) 2. Trading Assets: Gold (XAUUSD) and Bitcoin (BTCUSD) 3. Timeframe: Suitable for multi-timeframe execution (I will specify the exact timeframes in private chat) 4. Core
Standby Description . Prop Firm Environment . ( Monitor Execution and Handling Environment Changes as Required ) . Technical Issues . Delete extra lines of code (Clean Code , Folder) . Asset related translation , no need for Logic Alteration
EA Crafter
500+ USD
Act as a professional Quantitative Developer and Risk Manager. I want to build a systematic trading strategy rulebook that prioritizes capital preservation and statistical edge over raw performance. Please generate a structured trading strategy using the following framework: 1. ASSET CLASS & TIMEFRAME: - Asset: [e.g., Apple (AAPL), Bitcoin (BTC), or EUR/USD] - Timeframe: [e.g., 5-minute, 1-hour, Daily] 2. CORE
Driven Multiple Choice
30+ USD
Part 1: Project setup Input settings (risk, stop loss, take profit, EMA periods) Indicator initialization Trade management framework Part 2: Trading logic EMA crossover detection Buy/Sell entry rules One-trade-per-symbol check Part 3: Risk management Automatic lot size calculation Stop-loss and take-profit placement Trade execution and error handling Part 4: Final touches On-screen information Optimization
Institutional‑Grade Multi‑Currency MT5 EA
1000 - 1300 USD
Hello, I am reopening this project with a fully updated and clarified specification. I am looking for a high‑level MQL5 developer who can deliver a clean, stable, and professional Phase 1 version of my: Institutional‑Grade Multi‑Currency MT5 EA (A2SR + SMC + Smart Recovery + Smart Grid + Liquidity + Volatility + Safety Filters) This EA is not a simple indicator conversion or a basic strategy. It is a structured
HFT / Latency Arbitrage / Scalper needed
30 - 5000 USD
I am looking for an experienced MQL5 or MQL4 developer with a strong background in low-latency algorithmic trading, market data integration, arbitrage and execution optimization. The project involves developing a high-performance HFT Expert Advisor (EA) for XAUUSD or US30 on IC Markets that is designed for robust execution in both demo and live environments. The EA may use market data feeds (such as lmax,one zero or
Hft gold ea live account ic market
30 - 3000 USD
I am looking for an experienced MQL5 or MQL4 developer with a strong understanding of high-frequency trading (HFT) concepts who can explain how certain HFT-style strategies have historically been able to pass proprietary firm evaluations while also being profitable on demo accounts and capable of transitioning successfully to live trading. I am interested in understanding the legitimate trading logic, execution
Pine Script Integration Request (Experienced Coders Only) I am looking for a highly experienced Pine Script developer to integrate a Demand & Supply Zone module into my existing indicator. Requirements Keep my current indicator (Rudy) exactly as it is. Do NOT modify, remove, or alter any existing logic, calculations, signals, alerts, or visual elements. Add only the Demand & Supply Zone boxes from a second Pine
Advanced Forex Expert Advisor-fully automated system
200 - 300 USD
I require a custom EA and an accompanying custom indicator built in MQL5 for Meta Trader 4/5. The EA must be fully automated (Algo Trading); Telegram-Signal-Linked and named 'AMK Fx'
Projektdetails
Budget
30 - 50 USD
Ausführungsfristen
bis 10 Tag(e)