 Alle Aufträge
 Regeln
Wie man einen Handelsroboter schnell bestellen kann
Lesen Sie bitte zuerst die Regeln durch
Wie man einen Handelsroboter in MQL5 und MQL4 in Auftrag gibt
Hier ist das Muster einer Anforderungsspezifikation, um einen Roboter zu bestellen
Neuer Aufträge in dieser Kategorie:
30+ USD
30+ USD
150+ USD
80 - 400 USD
30 - 50 USD
Auftrag beendet
Ausführungszeit 49 Tage

Bewertung des Kunden
best developer so far
Bewertung des Entwicklers
Thank you!
Spezifikation
This Expert Advisor (EA) is designed to operate on the XAUUSDm symbol (Gold micro), using the 1-minute timeframe as the main chart and the 5-minute timeframe as the higher timeframe.
It is built to follow the logic of the “Supertrend MTF Heikin Ashi Auto” indicator from TradingView, exactly as shown in the reference screenshot.
The EA must fully comply with all detection, validation, and execution conditions explained below.
The Expert Advisor will be accepted only if it perfectly replicates the trades generated by the TradingView indicator "Supertrend MTF Heikin Ashi Auto" on the symbol XAUUSDm (Exness account), using the 1-minute chart for entries and the 5-minute chart for higher timeframe confirmation, during the full period from 15 March 2025 to 22 April 2025. It must detect the exact same Signal Candles, correctly wait for and confirm pullbacks, and execute trades precisely at the next candle open (Ask price for Buy, Bid price for Sell). Stop Loss must match the value of the 1-minute Supertrend at the Signal Candle, and all trades must include a trailing stop loss calculated as a percentage of the original SL. All entry and exit prices must be identical to those produced by the TradingView strategy—any deviation, missed trade, or incorrect execution will result in the EA being rejected.
The EA includes user options to:
Trade Buy signals only
Trade Sell signals only
Trade both Buy and Sell signals
It also includes a Trailing Stop Loss system based on the original Stop Loss, which dynamically protects profits once the trade moves in a favorable direction.
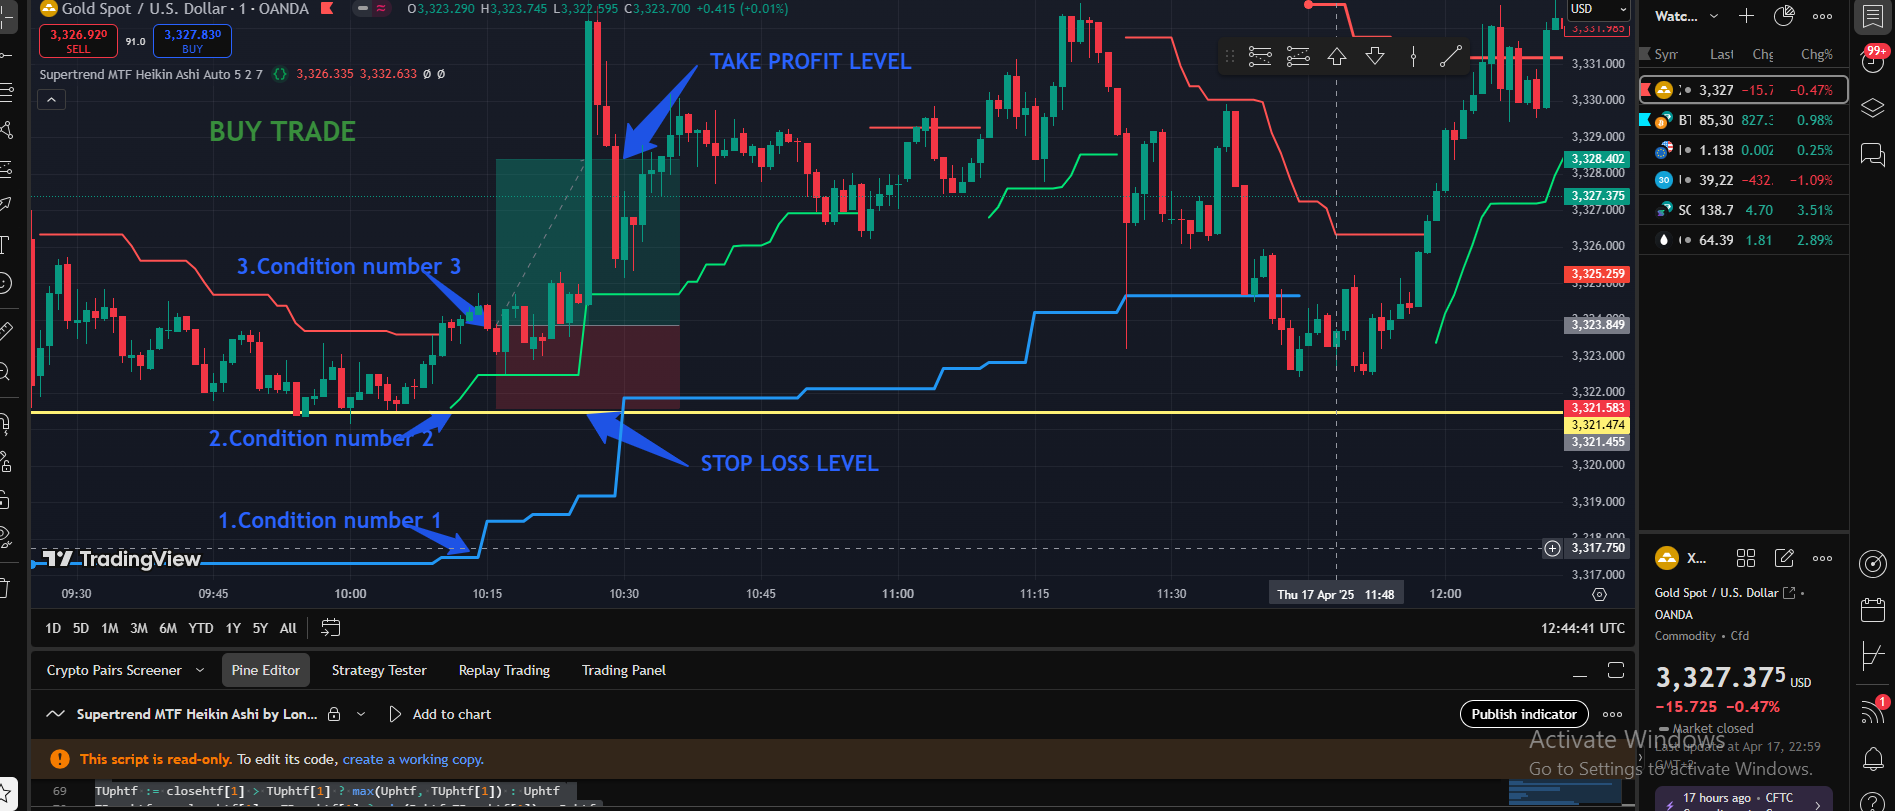
🔷 Buy Trade Setup
✅ Step 1 – Detect the Signal Candle
Monitor each new candle as it closes.
You are looking for the first candle where both of the following conditions are met :
The higher timeframe Supertrend turns bullish (a blue line appears below the same candle).
The current timeframe Supertrend also turns bullish (a green line appears below the candle).
When both conditions are met, that candle becomes the "Signal Candle."
✅ Step 2 – Record Key Values from the Signal Candle
Once the Signal Candle is identified:
Signal Close Price:
This is the closing price of the Signal Candle.
It will be used later to confirm the pullback condition.
Stop Loss Level:
This is the value of the HTF Supertrend line (blue) at the time the Signal Candle closes.
This line represents the dynamic support calculated from the higher timeframe's Heikin Ashi-based Supertrend.
This value will be used as the Stop Loss for the trade.
📌 Example:
If the HTF Supertrend value at the Signal Candle is 3321.47, that becomes your exact Stop Loss.
✅ Step 3 – Wait for a Pullback
After the Signal Candle is closed, do not enter a trade immediately.
Start monitoring the subsequent normal candles (not Heikin Ashi).
✅ Step 4 – Confirm the Pullback
For each new candle after the Signal Candle:
If a candle closes with a closing price lower than the Signal Close Price, the pullback is confirmed.
This confirms a retracement after the bullish signal.
✅ Step 5 – Execute the Buy Trade
Once the pullback candle closes below the Signal Close Price:
Enter a Buy trade immediately at market on the next candle's open using the market Ask price).
Set the Stop Loss at the HTF Supertrend line value recorded at the Signal Candle.
take profit
A Risk:Reward ratio based on the Stop Loss.
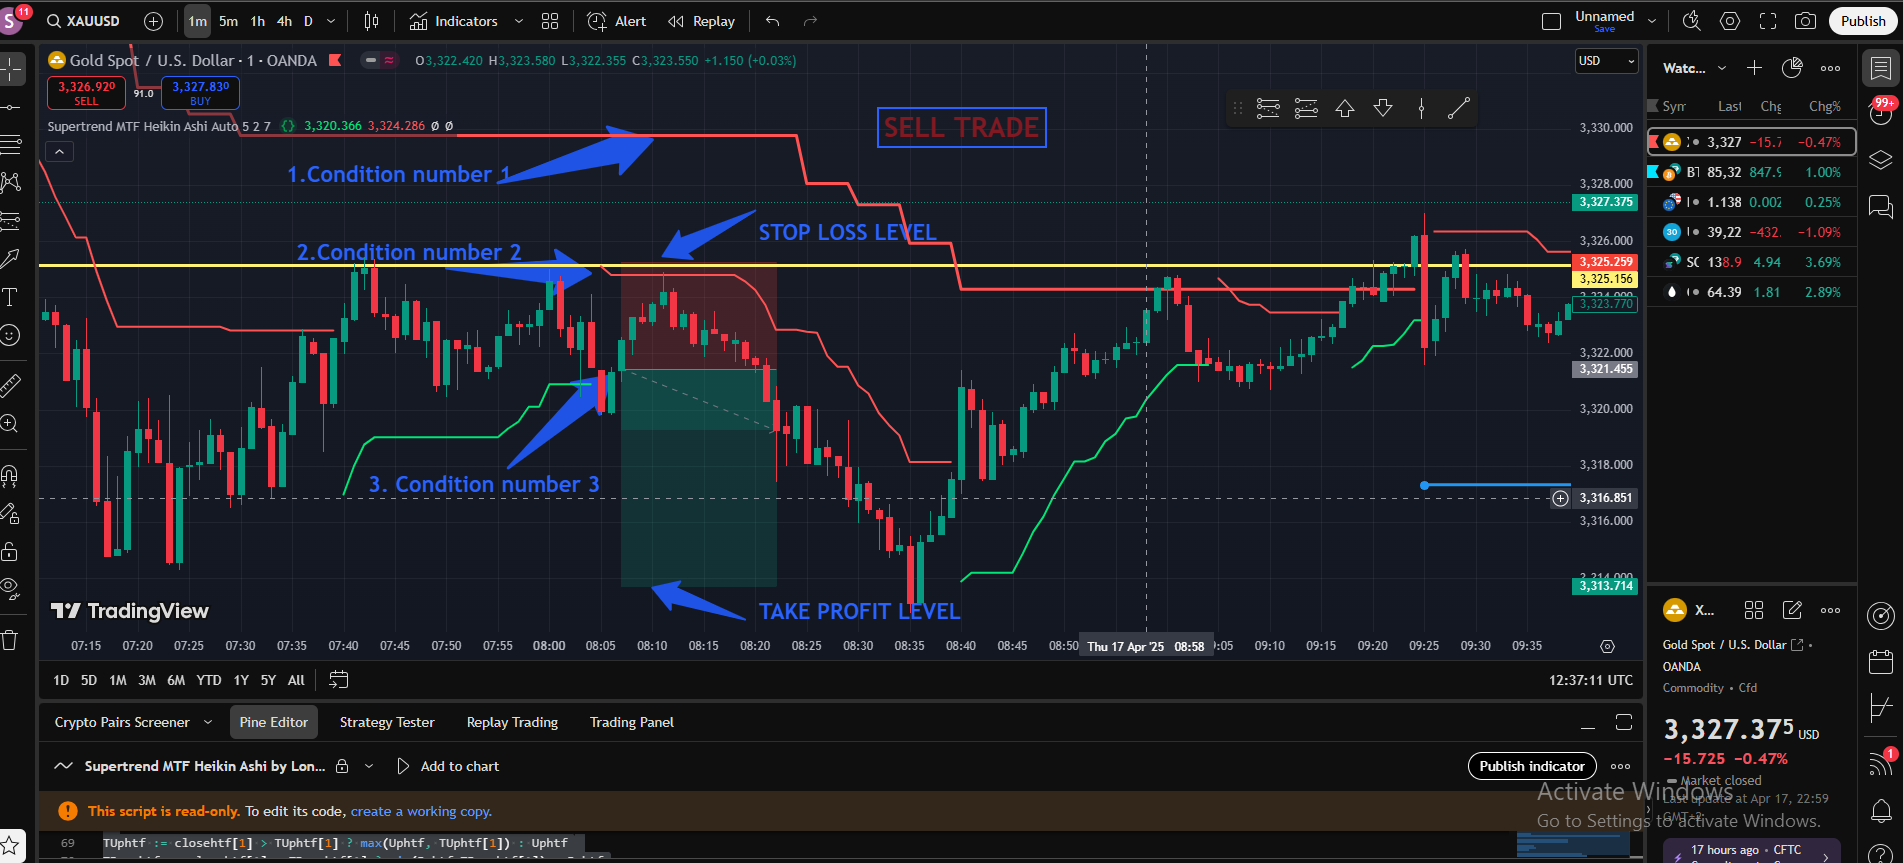
Sell Trade Setup
Step 1 – Detect the Signal Candle
Monitor each new 1-minute candle at close.
Wait for the following:
The 5-minute Supertrend is already bearish (red line above M1 candles).
Sell Trade Setup
Then, a 1-minute candle shows a new red Supertrend line above it (1-minute Supertrend turns bearish).
✅ This candle becomes the Signal Candle.
✅ Step 2 – Record Key Values
Signal Close Price → closing price of the Signal Candle.
Stop Loss → value of the 1-minute Supertrend red line at the Signal Candle close.
📌 Example: If SL = 2346.25, store that value for trade management.
✅ Step 3 – Wait for Pullback
Do not enter the trade immediately.
Watch for a candle that closes above the Signal Close Price.
✅ Step 4 – Confirm Pullback
When a candle closes above the Signal Close Price, it confirms a pullback.
✅ Step 5 – Execute the Sell Trade
Enter a Sell trade at market on the next candle open (Bid price).
Use the previously stored 1-minute Supertrend value as Stop Loss.
✅ Take Profit & Trailing Stop Loss
You must enable a Trailing Stop Loss to manage exits.
🔄 Trailing Stop Loss – Logic:
As price moves in your favor, the stop loss will trail behind price by a fixed distance.
This trailing distance is defined as a percentage of the original Stop Loss.
Supertrend MTF Heikin Ashi source code
@version=4
study("Supertrend MTF Heikin Ashi", overlay = true)
mode =input(title = "HTF Method", defval = 'Auto', options=['Auto', 'User Defined'])
//auto higher time frame
HTFo =timeframe.period == '1' ? '5' :
timeframe.period == '3' ? '15' :
timeframe.period == '5' ? '15' :
timeframe.period == '15' ? '60' :
timeframe.period == '30' ? '120' :
timeframe.period == '45' ? '120' :
timeframe.period == '60' ? '240' :
timeframe.period == '120' ? '240' :
timeframe.period == '180' ? '240' :
timeframe.period == '240' ? 'D' :
timeframe.period == 'D' ? 'W' :
timeframe.period == 'W' ? '5W' :
'D'
HTFm = input('5', title = "Time Frame (if HTF Method=User Defined)", type=input.resolution)
HTF = mode == 'Auto' ? HTFo : HTFm
Mult = input(defval = 2.0, title = "ATR Factor", minval = 0.5, maxval = 100, step = 0.1)
Period = input(defval = 7, title = "ATR Period", minval = 1,maxval = 100)
// current time frame
//Heikin Ashi high, low, close
h = security(heikinashi(syminfo.tickerid), timeframe.period, high)
l = security(heikinashi(syminfo.tickerid), timeframe.period, low)
c = security(heikinashi(syminfo.tickerid), timeframe.period, close)
//HeikinAshi atr
Atr = security(heikinashi(syminfo.tickerid), timeframe.period, atr(Period))
Up = (h + l) / 2 - (Mult * Atr)
Dn = (h + l) / 2 + (Mult * Atr)
float TUp = na
float TDown = na
Trend = 0
TUp := c[1] > TUp[1] ? max(Up,TUp[1]) : Up
TDown := c[1] < TDown[1] ? min(Dn,TDown[1]) : Dn
Trend := c > TDown[1] ? 1: c < TUp[1]? -1: nz(Trend[1],1)
Trailingsl = Trend == 1 ? TUp : TDown
linecolor = Trend == 1 and nz(Trend[1]) == 1 ? color.lime : Trend == -1 and nz(Trend[1]) == -1 ? color.red : na
plot(Trailingsl, color = linecolor , linewidth = 2, title = "SuperTrend")
// Higher Time Frame
////// HTF high, low, close
highhtf = security(heikinashi(syminfo.tickerid), HTF, high[1], lookahead = barmerge.lookahead_on)
lowhtf = security(heikinashi(syminfo.tickerid), HTF, low[1], lookahead = barmerge.lookahead_on)
closehtf = security(heikinashi(syminfo.tickerid), HTF, close[1], lookahead = barmerge.lookahead_on)
// ATR for HTF
HTfatr = security(heikinashi(syminfo.tickerid), HTF, atr(Period)[1], lookahead = barmerge.lookahead_on)
Uphtf = abs(highhtf + lowhtf) / 2 - (Mult * HTfatr)
Dnhtf = abs(highhtf + lowhtf) / 2 + (Mult * HTfatr)
float TUphtf = na
float TDownhtf = na
TrendHtf = 0
TUphtf := closehtf[1] > TUphtf[1] ? max(Uphtf, TUphtf[1]) : Uphtf
TDownhtf := closehtf[1] < TDownhtf[1] ? min(Dnhtf,TDownhtf[1]) : Dnhtf
TrendHtf := closehtf > TDownhtf[1] ? 1 : closehtf < TUphtf[1] ? -1: nz(TrendHtf[1], 1)
TrailingslHtf = TrendHtf == 1 ? TUphtf : TDownhtf
linecolorHtf = TrendHtf == 1 and nz(TrendHtf[1]) == 1 ? color.blue : TrendHtf == -1 and nz(TrendHtf[1]) == -1 ? color.red : na
st = plot(TrailingslHtf, color = linecolorHtf , linewidth = 3, title = "Supertrend HTF")
plot(TrendHtf == 1 and TrendHtf[1] == -1 ? TrailingslHtf : na, title="Supertrend HTF Trend Up", linewidth = 4, color=color.blue, style = plot.style_circles)
plot(TrendHtf == -1 and TrendHtf[1] == 1 ? TrailingslHtf : na, title="Supertrend HTF Trend Down", linewidth = 4, color=color.red, style = plot.style_circles)
//Alerts
alertcondition(Trend == 1 and Trend[1] == -1, title='Supertrend Trend Up', message='Supertrend Trend Up')
alertcondition(Trend == -1 and Trend[1] == 1, title='Supertrend Trend Down', message='Supertrend Trend Down')
alertcondition(TrendHtf == 1 and TrendHtf[1] == -1, title='Supertrend HTF Trend Up', message='Supertrend HTF Trend Upl')
alertcondition(TrendHtf == -1 and TrendHtf[1] == 1, title='Supertrend HTF Trend Down', message='Supertrend HTF Trend Down')
Bewerbungen
1
Bewertung
Projekte
0
0%
Schlichtung
1
0%
/
100%
Frist nicht eingehalten
0
Frei
2
Bewertung
Projekte
0
0%
Schlichtung
0
Frist nicht eingehalten
0
Frei
3
Bewertung
Projekte
945
47%
Schlichtung
309
58%
/
27%
Frist nicht eingehalten
125
13%
Frei
4
Bewertung
Projekte
0
0%
Schlichtung
0
Frist nicht eingehalten
0
Frei
Ähnliche Aufträge
Hello International Developer, I need LIFETIME MT5 EA for XAUUSD Gold. REQUIREMENTS: 1. Lifetime bot - No expiry date, unlimited accounts, unlimited installations 2. Must include source code .mq5 file - This makes it lifetime 3. Every trade MUST have Stop Loss 300 points and Take Profit 600 points 4. No martingale, No grid, No averaging - Clean safe strategy 5. Auto lot size = 1% risk per trade for good margin growth
Hello MQL5 Developers, I am looking for a professional, ready-made indicator for MetaTrader 5 (MT5), specifically designed or optimized for Gold (XAUUSD). Required Features: Clear BUY/SELL signals with entry prices, Stop Loss (SL), and multiple Take Profit (TP) targets drawn directly on the chart. Strong areas of interest, including support and resistance, liquidity zones, supply and demand zones, and potential
Expert advisor
150+ USD
Hiring: Forex Strategist & MQL5 Developer for Long-Term EA Development I am looking for an experienced Forex Strategist and MT5 (MQL5) Developer to work with me on an ongoing project to develop, test, improve, and optimize a profitable Forex Expert Advisor (EA). My Message to the Developer My budget is $150 . However, this is not intended to be a one-time payment for a finished product. I want an ongoing working
Hello developers,I am looking for an experienced MQL5 developer to create an EA based on Moving Average retest strategy with advanced recovery system.The concept is simple: Entry is based on MA close and retest. Initial trade has small TP and no SL.If price goes against the initial position, the EA should manage it using:Opposite hedge tradePending limit grid systemBasket take profitMartingale lot multiplier after
MT5 to MEXC web trading
50+ USD
Hi gentlemen, I want MT5 market orders placed (open and close orders) on MEXC trading through web browser. MEXC doesnt allow algo trading. - Need source code budget: USD 50 (quote me your price and delivery time) I need this at the earliest and this job is only for mexc.com, not binance or any other exchange I look forward to your price offer and your suggestions. Appreciate
Automate this Video Strategy
35 - 100 USD
https://www.youtube.com/watch?v=xMNx8f-aGQE& ;t=56s risk 1% per trade watch the video carefully and automate the trade setups in XAUUSD i prefer picking the least drawdown and good return expert advisor do not use overfitting(Strict) account type : hedging
Custom MT5 Trading Robot for Gold and Forex
200 - 300 USD
Project: Custom MT5 Day Trading Expert Advisor I need a custom automated trading robot (EA) for MetaTrader 5, developed in MQL5. Markets: - Gold (XAUUSD) - Selected Forex pairs Trading style: Automated day trading. All positions should be closed according to predefined strategy rules and before the end of the selected trading session. Strategy: The developer should propose a clear trading strategy, explain its rules
Ninjascript strategy tester
30+ USD
Hi, I need NinjaTrader 8 Strategy Analyzer backtests on two of my strategies, each over 1 year AND 3 years of data. Please quote the full job. Common settings: NT8 Strategy Analyzer, MCL (Micro WTI Crude Oil) continuous front-month contract (MCL ##-##), 5-minute bars, 1yr + 3yr of the most recent data, $2.50 round-turn commission per contract. Deliverables per run: full Strategy Analyzer summary (net profit, profit
a { text-decoration: none; color: #464feb; } tr th, tr td { border: 1px solid #e6e6e6; } tr th { background-color: #f5f5f5; } Project Description I need an Expert Advisor (EA) for MetaTrader 5 (MT5) that can automatically trade Gold (XAUUSD) and major Forex pairs. The EA must analyze market conditions, open and close trades automatically, manage risk effectively, and be fully compatible with the MT5 Strategy Tester
EA-MT5-XAUUSD-PuPrime-Live6 +10%/m
30 - 200 USD
I am looking for an EA using MT5, trading XAUUSD on PuPrime-Live6, Standard account. LIMITATIONS No martingale, no grid. Start equity 1000 EUR. Leverate 1:500 Account in USD. PuPrime-Live6 All settings (risk, time, drawdown %, cooldown, lot size) shall be adjustable on init or backtest. VERIFICATIONS The EA needs to reach the profit goals on Actual Ticks, 100ms slippage in backtests for each month 2026. profit goal
Projektdetails
Budget
60+ USD
Ausführungsfristen
bis 15 Tag(e)