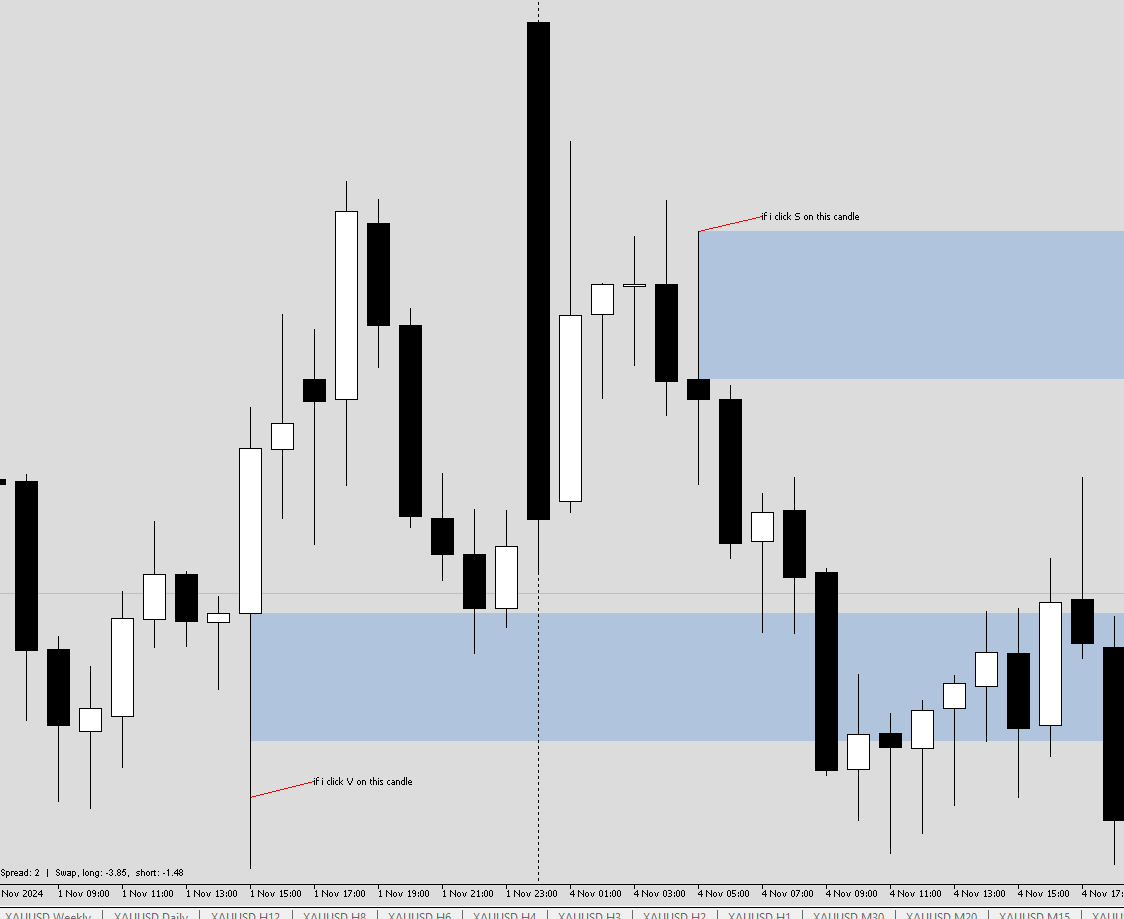
To develop a script that upon pressing a shortcut key, and clicking on a specific candle, an object(rectangle) is to be drawn on the chart on that specific candle.
I have the source code examples to aid in the development of this indicator as attached. You just need to use the onchartevent click and drawing of objects. No logic/validation is required.
**to use the example indicator attached, once loaded, press "Z" and click anywhere on the chart. it will plot rectanglse 200 bars to the left based on the place you've clicked. What i need is just plot the rectangle based on that Candle i have clicked. Strictly.
Detail Specifications
Part 1
- Assign 2 x hotkey "S" and "D" where S plots a rectangle on the upper wick(high to mathsMax value) and D plots a rectangle on the lower wick(mathsMin to low value)
- When i press S and click on a specific candle, a rectangle shall be drawn on the upper wick "zone" and extended to the right side of chart(source code provided on the object extension)
- When i press D and click on a specific candle, a rectangle shall be drawn on the lower wick "zone" and extended to the right side of chart(source code provided on the object extension)
- Assign 2 x hotkey "C" and "V" where C plots a rectangle on half of the upper wick((high-mathsMax/2) + mathsMax to mathsMax) and C plots a rectangle on the lower wick(mathsMin to (mathsmin-low/2)+low)
- When i press C and click on a specific candle, a rectangle shall be drawn on the upper wick "zone" and extended to the right side of chart(source code provided on the object extension)
- When i press V and click on a specific candle, a rectangle shall be drawn on the lower wick "zone" and extended to the right side of chart(source code provided on the object extension)
-Individually all 4 hotkeys shall have input parameters to determine color, style, line thickness
- a global input to choose if all rectangles created shall be unselectable or selectable
- a user input parameter to determine how long the extension of the rectangle is to the right
- a global delete hotkey "x" to delete all rectangles created using SDCV
- the indicator shall be able to "refresh" itself if i click it on the same candle again. For example, if a live candle is still running and have yet to close, and i clicked and plotted, the rectangle zone may not be the same as when the candle closed.
Also, if a rectangle is drawn already, there should not be a duplicate rectangle plotted/overlapped if i clicked on the same candle again.
Ähnliche Aufträge
Platform MetaTrader 5 (MT5) MQL5 Source Code Required Compatible with Exness MT5 both standard and cent accounts/ICMarket accounts Works on EUR/USD only (initial version) ⸻ Objective Develop a fully automated AI Expert Advisor based on ICT Smart Money Concepts (SMC). The EA must only execute high-probability trades that satisfy all required conditions before opening a position. The EA must avoid overtrading and
Bonjour, je recherche un développeur MQL5 expérimenté pour créer un Expert Advisor pour MetaTrader 5 basé sur une stratégie de trading intégrant des principes de gestion des risques rigoureux et d'intelligence financière. Le robot doit être capable de gérer plusieurs paires de devises et d'optimiser automatiquement les entrées et sorties en fonction de conditions de marché prédéfinies."
Hello everybody, I'm looking for an experienced MQL4/MQL5 developer to optimize a High-Frequency Trading (HFT) Expert Advisor for both MT4 and MT5. The EA performs consistently and profitably on demo accounts, but when it is run on Raw and Standard live accounts under what appear to be the same trading conditions, it begins generating losses. I do not have the original source code (.mq4/.mq5); I only have the
I'm looking for an experienced NinjaTrader 8 (C#) developer to build a fully automated futures trading strategy. Please apply only if you have proven experience developing and testing NinjaTrader strategies. Project Overview Develop a fully automated NinjaTrader 8 strategy. Designed for Apex funded and evaluation accounts. Primary instruments: NQ/MNQ Futures (with flexibility to support other futures later). Trading
Hello I need to purchase the source code of an already built profitable mt5 EA with proven track recordIf you have something similar and you are open to selling the source code please apply to this post Please note I am not looking for a dev to build the product from scratch , but need something that is already built and have at least one year worth of track record
I need an Expert Advisor for MT5 on XAUUSD 1min timeframe using SMC concepts. STRATEGY RULES: SELL: 1. Identify previous day High/Low as liquidity 2. Entry only during London-NY session: 15:00-19:00 GMT+3 or broker clock. 3. If price sweeps previous day High and closes back below it 4. Check for bearish 1min FVG below sweep candle 5. Wait for BOS - lower low 6. Entry: Sell/buy at 50% of the FVG 7. SL: 10 pips above
Code An Loss Rate 90-100% MT5 EA , that can blow a 100 USD account a day ,with fixed TP of 3000 points and SL of 3000 For better Rate Calculations get an strategy that can lead to so
Makes it takes trades by it self buy and sell, it must use the higher signals, also when I press stop it must not pick any trades I want it to take trades automatically when I press start also close by it self
I am looking for an experienced MQL4/MQL5 HFT developer to build or optimize a High-Frequency Trading (HFT) Expert Advisor that can successfully pass proprietary trading firm challenges and perform consistently under live trading conditions with brokers such as 8cap or BlackBull Markets . The developer should have proven experience with HFT execution, ultra-low-latency trading, broker execution, slippage, spreads
I need a professional MT5 Expert Advisor (MQL5) for XAU/USD (Gold) only. Requirements: - Symbol: XAU/USD only - Timeframe: H1 trend, M5 entry - Smart Money Concept (SMC) - Liquidity Sweep - Break of Structure (BOS) - Order Block Retest - Confirmation Candle (Engulfing or Pin Bar) - ATR-based Stop Loss - Risk:Reward = 1:3 (adjustable) - Auto Lot (1% risk) - Break Even - Trailing Stop - Maximum 2 trades per day - One