• 信息
12+ 年
经验
60
产品
32
演示版
0
工作
0
信号
0
订阅者
所有产品 ▶️ https://www.mql5.com/ru/users/zombiezorrofx/seller

🔥 佣金最高折扣:
💠 Binance 35%(规避制裁的交易)
💠 Bybit 10%(佣金从0.014%降低)
💠 OKX 45%(交易所20% + Tiger 25%)
+ 免费 Tiger 加密终端

在 Tiger Broker 注册并使用促销代码 cryptopsih
https://zombiezorrofx.blogspot.com/p/blog-page_11.html

Telegram频道 ▶️ @sft_official ( https://t.me/sft_official )
博客 ▶️ https://zombiezorrofx.blogspot.com
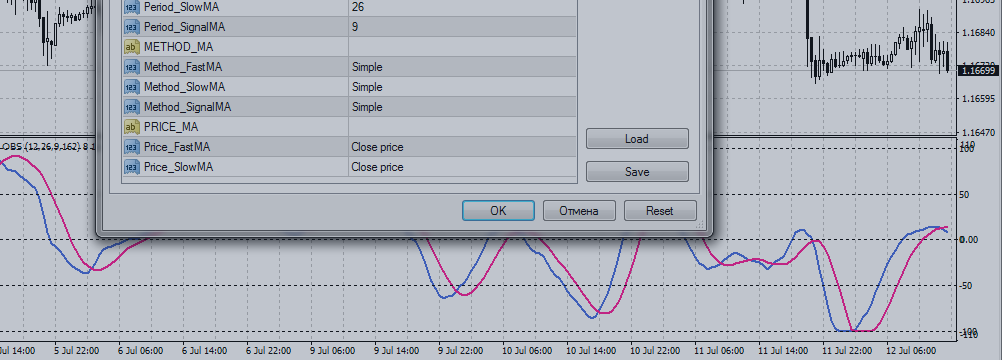
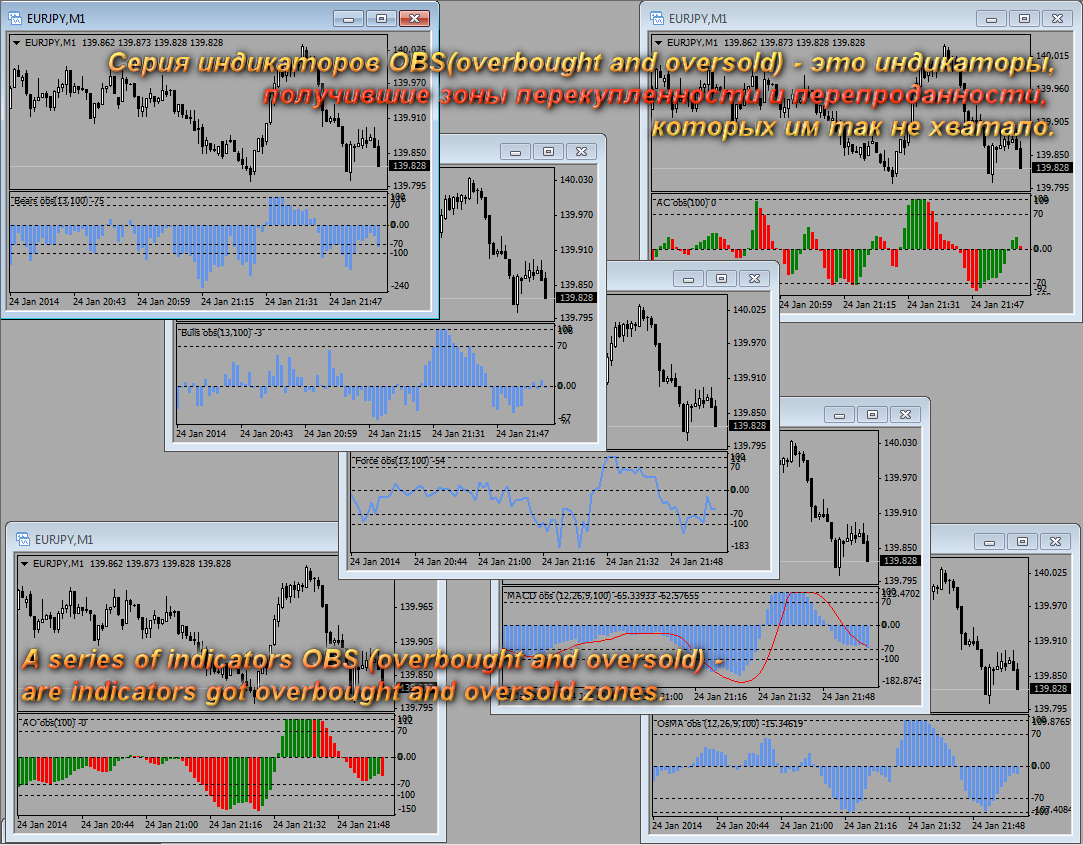
__________________________________

专业的外汇交易软件。
交易程序——指标、信号、顾问以及交易系统,为您带来自信和盈利的交易体验。
#SFT #sureforextrading #zombiezorrofx
Artem Kuzmin
SFT Full MACD overbought and oversold | Forex Indicator for MT4 Indicator, which is more informative, thanks to overbought and oversold levels - for a more accurate representation of the situation on the market...
Artem Kuzmin 已发布产品

75.00 USD

A classic indicator with advanced features for more accurate display of the market situation. All settings of all moving averages are available, such as the moving average type and the priced used in its calculation. It is also possible to change the appearance of the indicator - line or histogram. Additional parameters provide the ability of fine tuning. Distinctive features Does not redraw. Additional parameters for fine tuning. Displayed as a line or as a histogram. Works on all timeframes

Artem Kuzmin 已发布产品

67.00 USD

Opening positions in the direction of the trend is one of the most common trading tactics. The main idea is that the probability of the trend continuation is higher than that of its change. This indicator determines the direction of a local movement, marking the beginning of a trend with a large dot and its continuation with a line of the corresponding color. Distinctive features No Repaint. Simple and accurate settings. Clear and understandable signals. Works on all timeframes and symbols

Artem Kuzmin
Artem Kuzmin
A series of OBS indicators (overbought and oversold) are indicators that have received overbought and oversold zones, which they so lacked.
http://bit.ly/2HV5y94

Серия индикаторов OBS (overbought and oversold) - это индикаторы, получившие зоны перекупленности и перепроданности, которых им так не хватало.
http://bit.ly/2HV5y94

#SFT #sureforextrading
Artem Kuzmin 已发布产品

The support and resistance levels are among the main components of the entire technical analysis. They are used both by professional traders and by beginners. Prices usually move within the price channels. The upper boundary of such a channel is called resistance, and the lower one is support. This indicator plots fractal support and resistance lines at the highest and lowest local price values (fractals). Distinctive features Does not redraw. Clear and understandable signals. It is possible to

Artem Kuzmin
SFT Fractal Support and Resistance https://mql5.com/3gjtw The levels of support and resistance are one of the main components of all technical analysis. They are used both by professional traders and by beginners...
· 2 2746
Artem Kuzmin 已发布产品

This is a moving average which can move not only to the right/left, but also up/down. You can also select a mode of displaying the indicator (as a line or as dots) and all other settings of a standard moving average. If you overlay several indicators in one window, you can clearlier determine price channels setting each border individually. Settings Line_or_Dot - mode of displaying the indicator: true - as a line, false - as dots; MA_period - moving average period; MA_shift_X - number of candles

Artem Kuzmin 已发布产品

56.00 USD

The indicator colors bars displaying prices of overbought and oversold areas on the chart. It will help you to estimate moments when market climate changes and the price has its local extreme values. It can be used both independently and as a good supplement to any channel trading system. And this indicator is easy-to-use in expert advisors due to usage of indicator buffers instead of graphical objects. Settings ExtPeriod = 100 — indicator period; Sensitivity = 80 — indicator sensitivity

Artem Kuzmin 已发布产品
评论: 1
63.00 USD

The indicator is designed for visual determining market directions. It allows to determine the distance from a price and helps in drawing correct conclusions. Perfectly defines flat zones, horizontal intraday trends and trend movements, and an additional setting allows to use the indicator on any instrument. Does not redraw its readings. You get professional trading indicator for a reasonable price. Settings: Period_FF = 7 - indicator period Sensitivity_FF = 5 - sensitivity in % Wish you all

Artem Kuzmin 已发布产品

62.00 USD

This is an indicator for additional signal filtering. It can be used as an additional filter in a trading system. The indicator does not redraw its data and can be used both in forex trading and with binary options. It has 3 operation modes and flexible sensitivity settings. The indicator uses multiple buffers, therefore it can be easily used in various Expert Advisors

Artem Kuzmin 已发布产品

The indicator builds fractals on extrema of the OsMA indicator Appears on the chart as a fractal or a fractal channel. It has a flexible setting and, in contrast to the standard fractals, lags only by 1 bar. Settings: DeepBars - the indicator's depth of display; Sensitivity_1_or_2 - 1 - for small periods of OsMA, 2 - for large periods; Arrow_or_channel - display on the chart fractals or channel; FastMA - period of the fast moving average;  SlowMA - period of slow moving average; 

Artem Kuzmin 已发布产品

70.00 USD

An indicator for entering with trend and timely exiting. It has sensitivity setting, by adjusting which it can be applied to both long-term and short-term speculation.  The highest sensitivity = 1, with this setup, you can even scalp on M1. No lag, does not withdraw after candlestick closure.  One of the use options: enter after a candlestick closes, if the vertical line consists of squares of the same color; exit if the color of two or more squares changes. Before using it, be sure to

Artem Kuzmin 已发布产品

The indicator is based on pair trading methods. It is not redrawn unlike similar indicators. Shows correlation between two selected instruments in percent for a predetermined period, and the positions of the instruments relative to each other. Has a function for reverse display of any of the analyzed symbols - for instruments with negative correlation. Can be drawn as a line or as a histogram. Settings: Symb1 - first symbol name. Revers1 - reverse display of the first symbol. Symb2 - second

Artem Kuzmin 已发布产品

Awesome oscillator with overbought and oversold zones. A series of OBS indicators (overbought and oversold) - these are indicators enhanced with overbought and oversold zones. This makes it possible to determine when the instrument is trending, as well as when it is flat. Works on all timeframes, all currency pairs, metals and cryptocurrencies. Can be used with binary options. Settings OBS Period - period of overbought and oversold calculation

Artem Kuzmin 已发布产品

显著指标计算的价格水平,如果红的水平,那么价格将其分解,如果蓝到了。如果价格接近蓝色级别低于他的罢工toskoree总价,如果顶部更容易从水平反弹。同样,如果价格移动到红色顶层,它很可能是故障的水平,如果低于,则有可能反弹。 因为酒吧的水平已失去意义从计划中删除后得出水平等于CalculationBars 。 非常适合用于交易市场上挂单:停止改正的趋势和限制, SL和TP水平下一个最低/最高价格设定。与此交易建议的比例SL / TP为不小于1/2。     设置及说明: CalculationBars - 酒吧来计算的水平; LineLength -个长度的线棒; Filtr- 滤噪平滑的价格,价值较低的级别越高( 1 〜100 ) ; UpColor -色水平,该价格打破了; DnColor - 色水平,该价格打破了; LineWidth- 线宽,线的粗细;

Artem Kuzmin 已发布产品

Accelerator indicator with overbought and oversold zones. A series of OBS indicators (overbought and oversold) - these are indicators enhanced with overbought and oversold zones. This is the standard indicator, but it provides additional possibilities for the analysis of any market. Thanks to a special algorithm, this indicator has overbought zones =70 and =100, as well as oversold zones -70 and -100, which allows you to use it to determine the possible reversal or pullback of the price, as well

Artem Kuzmin 已发布产品

The Bears indicator with overbought and oversold zones. Two display options - as a line and as a histogram.  A series of OBS indicators (overbought and oversold) - these are indicators enhanced with overbought and oversold zones. This is the standard indicator, but it provides additional possibilities for the analysis of any market. Thanks to a special algorithm, this indicator has overbought zones =70 and =100, as well as oversold zones -70 and -100, which allows you to use it to determine

Artem Kuzmin 已发布产品

指标提供良好的信号,趋势反转 或离开该单位时,价格变动的可能方向。 功能和设置: Sensitivity       = 3         - (下图中为例)的多个信号的灵敏度为1〜 5 ,较高的值; DeepBars        = 3000 - 深度计显示; ZeroBarCalc     = FALSE;  - 用于在零杆的计算,如果是这样的信号将被使用,但目前的蜡烛结束前可能会消失; UseAlert          = FALSE;   - 包容警告; AlertSound      = TRUE;   - 声音; AlertMessage = TRUE;         - 显示; AlertMail          = FALSE;

Artem Kuzmin 已发布产品

Bulls indicator with overbought and oversold zones. Two display options - as a line and as a histogram. OBS (overbought and oversold) indicator series - are indicators that have been provided with overbought and oversold zones. This is the standard indicator, but it provides additional possibilities for the analysis of any market. Thanks to a special algorithm, this indicator has overbought zones =70 and =100, as well as oversold zones -70 and -100, which allows you to use it to determine the

Artem Kuzmin 已发布产品

The Force Index indicator with overbought and oversold zones. Two display options - as a line and as a histogram.  A series of OBS indicators (overbought and oversold) - these are indicators enhanced with overbought and oversold zones. Settings OBS Period - overbought/oversold calculation period Force Period - period of Force Price MA - prices for MA calculation Method MA - MA calculation method Line or Histo - display by line or histogram