Edvinas Jakas / 个人资料
- 信息
|
不
经验
|
5
产品
|
17
演示版
|
|
0
工作
|
0
信号
|
0
订阅者
|
Founder
在
MQL Workshop
Edvinas Jakas
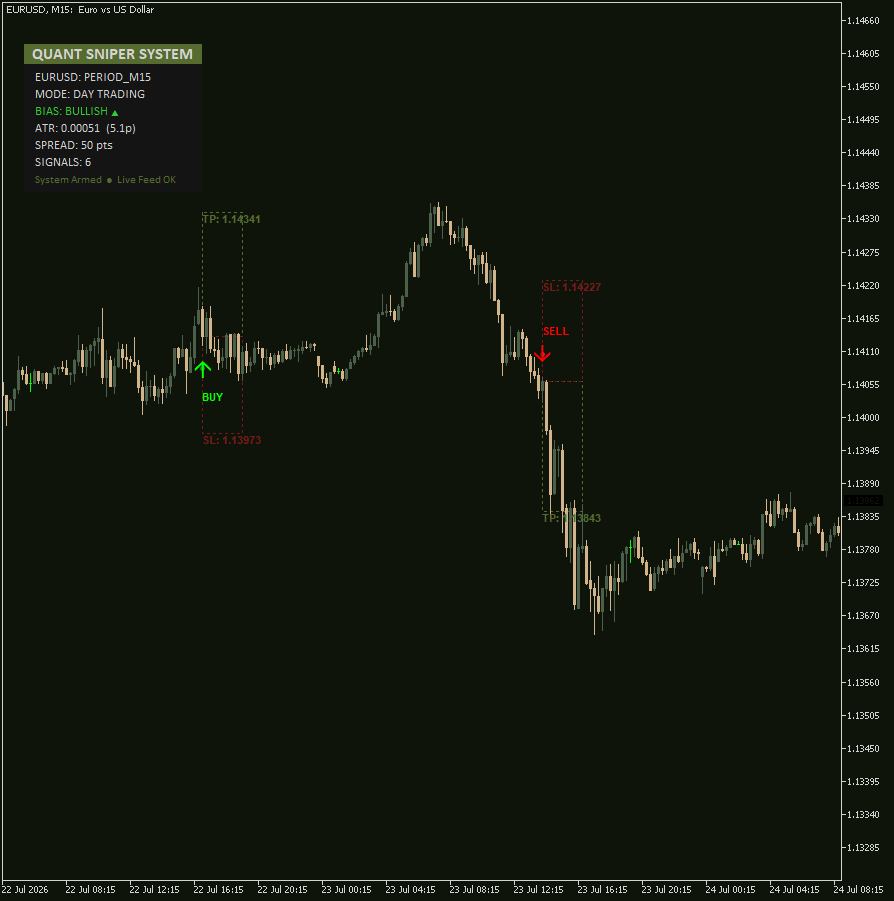
Precision Trading Made Simple Say hello to the free Quant Sniper System for MetaTrader 5—a high-precision technical analysis engine designed to give clear, non-repainting trade entries with automated risk and reward projections . Take a look at this recent setup on the EURUSD M15 chart...
分享社交网络
99
Edvinas Jakas
Quant Sniper System 👉 https://www.mql5.com/en/market/product/184693
2/2 Wins on EURUSD delivering +40 pips!
👉MQL Workshop
You are invited to follow the daily activities and updates of our projects.
https://www.mql5.com/en/channels/mqlworkshop
2/2 Wins on EURUSD delivering +40 pips!
👉MQL Workshop
You are invited to follow the daily activities and updates of our projects.
https://www.mql5.com/en/channels/mqlworkshop
Edvinas Jakas
Hello Traders! Big drop on EURUSD today - but why?
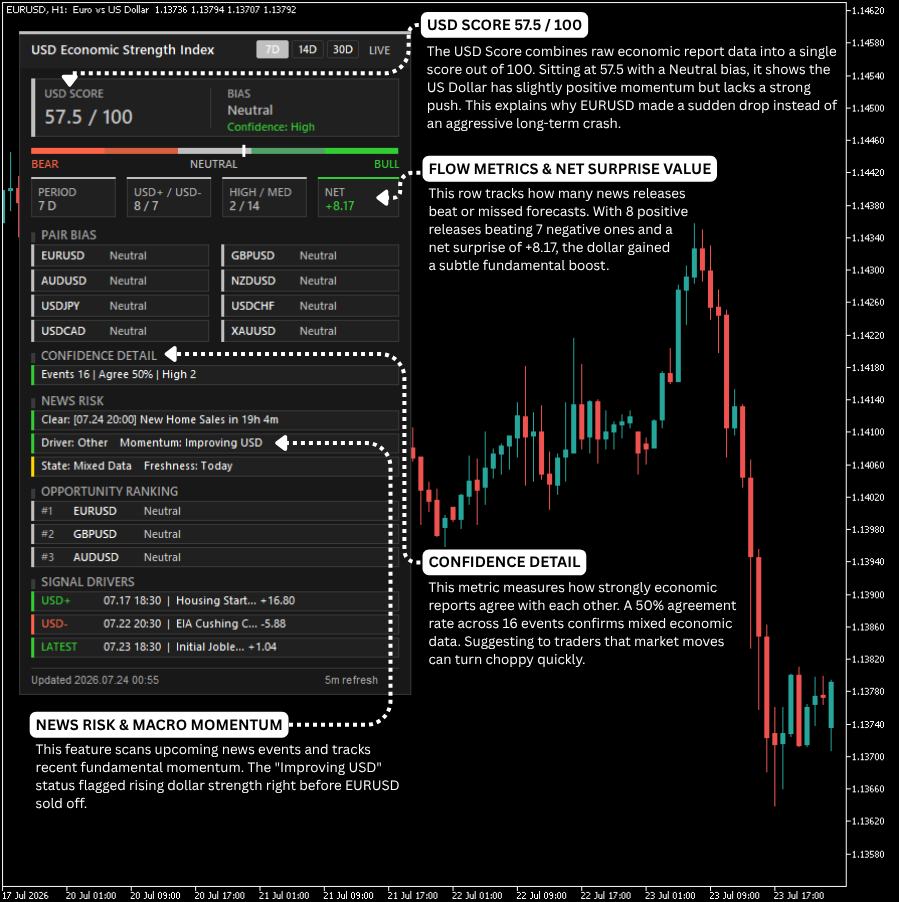
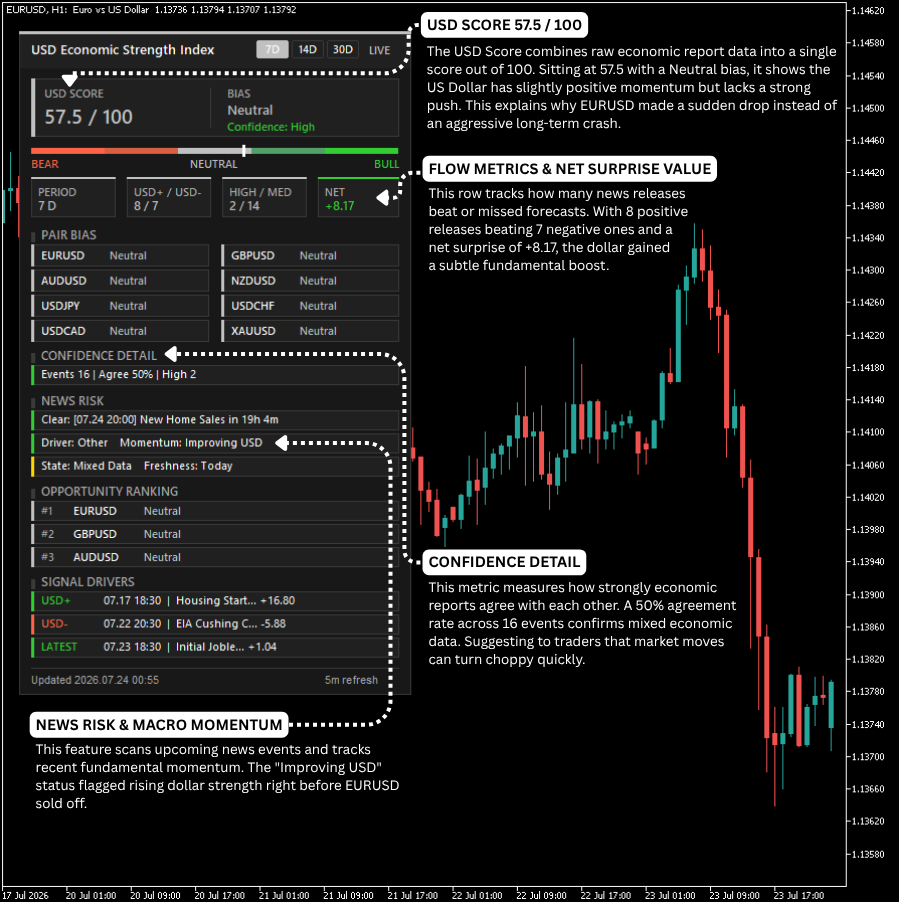
Here is how the USD Economic Strength Index revealed the exact fundamental catalyst before EURUSD dropped today:
👉 USD Score Baseline (57.5 / 100): Showed the dollar gaining quiet underlying strength.
👉 Flow Metrics (NET +8.17): Confirmed economic data releases were consistently beating forecasts, building hidden buying pressure for the USD.
👉 Signal Drivers (Momentum: Improving USD): Isolated positive releases in Housing Starts (+16.80) and Jobless Claims (+1.04), proving the drop was backed by real institutional cash—not random market noise!
👉 Educational Tip: Technical analysis shows where price has been, but fundamental data reveals where price has to go. Smart traders track economic surprise values to trade with institutional momentum, not against it!
Trade with real fundamental data on your side: 👉 https://www.mql5.com/en/market/product/182259
Here is how the USD Economic Strength Index revealed the exact fundamental catalyst before EURUSD dropped today:
👉 USD Score Baseline (57.5 / 100): Showed the dollar gaining quiet underlying strength.
👉 Flow Metrics (NET +8.17): Confirmed economic data releases were consistently beating forecasts, building hidden buying pressure for the USD.
👉 Signal Drivers (Momentum: Improving USD): Isolated positive releases in Housing Starts (+16.80) and Jobless Claims (+1.04), proving the drop was backed by real institutional cash—not random market noise!
👉 Educational Tip: Technical analysis shows where price has been, but fundamental data reveals where price has to go. Smart traders track economic surprise values to trade with institutional momentum, not against it!
Trade with real fundamental data on your side: 👉 https://www.mql5.com/en/market/product/182259
Edvinas Jakas
Ever spot a perfect chart setup, place your trade, and watch it immediately blow past your stop loss?
It happens to almost every retail trader. You draw support lines, watch candle patterns, and wait for breakouts. Yet the market keeps trapping you.
Here is the hard truth: Technical analysis alone is not enough.
Charts show you price movement, but they never tell you why price is moving. The real fuel behind every currency move is fundamental data. Major reports like inflation, jobs data, and interest rates drive the big market trends.
Tracking all those economic reports manually is overwhelming. Reading complex release sheets, calculating surprise factors, and comparing numbers takes hours. Most traders simply do not have the time.
That is where the USD Economic Strength Index changes everything.
The Macro Cheat Code for MetaTrader 5
This indicator translates complex macroeconomic data into instant, clear signals right on your MT5 chart. No news websites. No manual math. Just pure market truth.
Here is how it simplifies fundamentals for you:
USD Score (0-100): Gives you a clean health check on the US Dollar. A score around 50 means a balanced market, while higher numbers show clear USD strength.
Real-Time Market Bias: Instantly tells you if the dollar is Bearish, Neutral, or Bullish.
Data Flow Breakdown (USD+ / USD-): Shows you exactly how many economic reports beat expectations versus how many missed.
Pair Bias Grid: Translates USD strength across major pairs like EURUSD, GBPUSD, and Gold automatically.
News Risk Warnings: Live caution alerts pop up before high-impact news hits, protecting you from sudden price spikes.
See It in Action
Look at the EURUSD chart below. Price consolidates and suddenly breaks down hard.
Without fundamental data, you are left guessing. With the USD Economic Strength Index, you see a 57.5 USD Score, a positive +8.17 NET surprise score, and an Improving USD momentum status. You know the dollar is gaining real strength behind the scenes.
Instead of getting caught on the wrong side of the market, you trade with real fundamental backing.
Stop trading blindfolded with technicals alone. Align your trades with institutional money today.
🚀 Get Your Edge Today
Purchase the Indicator: https://www.mql5.com/en/market/product/182259
Join the Community: https://www.mql5.com/en/channels/usdindex
It happens to almost every retail trader. You draw support lines, watch candle patterns, and wait for breakouts. Yet the market keeps trapping you.
Here is the hard truth: Technical analysis alone is not enough.
Charts show you price movement, but they never tell you why price is moving. The real fuel behind every currency move is fundamental data. Major reports like inflation, jobs data, and interest rates drive the big market trends.
Tracking all those economic reports manually is overwhelming. Reading complex release sheets, calculating surprise factors, and comparing numbers takes hours. Most traders simply do not have the time.
That is where the USD Economic Strength Index changes everything.
The Macro Cheat Code for MetaTrader 5
This indicator translates complex macroeconomic data into instant, clear signals right on your MT5 chart. No news websites. No manual math. Just pure market truth.
Here is how it simplifies fundamentals for you:
USD Score (0-100): Gives you a clean health check on the US Dollar. A score around 50 means a balanced market, while higher numbers show clear USD strength.
Real-Time Market Bias: Instantly tells you if the dollar is Bearish, Neutral, or Bullish.
Data Flow Breakdown (USD+ / USD-): Shows you exactly how many economic reports beat expectations versus how many missed.
Pair Bias Grid: Translates USD strength across major pairs like EURUSD, GBPUSD, and Gold automatically.
News Risk Warnings: Live caution alerts pop up before high-impact news hits, protecting you from sudden price spikes.
See It in Action
Look at the EURUSD chart below. Price consolidates and suddenly breaks down hard.
Without fundamental data, you are left guessing. With the USD Economic Strength Index, you see a 57.5 USD Score, a positive +8.17 NET surprise score, and an Improving USD momentum status. You know the dollar is gaining real strength behind the scenes.
Instead of getting caught on the wrong side of the market, you trade with real fundamental backing.
Stop trading blindfolded with technicals alone. Align your trades with institutional money today.
🚀 Get Your Edge Today
Purchase the Indicator: https://www.mql5.com/en/market/product/182259
Join the Community: https://www.mql5.com/en/channels/usdindex
Edvinas Jakas
Ever spot a perfect chart setup, place your trade, and watch it immediately blow past your stop loss? It happens to almost every retail trader. You draw support lines, watch candle patterns, and wait for breakouts. Yet the market keeps trapping you...
分享社交网络
67
Edvinas Jakas
Most traders stare at charts all day long. They draw support lines, spot patterns, and wait for breakouts.
Then the market traps them.
If you only use technical analysis, you are flying blind. Charts only show you price action, but they never show you why the price is moving. The real fuel behind every currency move is fundamental data.
Economic reports like inflation, employment, and central bank decisions dictate the true direction of the market. But reading and tracking all of that data manually is nearly impossible for the average trader.
That is why most traders fail. They fight the macro trend without even knowing it exists.
The USD Economic Strength Index solves this exact problem .
This powerful MQL5 tool cuts through the noise . It tracks and processes real-time macroeconomic data automatically .
USD Score Baseline: A clean metric out of 100 showing true dollar strength .
Market Bias: Instantly tells you if the dollar is neutral, bullish, or bearish .
Pair Breakdown: Maps out real-time bias across major assets like GBPUSD, EURUSD, and Gold .
News Risk Protection: Alerts you to high-impact events so surprise spikes never wreck your open trades .
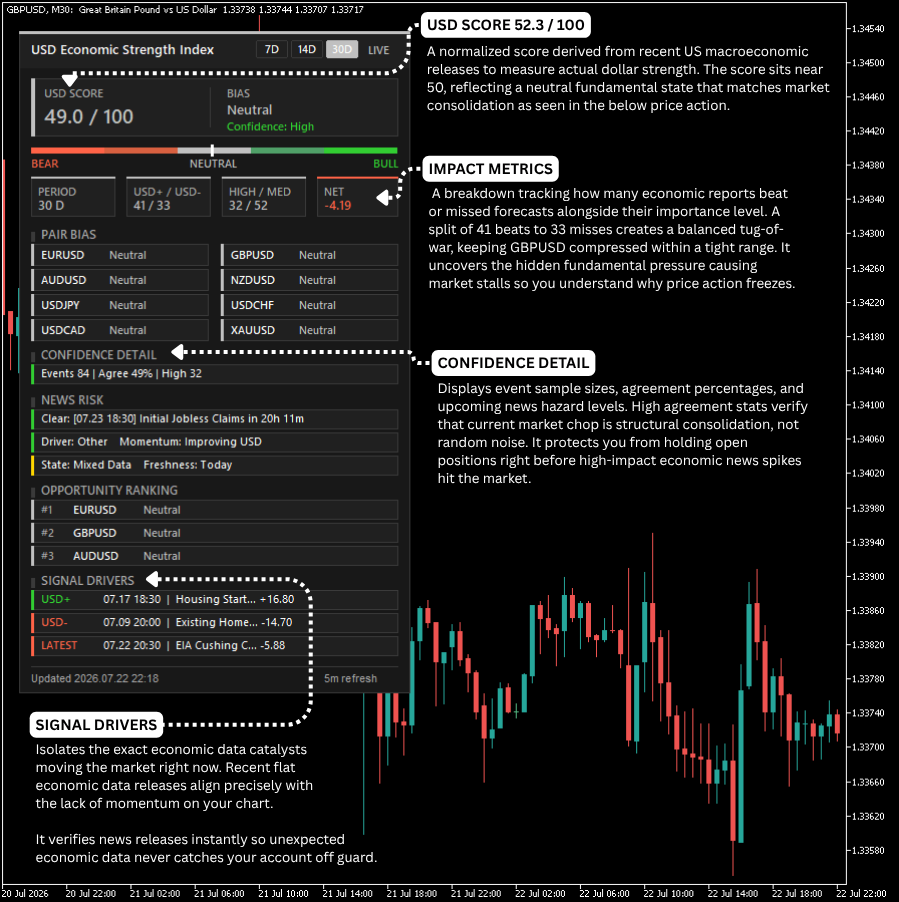
Look at the GBPUSD chart below. When price action turns choppy and goes sideways, the indicator's neutral bias and high-confidence data instantly explain why . It keeps you out of fake breakouts and protects your capital .
Stop guessing what the market will do next. Trade with institutional data on your side.
👉 Get the tool now: https://www.mql5.com/en/market/product/182259
👉 Join the community: https://www.mql5.com/en/channels/usdindex
Then the market traps them.
If you only use technical analysis, you are flying blind. Charts only show you price action, but they never show you why the price is moving. The real fuel behind every currency move is fundamental data.
Economic reports like inflation, employment, and central bank decisions dictate the true direction of the market. But reading and tracking all of that data manually is nearly impossible for the average trader.
That is why most traders fail. They fight the macro trend without even knowing it exists.
The USD Economic Strength Index solves this exact problem .
This powerful MQL5 tool cuts through the noise . It tracks and processes real-time macroeconomic data automatically .
USD Score Baseline: A clean metric out of 100 showing true dollar strength .
Market Bias: Instantly tells you if the dollar is neutral, bullish, or bearish .
Pair Breakdown: Maps out real-time bias across major assets like GBPUSD, EURUSD, and Gold .
News Risk Protection: Alerts you to high-impact events so surprise spikes never wreck your open trades .
Look at the GBPUSD chart below. When price action turns choppy and goes sideways, the indicator's neutral bias and high-confidence data instantly explain why . It keeps you out of fake breakouts and protects your capital .
Stop guessing what the market will do next. Trade with institutional data on your side.
👉 Get the tool now: https://www.mql5.com/en/market/product/182259
👉 Join the community: https://www.mql5.com/en/channels/usdindex
Edvinas Jakas
Most traders stare at charts all day long. They draw support lines, spot patterns, and wait for breakouts. Then the market traps them. If you only use technical analysis, you are flying blind. Charts only show you price action, but they never show you why the price is moving...
分享社交网络
82
Edvinas Jakas
Most traders rely purely on technical analysis. They stare at charts, draw lines, and look for patterns. But they still lose money. Why? Because charts only show half the story. The real driving force behind the market is fundamental data...
分享社交网络
94
Edvinas Jakas
Community MQL5 Channel More Information About Product The Problem With Trading Technicals 📉 Let’s be honest. Trading Gold (XAUUSD) using only technical charts is a great way to trade, but its not enough. If you look at the chart above, price action is choppy, messy, and stuck in a tight range...
分享社交网络
108
Edvinas Jakas
Why Range Trading Support and Resistance Works Best in Neutral Markets >>>>>>Join MQL5 Channel<<<<<< Trading support and resistance can be tricky when market direction is unclear...
分享社交网络
145
Edvinas Jakas
Trade Smarter, Not Harder Are you tired of technical charts giving you mixed signals? Most traders rely only on price, but the real market moves are driven by economic data...
分享社交网络
60
Edvinas Jakas
已发布文章USD Economic Strength Index
Trade the Truth: USD Economic Strength Index Trading currency pairs or gold without knowing what is happening behind the scenes is like driving with your eyes closed. Most indicators only look at past price bars, which creates lag...
分享社交网络
74
Edvinas Jakas
已发布产品
Quant Sniper System Quant Sniper System is a brand-new trading framework designed to show you exactly when to buy and sell in the market. It calculates high-probability price levels using a robust mathematical formula. With this system, you don't have to guess—you will know exactly where to enter a trade and where to close it to maximize your profit potential. Click here to join the MQL5 Channel Why Choose Quant Sniper System: Built on Mathematics: This tool utilizes real mathematical formulas
Edvinas Jakas
The Problem with Technical Indicators Most traders rely entirely on lagging technical indicators like Moving Averages or RSI to navigate ranging markets. However, geometric charts only show where the price went, not why it moved...
分享社交网络
110
Edvinas Jakas
Markets move on macroeconomic data, not laggy technical lines. When high-impact news like NFP, CPI, or GDP drops, traditional price-action indicators get instantly obliterated. The USD Economic Strength Index is an elite institutional-grade matrix built natively for MetaTrader 5...
分享社交网络
118
Edvinas Jakas
Have you ever entered a perfect technical breakout, only to see the market immediately reverse and chop you to pieces?
Most indicators fail because they calculate historical price data—telling you what already happened. To truly stay ahead of the market, you need to understand the fundamental fuel driving the currency trends.
Introducing the USD Economic Strength Index, a live macroeconomic tracking matrix built to uncover the real-time strength of the US Dollar and give you an unshakeable edge.
Let’s dive into the dashboard to see exactly how it maps fundamental truth directly onto your chart.
1. The USD Score Engine
At the heart of the dashboard is the USD Score, sitting at 57.8 / 100 . This mathematically measures the exact economic performance of the US Dollar over your chosen lookback period . A score of 57.8 shows that while the USD holds a minor economic advantage, it is far from overextended . This tells you that an aggressive, one-way trend is unlikely .
2. Neutral Market Bias Validation
The dashboard officially labels the US Dollar's bias as Neutral with High Confidence . Look at how beautifully this aligns with the GBPUSD Ranging market shown in the file named "A high USD score, driven by strong fundamentals like positive ‘Retail Sales mm +64.00’, translates to fundamental USD strength, creating a net bearish downtrend. When macro fundamentals flag a neutral bias, price action consolidates sideways rather than breaking out into big directional moves .
3. Macro Surprises (USD+ / USD- & NET Score)
The engine tracks raw economic data momentum via the USD+ / USD- (17 / 4) tile and a NET Score of +20.74 . Out of 21 tracked data releases, 17 surprised to the upside for the greenback, while only 4 missed . This net positive baseline acts as a fundamental floor for the dollar, keeping major assets supported at their technical range boundaries instead of letting them collapse .
4. News Impact Balance
The indicator processes underlying event gravity via the HIGH / MED (11 / 14) metric block . This highlights that 11 high-impact news events are balanced against 14 medium-impact consumer reports . Without an overwhelming, heavily one-sided fundamental catalyst to disrupt the status quo, high-volatility breaks are avoided, forcing currency pairs to stay inside structural ranges .
5. Individual Pair Bias Realignment
The matrix instantly converts the global USD data into actionable pair directions, explicitly locking the GBPUSD Pair Bias to Neutral . This automated alignment screams at you to stop trend-following and immediately switch your trading plan to play a strict range-bound environment .
6. Confidence Detail
Backed by historical dependability, the Confidence Detail panel reads Events 25 | Agree 68% . A 68% statistical agreement rate across 25 historical data markers mathematically verifies that the sideways market condition is authentic . This filter protects your capital by alerting you to ignore false technical breakout signals on lower timeframes .
7. Signal Drivers: The Economic Tug-of-War
The Signal Drivers panel shows you the exact macroeconomic catalysts fighting behind the scenes . It reveals positive energy from Crude Oil data countering a negative drag from Durable Goods Orders . These two forces are actively canceling each other's momentum out, functioning as the exact reason why price is trapped in a horizontal consolidation loop .
Why This Indicator Belongs In Your Trading Arsenal
The source code reveals a highly optimized, high-performance UI structure designed to filter out market noise . Rather than guessing what the next news release means, the algorithm automatically scores, decays, and normalizes incoming data into visual signals . It bridges the gap between raw economic calendar figures and real-time technical trading decisions .
Stop trading blindly against the macro current. Let fundamentals tell you when to trend, when to range, and when to stay on the sidelines.
Most indicators fail because they calculate historical price data—telling you what already happened. To truly stay ahead of the market, you need to understand the fundamental fuel driving the currency trends.
Introducing the USD Economic Strength Index, a live macroeconomic tracking matrix built to uncover the real-time strength of the US Dollar and give you an unshakeable edge.
Let’s dive into the dashboard to see exactly how it maps fundamental truth directly onto your chart.
1. The USD Score Engine
At the heart of the dashboard is the USD Score, sitting at 57.8 / 100 . This mathematically measures the exact economic performance of the US Dollar over your chosen lookback period . A score of 57.8 shows that while the USD holds a minor economic advantage, it is far from overextended . This tells you that an aggressive, one-way trend is unlikely .
2. Neutral Market Bias Validation
The dashboard officially labels the US Dollar's bias as Neutral with High Confidence . Look at how beautifully this aligns with the GBPUSD Ranging market shown in the file named "A high USD score, driven by strong fundamentals like positive ‘Retail Sales mm +64.00’, translates to fundamental USD strength, creating a net bearish downtrend. When macro fundamentals flag a neutral bias, price action consolidates sideways rather than breaking out into big directional moves .
3. Macro Surprises (USD+ / USD- & NET Score)
The engine tracks raw economic data momentum via the USD+ / USD- (17 / 4) tile and a NET Score of +20.74 . Out of 21 tracked data releases, 17 surprised to the upside for the greenback, while only 4 missed . This net positive baseline acts as a fundamental floor for the dollar, keeping major assets supported at their technical range boundaries instead of letting them collapse .
4. News Impact Balance
The indicator processes underlying event gravity via the HIGH / MED (11 / 14) metric block . This highlights that 11 high-impact news events are balanced against 14 medium-impact consumer reports . Without an overwhelming, heavily one-sided fundamental catalyst to disrupt the status quo, high-volatility breaks are avoided, forcing currency pairs to stay inside structural ranges .
5. Individual Pair Bias Realignment
The matrix instantly converts the global USD data into actionable pair directions, explicitly locking the GBPUSD Pair Bias to Neutral . This automated alignment screams at you to stop trend-following and immediately switch your trading plan to play a strict range-bound environment .
6. Confidence Detail
Backed by historical dependability, the Confidence Detail panel reads Events 25 | Agree 68% . A 68% statistical agreement rate across 25 historical data markers mathematically verifies that the sideways market condition is authentic . This filter protects your capital by alerting you to ignore false technical breakout signals on lower timeframes .
7. Signal Drivers: The Economic Tug-of-War
The Signal Drivers panel shows you the exact macroeconomic catalysts fighting behind the scenes . It reveals positive energy from Crude Oil data countering a negative drag from Durable Goods Orders . These two forces are actively canceling each other's momentum out, functioning as the exact reason why price is trapped in a horizontal consolidation loop .
Why This Indicator Belongs In Your Trading Arsenal
The source code reveals a highly optimized, high-performance UI structure designed to filter out market noise . Rather than guessing what the next news release means, the algorithm automatically scores, decays, and normalizes incoming data into visual signals . It bridges the gap between raw economic calendar figures and real-time technical trading decisions .
Stop trading blindly against the macro current. Let fundamentals tell you when to trend, when to range, and when to stay on the sidelines.
Edvinas Jakas
Have you ever entered a perfect technical breakout, only to see the market immediately reverse and chop you to pieces? Most indicators fail because they calculate historical price data—telling you what already happened...
分享社交网络
84
Edvinas Jakas
Stop chasing lagging technical indicators that leave you trapped on the wrong side of massive market moves. Successful trading begins with knowing where institutional money is flowing.
The USD Economic Strength Index is a fundamental trading matrix that processes real-time macroeconomic data to eliminate technical lag. By analyzing economic releases directly on your charts, it uncovers the true driving force behind major currency pairs. Take a look at how seamlessly the dashboard suggested the massive downward spiral below.
USD Score: Sitting at a strong 62.5 / 100, this evaluates the true underlying power of the greenback based entirely on actual economic data. It highlights a healthy dollar ready to dominate quote currencies.
Bias & Confidence: The system flags a Bullish Bias with High Confidence. When raw macroeconomic points consistently line up, the institutional stance becomes clear, warning you that counter-trend buying is highly risky.
USD+ / USD- & NET: The metric tiles show 41 positive releases against 32 negative ones over a 30-day lookback period. This gives us a positive NET score of +73.06, tipping the scale completely in favor of the US dollar.
Pair Bias Matrix: The indicator automatically processes the dollar's strength and translates it into direct asset directions, highlighting GBPUSD as Bearish.
Confidence Detail: Logging Events 83 | Agree 49% | High 29, this section reveals high agreement among high-impact releases, making the structural short trade highly reliable.
Signal Drivers: The panel pinpoints the exact catalyst driving the macro flow—in this case, a massive positive surprise in US Retail Sales m/m (+48.00). This fundamental fuel is what pushed the GBPUSD downtrend aggressively lower.
Why trade blindly when you can align your strategies with institutional data? The USD Economic Strength Index removes the guesswork, giving you a crystal-clear map of fundamental momentum in real time.
https://www.mql5.com/en/market/product/182259
Keywords: MQL5 Fundamental Indicator, USD Economic Strength Index, Macroeconomic Trading Dashboard, Forex Fundamental Analysis, GBPUSD Live Analysis, News Trading Indicator MT5.
Hashtags: #MQL5 #ForexTrading #FundamentalAnalysis #MT5 #GBPUSD #TradingIndicators #FXMacro
The USD Economic Strength Index is a fundamental trading matrix that processes real-time macroeconomic data to eliminate technical lag. By analyzing economic releases directly on your charts, it uncovers the true driving force behind major currency pairs. Take a look at how seamlessly the dashboard suggested the massive downward spiral below.
USD Score: Sitting at a strong 62.5 / 100, this evaluates the true underlying power of the greenback based entirely on actual economic data. It highlights a healthy dollar ready to dominate quote currencies.
Bias & Confidence: The system flags a Bullish Bias with High Confidence. When raw macroeconomic points consistently line up, the institutional stance becomes clear, warning you that counter-trend buying is highly risky.
USD+ / USD- & NET: The metric tiles show 41 positive releases against 32 negative ones over a 30-day lookback period. This gives us a positive NET score of +73.06, tipping the scale completely in favor of the US dollar.
Pair Bias Matrix: The indicator automatically processes the dollar's strength and translates it into direct asset directions, highlighting GBPUSD as Bearish.
Confidence Detail: Logging Events 83 | Agree 49% | High 29, this section reveals high agreement among high-impact releases, making the structural short trade highly reliable.
Signal Drivers: The panel pinpoints the exact catalyst driving the macro flow—in this case, a massive positive surprise in US Retail Sales m/m (+48.00). This fundamental fuel is what pushed the GBPUSD downtrend aggressively lower.
Why trade blindly when you can align your strategies with institutional data? The USD Economic Strength Index removes the guesswork, giving you a crystal-clear map of fundamental momentum in real time.
https://www.mql5.com/en/market/product/182259
Keywords: MQL5 Fundamental Indicator, USD Economic Strength Index, Macroeconomic Trading Dashboard, Forex Fundamental Analysis, GBPUSD Live Analysis, News Trading Indicator MT5.
Hashtags: #MQL5 #ForexTrading #FundamentalAnalysis #MT5 #GBPUSD #TradingIndicators #FXMacro
Edvinas Jakas
Stop chasing lagging technical indicators that leave you trapped on the wrong side of massive market moves. Successful trading begins with knowing where institutional money is flowing...
分享社交网络
79
Edvinas Jakas
Discover how to avoid bad trades during market consolidations. Learn how the USD Economic Strength Index decodes macro data to predict flat regimes on currency pairs like USDJPY. Many technical traders lose their capital during horizontal price consolidations...
分享社交网络
81
: