Inside Bar Dashboard
- 指标
- Taras Slobodyanik
- 版本: 1.90
- 更新: 14 三月 2024
- 激活: 10
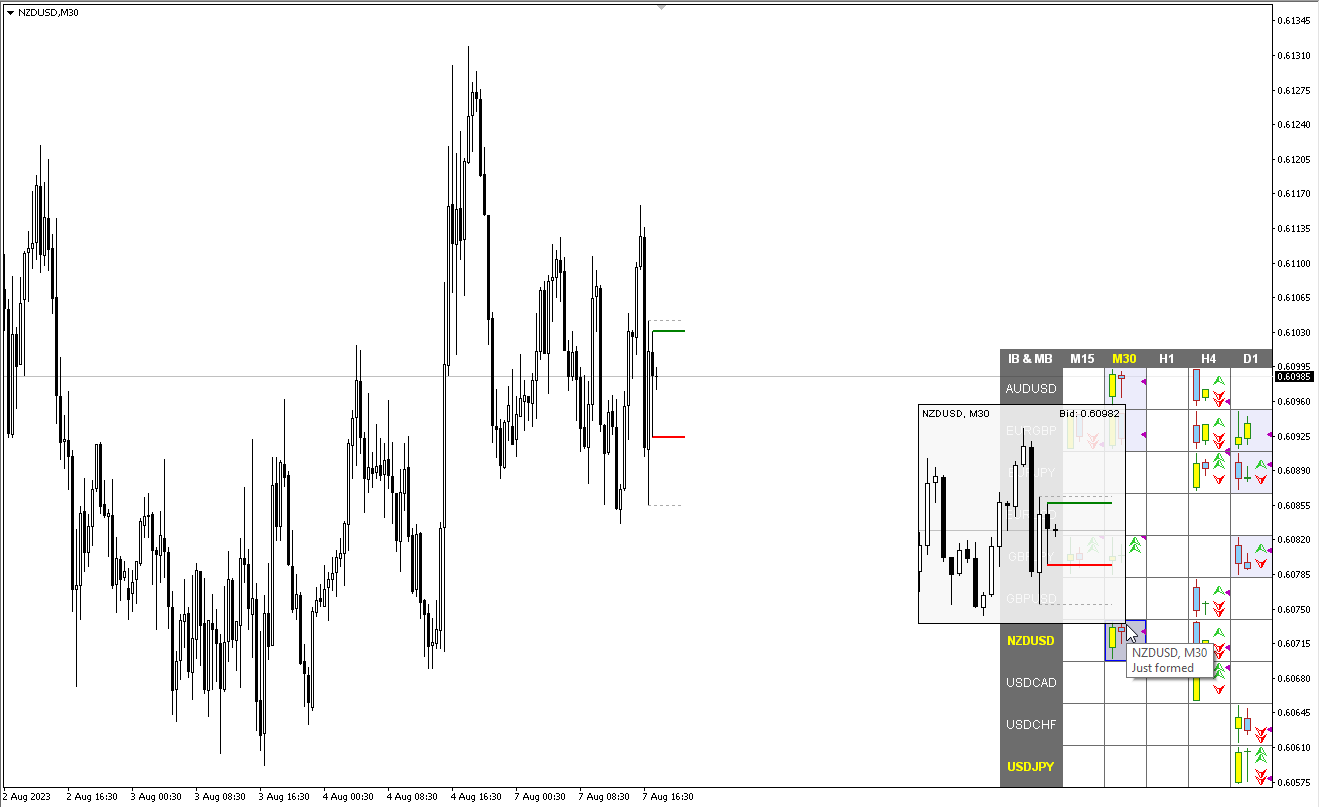
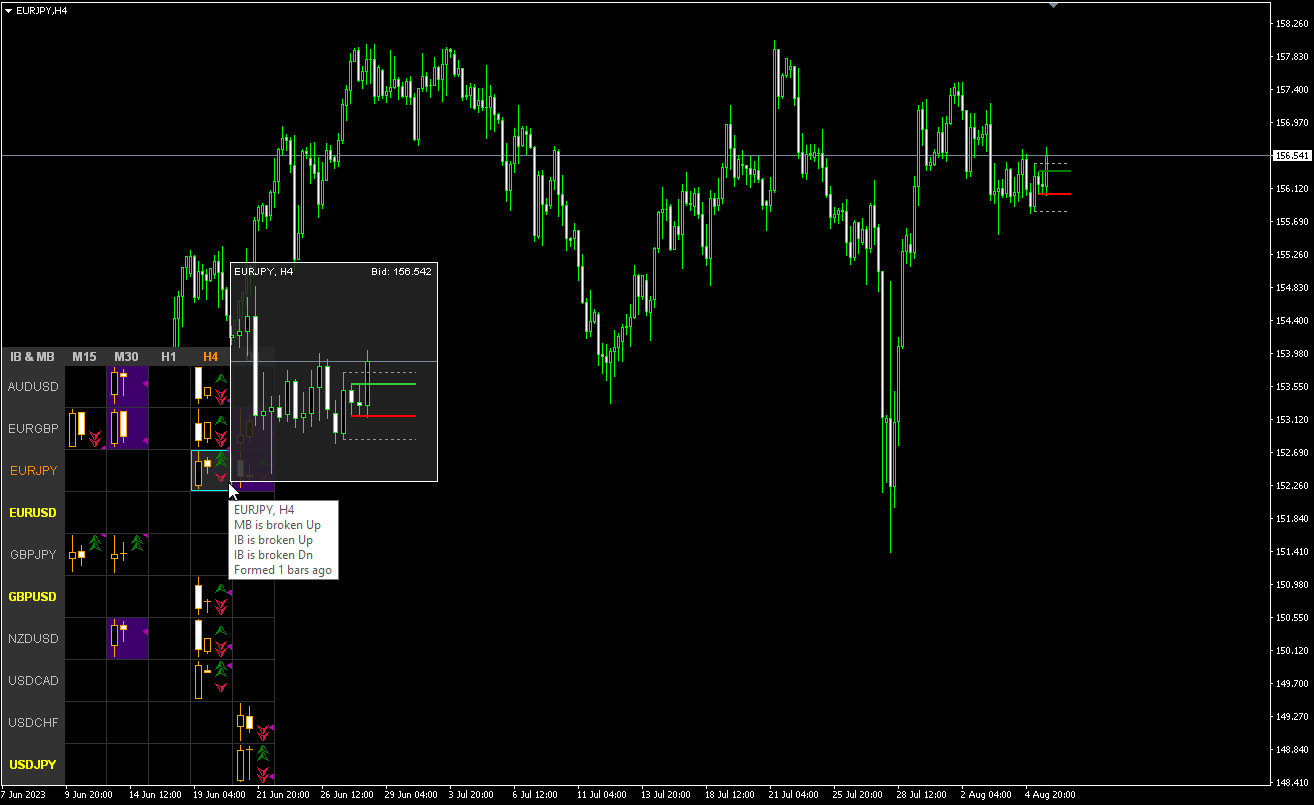
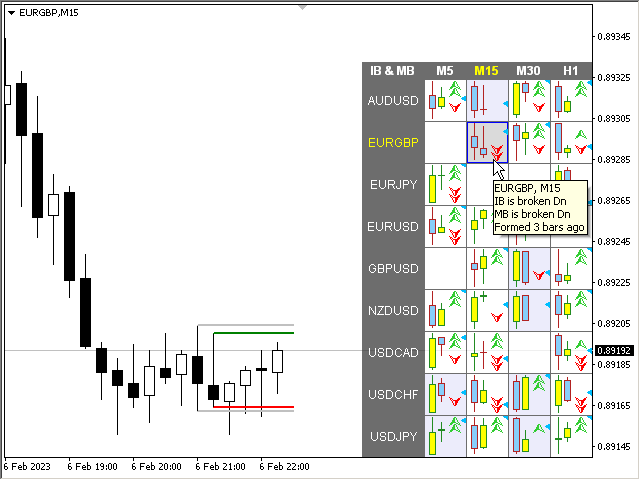
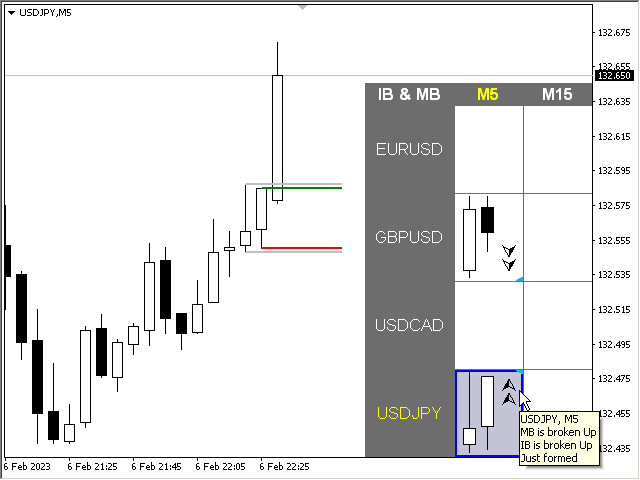
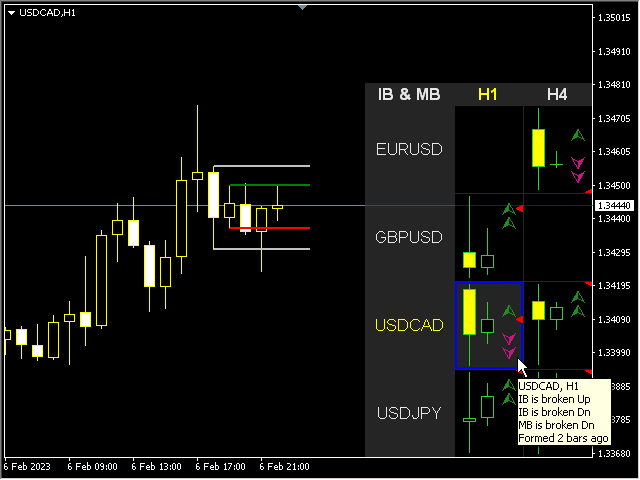
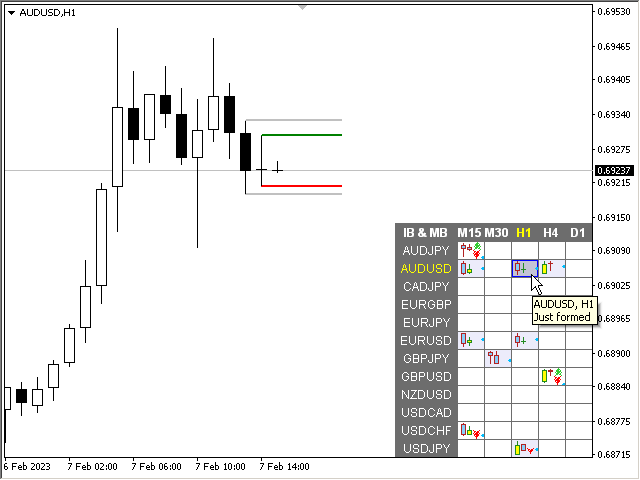
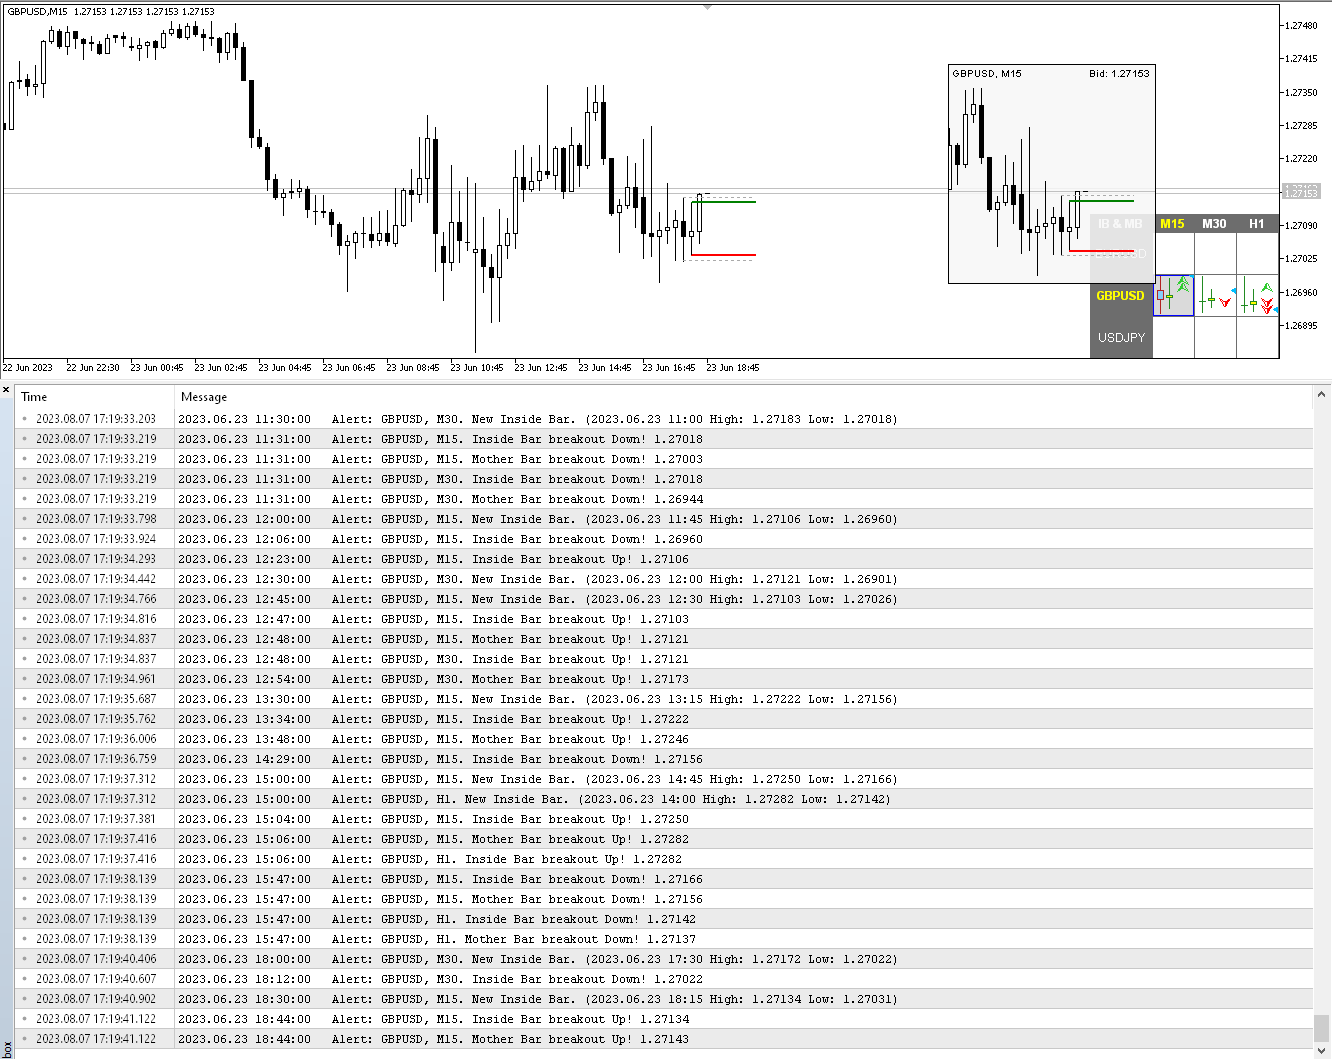
多货币和多时间范围指标 Inside Bar (IB)。 在参数中,您可以指定任何所需的货币和时间范围。 该面板显示最后找到的内部柱线(和母柱线)形态、当前价格位置以及母线和内部柱线水平的突破。 您可以设置单元格中的条形和文本的大小和颜色。 当水平被突破时,该指标还可以发送通知。 通过单击带有句点的单元格,将打开指定的交易品种和句点。 这是 MTF 扫描仪。
默认情况下,从图表中隐藏仪表板的键是“D”。
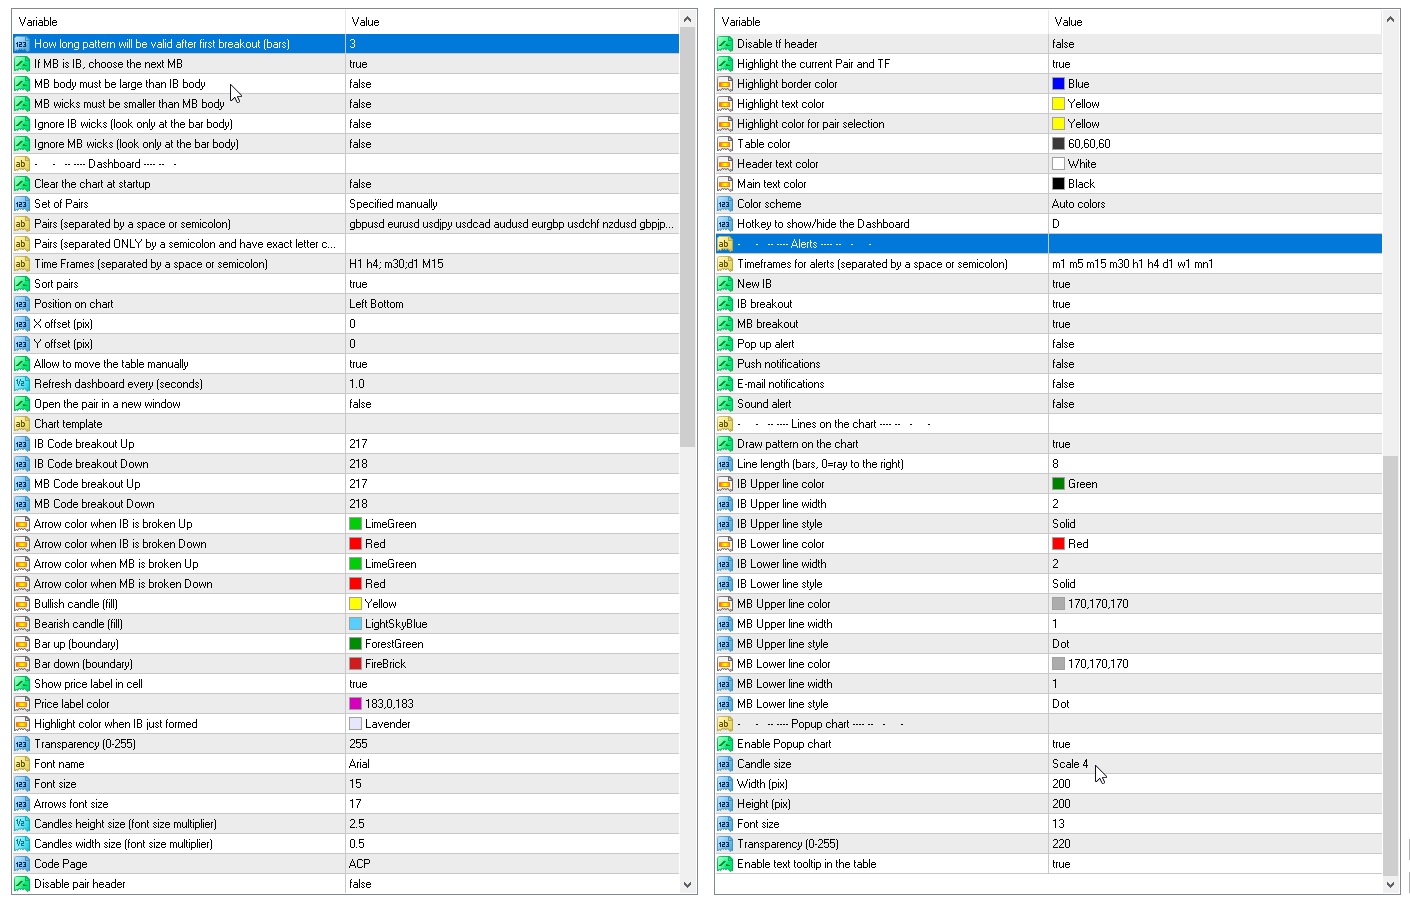
参数
- How long pattern will be valid after first breakout (bars) — 信号将在单元格中显示多少柱。
- IB body must be inside of the MB body - IB 主体必须位于 MB 主体内部。
- IB body and wicks must be inside the MB body - IB 主体和灯芯必须位于 MB 主体内。
- If MB is IB, choose the next MB — 如果找到的母柱是前一个信号的内柱,则将显示前一个信号。
- MB body must be large than IB body - MB 主体必须大于 IB 主体
- MB wicks must be smaller than MB body - MB 灯芯必须小于 MB 主体
- Ignore IB wicks (look only at the bar body) - 忽略 IB 灯芯(只看棒体)
- Ignore MB wicks (look only at the bar body) - 忽略MB灯芯(只看棒体)
仪表板
Clear the chart at startup - 启动时清除图表
Set of Pairs - 成对组:
— Market Watch - 市场观察— Specified manually - 手动指定— Current pair - 当前对。
Pairs (separated by a space or semicolon) — 由空格或分号分隔的符号列表。 货币名称的书写方式应与经纪商的名称完全相同,并保留大小写和前缀/后缀。
Time Frames (separated by a space or semicolon) (multi timeframe) - 时间范围(用空格或分号分隔)(多个时间范围)
Sort pairs - 排序对
Position on chart - 图表上的位置
X offset (pix) - X 偏移(像素)
Y offset (pix) - Y 偏移(像素)
Refresh dashboard every (seconds) - 每(秒)刷新一次仪表板
Open the pair in a new window - 在新窗口中打开该对
Chart template - 图表模板
Code breakout Up - 代码突破 向上
Code breakout Down - 代码突破 向下
Arrow color when IB is broken Up - IB 断开时的箭头颜色
Arrow color when IB is broken Down - IB 分解时的箭头颜色
Arrow color when MB is broken Up - MB分解时的箭头颜色
Arrow color when MB is broken Down - MB 损坏时的箭头颜色
Bullish candle (fill) - 看涨蜡烛(填充)
Bearish candle (fill) - 看跌蜡烛(填充)
Bar up (boundary) - 上栏(边界)
Bar down (boundary) - 下栏(边界)
Show price label in cell - 在单元格中显示价格标签
Price label color - 价格标签颜色
Highlight color when IB just formed - IB刚形成时的高亮颜色
Candles height size (font size multiplier) - 蜡烛高度尺寸(字体尺寸乘数)
Candles width size (font size multiplier) - 蜡烛宽度大小(字体大小乘数)。
警报
New IB - 新 IB - 当新 IB 形成时发出警报。
IB breakout - IB 突破 - 当 IB 水平被突破时发出警报。
MB breakout - MB 突破 - 当 MB 水平被突破时发出警报。
Lines on the chart - 图表上的线条
Draw pattern on the chart - 在图表上绘制图案。
Lines length (bars) - 线条长度(条)。
I use a number of indicators from Taras and the programming is excellent. The attention to detail and response from the author is excellent. Always happy to assist and always very busy making advancements to each indicator. One of the best authors I have purchased from and also very knowledgeable in his craft and the markets. Thank you Taras keep up the great work.