Trading Session Time With Alert MT5
- 指标
- Issam Kassas
- 版本: 1.10
- 更新: 16 五月 2023
交易会话时间指示器:
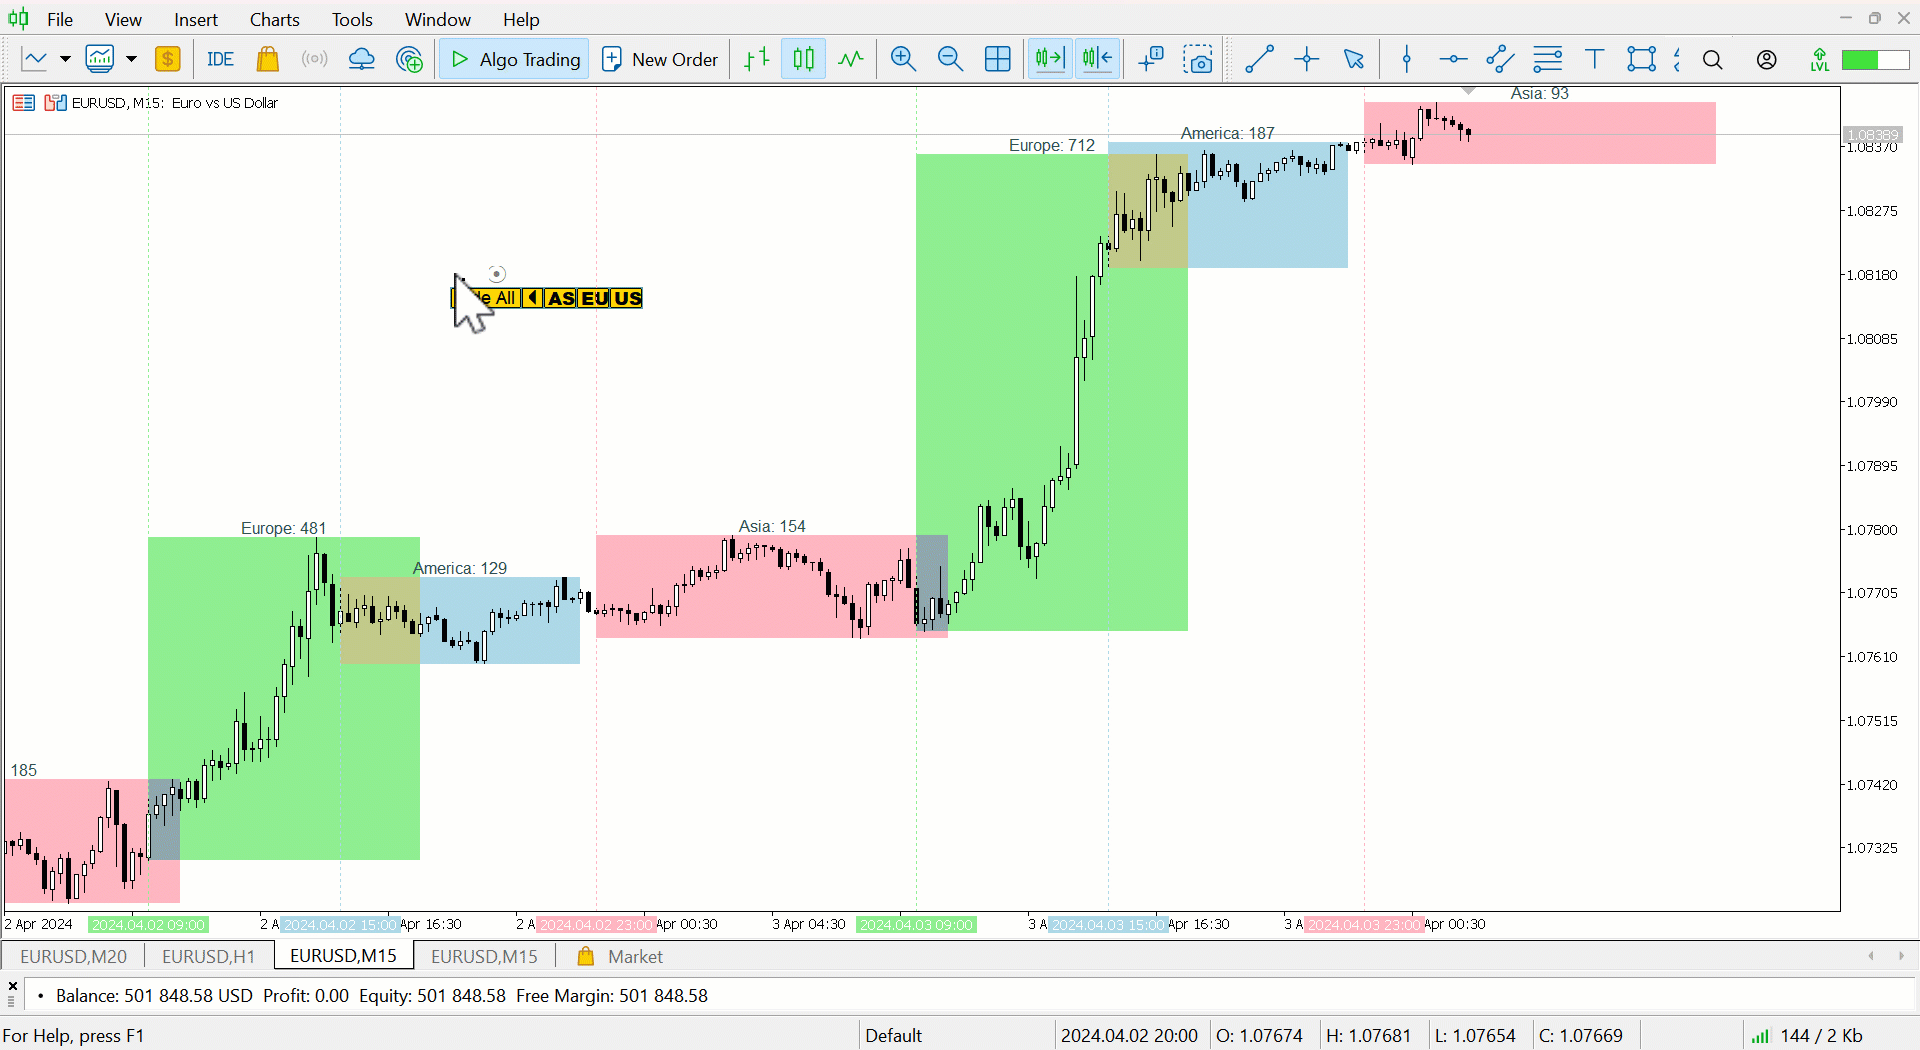
“交易会话时间指示器”是一个强大的技术分析工具,旨在增强您对外汇市场中不同交易会话的理解。这个无缝集成的指标提供了关于主要交易会话的开盘和收盘时间的重要信息,包括东京、伦敦和纽约。通过自动时区调整,它为全球交易者提供服务,帮助他们优化交易时间表,以获取高流动性时段,并避开低活跃时段。该指标提供了关于市场情绪、高峰波动期和交叠交易会话的见解,帮助日内交易者做出与其策略一致的精确决策。其可定制的显示允许个性化用户体验,而智能交易计划结合其数据,可能会导致改善的交易结果。通过提高低活跃时段的意识,该指标帮助交易者避免过度交易,并专注于优质机会。与各种交易平台无缝兼容,“交易会话时间指示器”是寻求优化交易路程的交易者的宝贵工具。
特点:
- 优化的时间表:提供主要交易会话时间,并与高流动性相符。
- 电话和电子邮件提醒:在会话开始时提醒您。
- 杀伤区域:使用警报设置ICT风格的杀伤区域。
- 重叠分析:探索会话重叠并针对活动增加。
- 日内精度:帮助日内决策并关注与策略一致的会话。
- 可定制的显示:个性化偏好和颜色设置。
- 智能交易计划:集成以提高生产力并通过规划改善结果。
- 避免过度交易:提高低活跃意识并优先考虑质量而非冲动。
- 无缝集成:易于集成,快速安装立即使用,增强了优化路径的分析。
- 全球时区适应。
- 波动性意识。


sick