Market Rider Oscillators MT5
- 指标
- Stefan Petkov
- 版本: 1.0
- 激活: 10
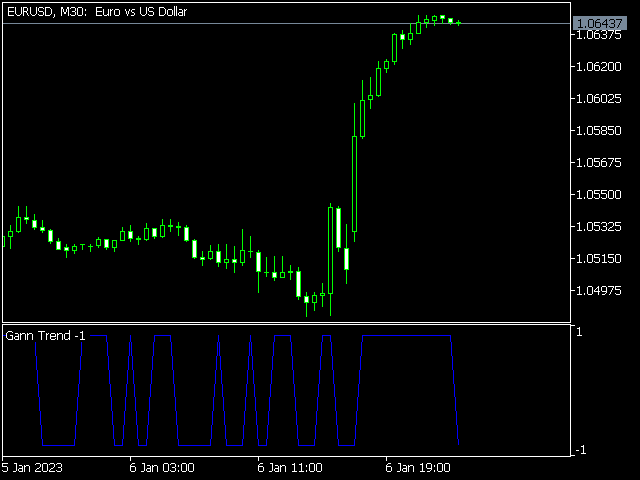
An Ultimate Tool for quick and efficient market analysis. Unique combination of solid indicators defining market direction for trend tracking and filtration designed for you to stay on the right side of the market.
Market Rider Oscillators gives you access to one of the most used from professional trades indicators on worldwide, which were not build in for MT4 and MT5 terminals . These are unique non-repainting oscillators
designed to be used on all time frames for all instruments classes: Forex, CFDs, Futures, Crypto and Stock equities (all instruments offered in Metatrader terminals).
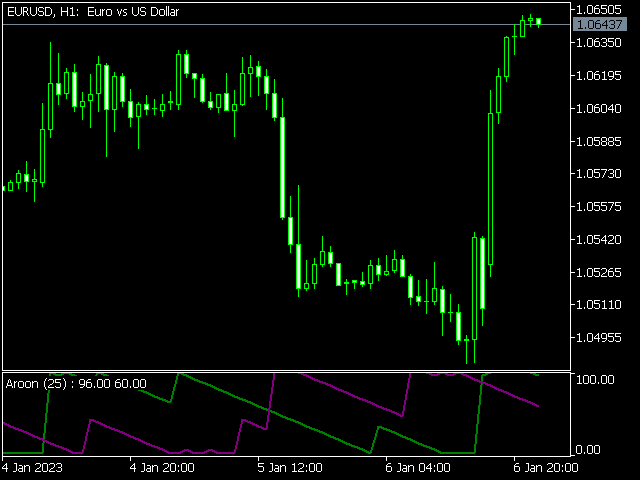
- Aroon Indicator
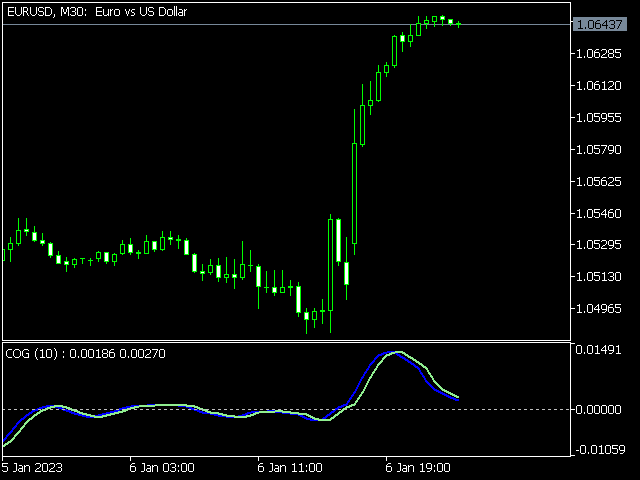
- Center of Gravity
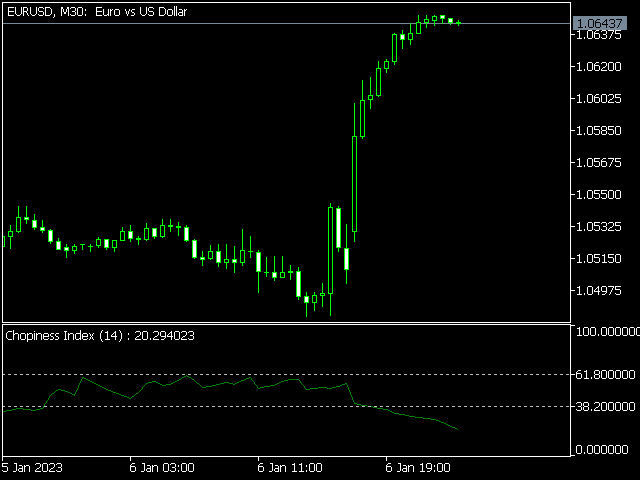
- Chopiness Index
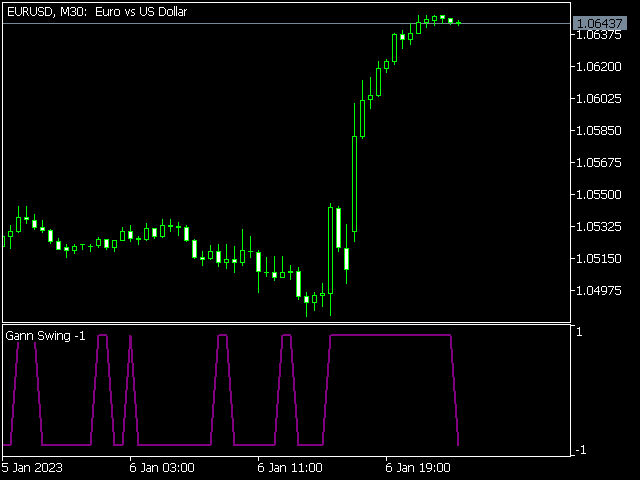
- Gann Swing
- Gann Trend
- High Low Volatility Index
- Linear Regression
- Price Change Since Opening
- Chaikin's Volatility
- True Strength Index
Complete guide of the indicators and instructions for using them: https://www.mql5.com/en/blogs/post/751378
You can find MT4 version here : https://www.mql5.com/en/market/product/92084