Moving Average Trend Alert MT5
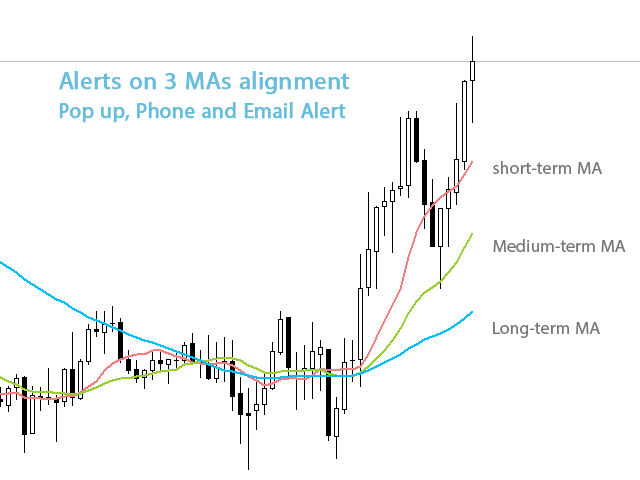
Moving Average Trend Alert is a triple MA indicator that helps traders to identify potential market trends based on 3 MAs alignment and crossover.
Moving Average Trend Alert features:
- Customizable short-term, medium-term, and long-term MAs.
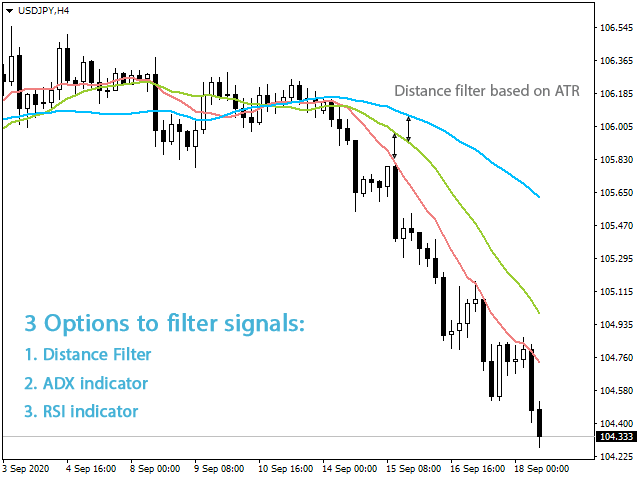
- Option to filter signals based on a minimum distance between moving averages to avoid premature MAs alignment.
- Optional Filter of signals with RSI indicator overbought/oversold levels.
- Optional Filter of signals with ADX indicator.
- Popup, email, and phone notification alerts for selected symbols and timeframes.
Some Notes:
- Note that if you enable the distance or ADX filter, the indicator might not give an immediate MA cross signal.
- The signals of this moving average indicator are not Buy/Sell signals. They indicate a potential market trend that should be checked. The classic trend following approach is to find a strong trend then look at lower timeframes for a pullback or breakout trade setup in the direction of the main trend. If you have a particular MA trading system you can set up the indicator accordingly to get buy/sell signals.
- If you want 2 MAs setup, set the long MA period to zero.
- By default, the indicator checks moving averages and doesn't consider the current price position relative to MAs. If you want that set the short MA period to '1' then it resembles the price.
Settings
MA Settings
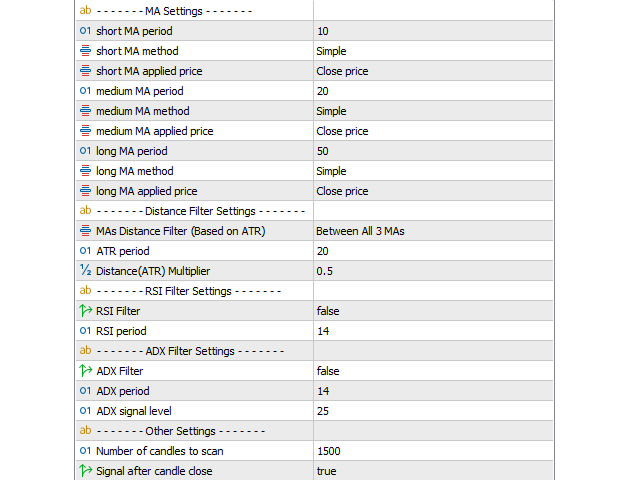
Set short, medium, and long MAs period, method, and applied price in this section.
Signal Settings
Filter mid-trend signals: If enabled the indicator tries to filter mid/late trend signals. It alerts only if a new signal generates in the opposite direction.
Signal after candle close: If true dashboard waits until the close of the current candle and then checks the signal.
Distance Filter Settings
MAs Distance Filter (Based on ATR): Set a minimum distance between MAs based on ATR value with 3 modes: between all 3 MAs, between short and medium MAs, and between Medium and long MAs. Set MAs Distance Filter to 'None' if you don't want to use it.
ATR period: Set the period of ATR used in the distance filter.
Distance(ATR) Multiplier: Set a multiplier for ATR used in the distance filter.
For example if you set MAs Distance Filter to "Between all 3 MAs", ATR period to 20 and multiplier to 0.5 (default values), the dashboard only signals when 3 MAs are aligned and the vertical distance between them is equal to the ATR indicator value multiplied with "0.5".
RSI Filter SettingsBy setting the RSI Filter to true the moving average dashboard filters the signal when RSI is above 70 in an uptrend and below 30 in a downtrend.
ADX Filter SettingsSet the ADX Filter to true if you want to filter signals using the ADX indicator main signal line value. Input the ADX period and ADX signal level values in their fields.
Other Settings
Number of candles to look back in chart: Set here how many bars you want to check for drawing history signals.
Popup Alert: To enable MT5 alert window informing dashboard signals on a symbol and timeframe. Select symbols and timeframes that you want to get alert for them by ticking their checkboxes on the panel.
Phone Notification: To receive indicator alerts on the cell phone. For this to work you must enable and fill the MetaTrader push notification settings from the Notifications tab on the MetaTrader options dialog (ctrl+o).
Email Alert: To receive indicator alerts via email. For this to work you must enable and fill the MetaTrader email settings from the Email tab on the MetaTrader options dialog (ctrl+o).
Dashboard: Moving Average Trend Scanner MT5
MT4 version here


Just what I am looking for to complement my trend scanner but may I suggest if delay function can be added for 3 Ema cross over let say if there is a twist on the 3 Ema it will delay in second to confirm the cross over, also if the rsi settings can added over bought level and over sold level, let assume I want to configure it to >50 as buy, 50>; for sale, so far it a great indicator.