Strong Support mt5
- 指标
- Vasiliy Strukov
- 版本: 1.0
- 激活: 5
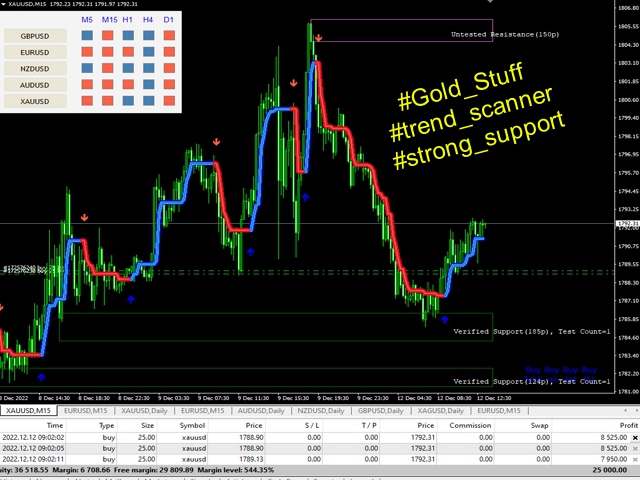
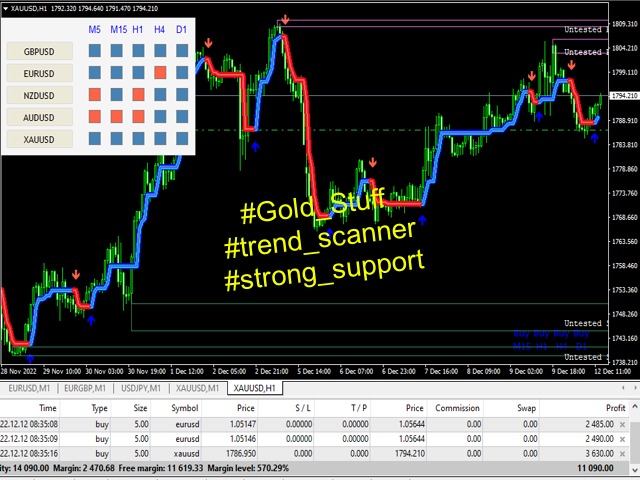
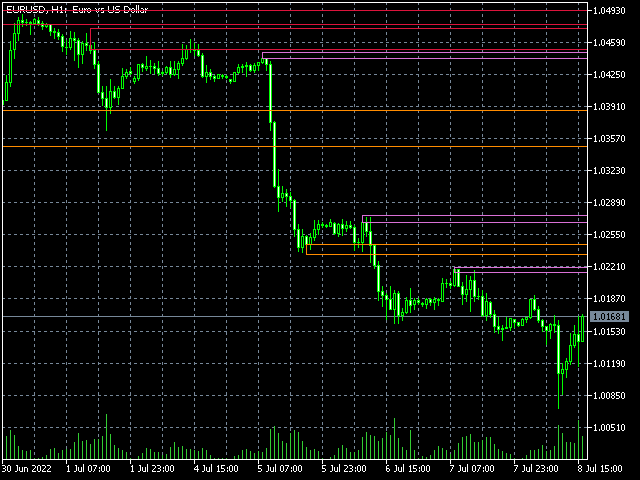
支撑位和阻力位长期以来一直是市场分析的有力工具。 强支撑指标绘制基于本地价格最低值的支撑水平,以及基于本地价格最大值的阻力水平。
我的其他发展可以在这里查看
建议与趋势指标一起使用,例如黄金-这将允许您根据趋势进行交易,同时确定整合或趋势反转区域,以及在支撑位和阻力位设置止损和获利。
购买后立即与我联系,以获得设置和个人奖金!
传入参数 -
指示器不需要复杂的设置,主要参数是色标的调整。
支撑位和阻力位长期以来一直是市场分析的有力工具。 强支撑指标绘制基于本地价格最低值的支撑水平,以及基于本地价格最大值的阻力水平。
我的其他发展可以在这里查看
建议与趋势指标一起使用,例如黄金-这将允许您根据趋势进行交易,同时确定整合或趋势反转区域,以及在支撑位和阻力位设置止损和获利。
购买后立即与我联系,以获得设置和个人奖金!
传入参数 -
指示器不需要复杂的设置,主要参数是色标的调整。


Indispensable in manual negotiations.