Strong Support mt5
- 지표
- Vasiliy Strukov
- 버전: 1.0
- 활성화: 5
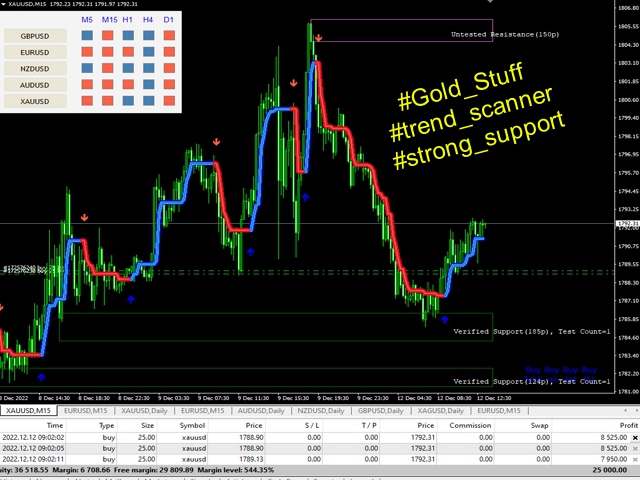
지원 및 저항 수준은 오랫동안 시장 분석을위한 강력한 도구였습니다. 강력한 지원 지표는 현지 가격 최소값을 기반으로 한 지원 수준과 현지 가격 최대값을 기반으로 한 저항 수준을 나타냅니다.
내 다른 개발은 여기에서 볼 수 있습니다
추세 표시기와 함께 사용하는 것이 좋습니다(예:금 물건)-추세에 따라 거래하고 동시에 통합 또는 추세 반전 영역을 결정할 수있을뿐만 아니라 정지 손실을 설정하고 지원 및 저항 수준에서 이익을 얻을 수 있습니다.
설정 및 개인 보너스를 받기 위해 구입 후 즉시 저에게 연락하십시오!
들어오는 매개 변수 -
이 표시기에는 복잡한 설정이 필요하지 않으며 주요 매개 변수는 색상 스케일 조정입니다.
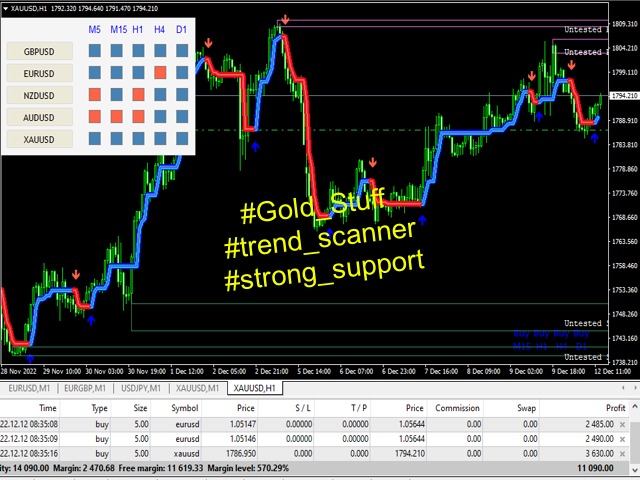


Indispensable in manual negotiations.