• 概述
  • 评论
  • 评论

AIS Smoothed Channel MaxMin

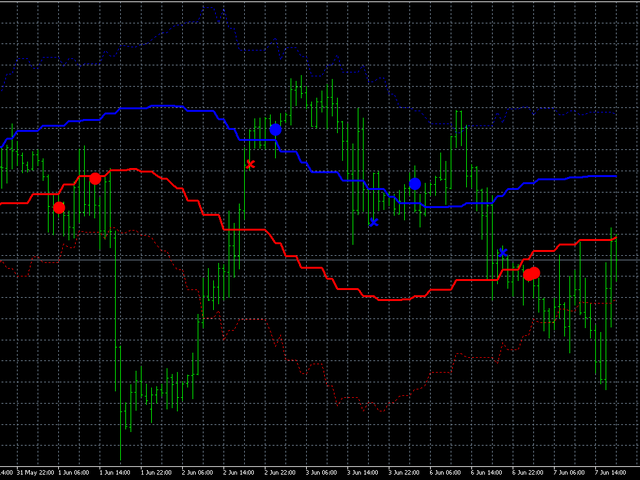
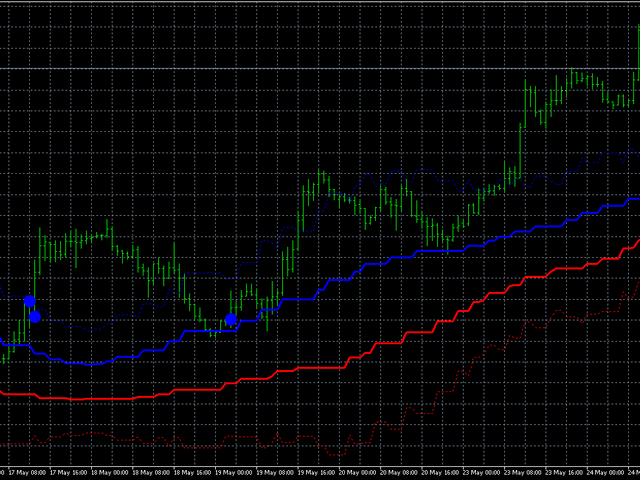
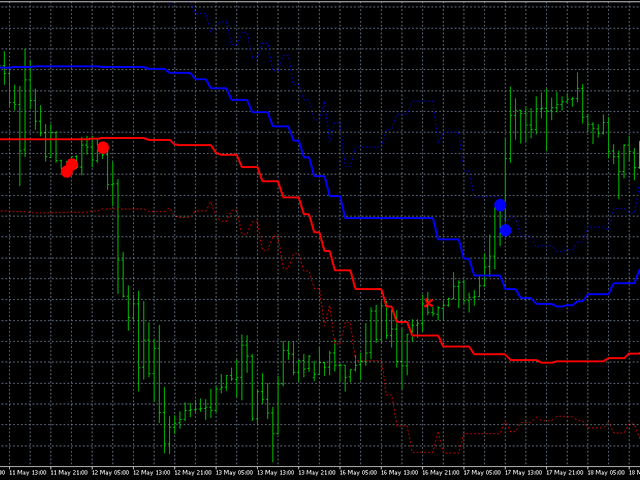
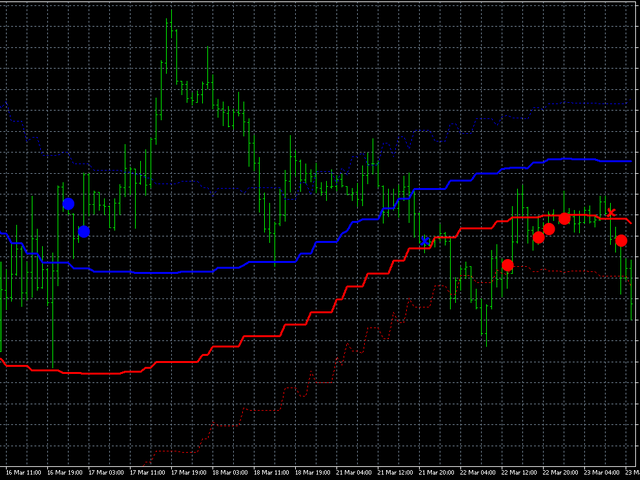
该指标使用价格序列的局部高点和低点。突出极值后,对它们的值进行平滑处理。因此,建立了两个通道 - 外部和内部。如果价格走势严格遵循线性趋势,则内部通道显示限制。外部通道以对数趋势显示价格变动的边界。
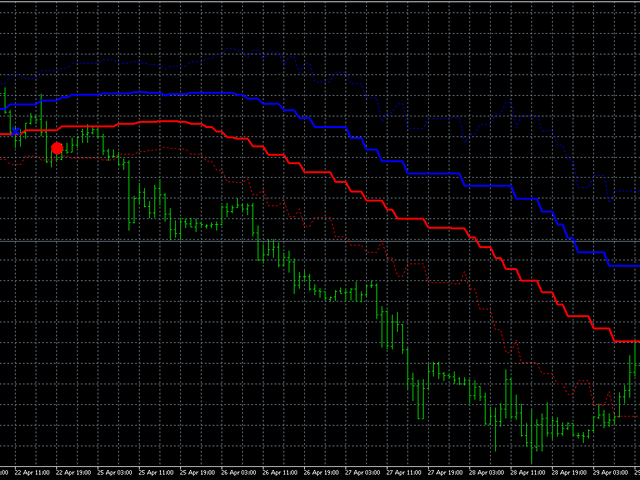
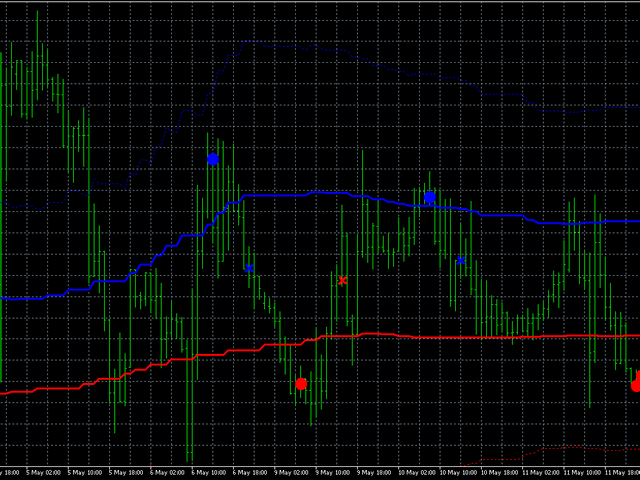
在计算通道后,该指标分析实际价格走势并提供开仓和平仓建议。蓝点 - 建立买入头寸,红色点 - 建立卖出头寸。相应的交叉盘建议关闭某些头寸,如果有的话。应该记住,并非所有信号都具有相同的强度和准确性。在某些情况下,正确方向的价格变动会很快结束,因此不可能获得大笔利润。在某些情况下,信号会导致损失(最后一张图片显示了此类信号的示例)。鉴于这些特点,我们可以推荐以下方法 - 使用浮动止盈,其值可以根据当前市场情况进行更改。还需要选择一个止损值,以便在出现关闭它们的信号之前关闭无利可图的头寸。
指标设置使用以下参数进行:
  • iChannel - 调整通道的宽度。狭窄的通道会提供更多的信号,但也会增加误报的风险。
  • iSignal - 允许您配置信号的显示。默认情况下,仅显示最佳进入和退出信号。
  • iPeriod - 指标周期。该参数越大,通道宽度越大。因此,它也会影响信号的数量。
  • iFactor - 影响通道平滑的参数。它还可以稍微影响通道的宽度。
推荐产品
VR Cub
Vladimir Pastushak
VR Cub 这是获得高质量切入点的指标。该指标的开发是为了促进数学计算并简化对仓位入场点的搜索。多年来,该指标所针对的交易策略已被证明其有效性。交易策略的简单性是其巨大的优势,即使是新手交易者也能成功进行交易。 VR Cub 计算开仓点以及获利和止损目标水平,这显着提高了效率和易用性。查看使用以下策略进行交易的屏幕截图,了解简单的交易规则。 设置、设置文件、演示版本、说明、问题解决,可以从以下位置获取 [博客] 您可以在以下位置阅读或撰写评论 [关联] 版本为 [MetaTrader 5] 计算入场点的规则 开仓 要计算入场点,您需要将 VR Cub 工具从最后一个高点拉伸到最后一个低点。 如果第一个点在时间上早于第二个点,交易者等待柱线收于中线上方。 如果第一个点在时间上晚于第二个点,交易者等待柱线收于中线下方。 根据上述条件,严格在 柱线收盘 后建仓。 换句话说,如果我们在小时图上进行交易,那么从最高点到最低点的时间距离必须超过24小时,最高点和最低点之间的点数必须大于或等于平均价格变动每天。 维持和改变市场地位 可以有多个未平仓头寸;每个头寸都可以单独修改。 VR Cu
Infinity Trend Pro
Yaroslav Varankin
1 (1)
This is a trend indicator without redrawing Developed instead of the binary options strategy (by the color of the Martingale candlestick) Also works well in forex trading When to open trades (binary options) A signal will appear in the place with a candle signaling the current candle It is recommended to open a deal for one candle of the current timeframe M1 and M5 When a blue dot appears, open a deal up When a red dot appears, open a trade down. How to open trades on Forex. When a signal is rec
Trendiness Index
Libertas LLC
5 (3)
"The trend is your friend" is one of the best known sayings in investing, because capturing large trendy price movements can be extremely profitable. However, trading with the trend is often easier said than done, because many indicators are based on price reversals not trends. These aren't very effective at identifying trendy periods, or predicting whether trends will continue. We developed the Trendiness Index to help address this problem by indicating the strength and direction of price trend
Fourteen plus nine TD Sequential
MOHAMMED IMAD HUSSEIN BASSEE
Fourteen plus nine What is it for? Applying Tom DeMark’s TD Sequential serves the purpose of identifying a price point where an uptrend or a downtrend exhausts itself and reverses. . What are the main components of TD Sequential? TD Sequential has two parts – TD Setup and TD Countdown. The first phase of TD Sequential starts with a TD Setup and is completed with a 9 count. When the 9 count is completed, it is at that point, a price pause, price pullback, or reversal is likely. It is also at tha
KT Renko Patterns MT4
KEENBASE SOFTWARE SOLUTIONS
2.33 (3)
KT Renko Patterns scans the Renko chart brick by brick to find some famous chart patterns that are frequently used by traders across the various financial markets. Compared to the time-based charts, patterns based trading is easier and more evident on Renko charts due to their uncluttered appearance. KT Renko Patterns features multiple Renko patterns, and many of these patterns are extensively explained in the book titled Profitable Trading with Renko Charts by Prashant Shah. A 100% automate
Chart Patterns Detect 15 patterns (Ascending Triangle, Descending Triangle, Rising Wedge, Falling Wedge, Bullish Flag, Bearish Flag, Bullish Rectangle, Bearish Rectangle Symmetrical triangle, Head and Shoulders, Inverted Head and Shoulders, Triple top, Triple Bottom, Double Top, Double Bottom) Use historical data to calculate the probability of each pattern to succeed (possibility to filter notification according to the chance of success) gives graphic indication about the invalidation level and
COG LR Osc AM
Andriy Matviyevs'kyy
The presented indicator allows you to determine potential entry points into the market and set protective orders at reasonable levels. This product can be useful for both beginners and experienced traders. The indicator is based on calculation methods proven by time and practicing traders. The indicator is calculated in two stages: At the first stage, linear regression (LR) of the selected price type is determined for a given number of chart periods. At the second stage, the obtained data is p
Nice Trade Point
Muhammed Emin Ugur
This    Nice Trade Point     indicator is designed for signal trading. This indicator generates trend signals. It uses many algorithms and indicators to generate this signal. It tries to generate a signal from the points with the highest trend potential. This indicator is a complete trading product. This indicator does not need any additional indicators. The indicator certainly does not repaint. The point at which the signal is given does not change.     Features and Suggestions Time
ZhiBiCCI MT4
Qiuyang Zheng
5 (1)
【ZhiBiCCI】指标适合所有的周期使用,也适合所有的市场品种。 【ZhiBiCCI】绿色实线是逆转看涨背离。绿色虚线是经典的看涨背离。 【ZhiBiCCI】向红色实线是反向看跌背离。红色虚线是古典看跌背离。 【ZhiBiCCI】可以在参数里面设置(Alert、Send mail、Send notification),设置为(true)就可以发送即时信号到警报窗口、电子邮件、即时消息。 参数设置说明: 【displayAlert】:这是警报开关,设置成true,如果出现箭头就会自动警报提示;设置成false,则不会警报提示。 【sendmail_NO_OFF】:这是发送邮件的开关,设置成true,如果出现箭头就会发送邮件到你在MT4设置好的邮箱里面;设置成false,则不会发邮件。 【sendnotification_NO_OFF】:这是发送即时消息的开关,设置成true,如果出现箭头就会发送消息到你的移动设备;设置成false,则不会发消息。 更多好用的指标网址: https://www.mql5.com/en/users/zhengqiuyang/seller
Insider Scalper Binary This tool is designed to trade binary options. for short temporary spends. to make a deal is worth the moment of receiving the signal and only 1 candle if it is m1 then only for a minute and so in accordance with the timeframe. for better results, you need to select well-volatile charts.... recommended currency pairs eur | usd, usd | jpy .... the indicator is already configured, you just have to add it to the chart and trade .... The indicator signals the next can
GMMA Trade X is an EA based on GMMA. GMMA parameters such as MovingAveragePeriod1-24, MovingAverageMAShift1-24, MovingAverageShift1-24 and CandlestickShift1-24 can be adjusted. GMMA Trade X applies BTN TECHNOLOGY's state-of-the-art intelligent technology to help you create optimal results for your trades. May your dreams come true through GMMA Trade X. Good luck. = == == Inquiries = == == E-Mail:support@btntechfx.com
Trend Master Chart MT4
Frederic Jacques Collomb
Trend Master Chart。 它覆盖图表并使用颜色编码来定义不同的市场趋势/走势。 它使用结合了两个移动平均线和不同振荡器的算法。 这三个元素的周期是可以修改的。 它适用于任何时间范围和任何货币对。 您一眼就能识别出上升或下降趋势以及该趋势的不同切入点。 例如,在明显的上升趋势(浅绿色)期间,该趋势中的不同市场冲动将通过深绿色蜡烛显示。 可配置的警报将使您永远不会错过这些冲动之一。 MT5版本。 请注意,免费指标直到 05/15 - 届时其价格将为 49 美元 输入参数: Period 1: 快速周期移动平均线。 Period 2: 慢周期移动平均线。 Oscillator period :振荡器周期。 Sell/Buy alert: 市场冲动警报、趋势切入点。 Bullish/Bearish: 趋势变化时发出警报。 可以通过弹出/邮件和推送通知方式发出警报。 完全可配置的警报文本。 想要查看其他免费 SPARTACUS 指标, 请点击此处 SPARTACUS2024
FREE
PZ Swing Trading
PZ TRADING SLU
5 (4)
Swing Trading 是第一个旨在检测趋势方向的波动和可能的反转波动的指标。它使用在交易文献中广泛描述的基准摆动交易方法。该指标研究多个价格和时间向量,以追踪总体趋势方向,并检测市场超卖或超买并准备好进行修正的情况。 [ 安装指南 | 更新指南 | 故障排除 | 常见问题 | 所有产品 ] 市场波动的利润不会被窃取 指示器始终显示趋势方向 彩色价格带代表机会基准 彩色虚线表示可能的反转波动 该指标分析其自身的质量和性能 它实现了一个多时间仪表板 可定制的趋势和波动周期 它实现了电子邮件/声音/推送警报 指示器为非重涂或重涂 什么是摇摆交易 摇摆交易是一种尝试在一天到一周内从证券中获得收益的交易方式,尽管某些交易最终可以保持更长的寿命。摇摆交易者使用技术分析来买入弱点和卖出力量,并有耐心等待这些机会的发生,因为在发生一波抛售浪潮之后购买证券而不是陷入抛售更有意义。 机会基准 关于历史数据的大量研究证明,适合于波动交易的市场倾向于在基线价格带上下交易,基线价格带由图表显示,使用平均真实区间计算得出。波动交易者使用基线,该策略是购买常态和卖出躁狂,或做空常态并掩盖沮丧。
Owl smart levels
Sergey Ermolov
4.63 (54)
MT5版本  |  FAQ Owl Smart Levels Indicator   是一個完整的交易系統,包含   Bill Williams   的高級分形、構建正確的市場波浪結構的 Valable ZigZag 以及標記準確入場水平的斐波那契水平等流行的市場分析工具 進入市場和地方獲利。 策略的详细说明 指示灯使用说明 顾问-贸易猫头鹰助手助理 私人用户聊天 ->购买后写信给我,我会将您添加到私人聊天中,您可以在那里下载所有奖金 力量在於簡單! Owl Smart Levels   交易系統非常易於使用,因此適合專業人士和剛開始研究市場並為自己選擇交易策略的人。 策略和指標中沒有隱藏的秘密公式和計算方法,所有策略指標都是公開的。 Owl Smart Levels 允許您快速查看進入交易的信號,突出顯示下訂單的水平並向您發送有關已出現信號的通知。 優點很明顯: 清楚地顯示主要和更高時間框架的趨勢方向。 指示儀器信號的出現。 標記開單、止損設置和固定利潤的水平。 沒有多餘的,只有必要的結構! ZigZag   表示全球趨勢的方向,因此也表示貿易方向。 市場反轉點的短線清楚地表明在
Interactive BB Matrix
Tsvetan Tsvetanov
2 (1)
This indicator displays Bollinger Bands signals for multiple symbols and multiple time frames. The signals are created as a simple ratios which represent the distance between the current price and the moving average measured in standard deviations. This way we create a very versatile and easy to use indicator which helps us to identify not only the strongest trends but also the most overbought and oversold conditions. Features Accurate signals in real time for multiple time frames and multiple
The Sextet Scalper Pro  is an MT4 indicator that gives signals when new waves are starting in a trend. The trends are calculated using the original " The Sextet " indicator method. You get a free EA to trade with The Sextet Scalper Pro: Free EA . Default settings were optimized on GBPUSD H1 from 2017. EA could be tested on free demo version of The Sextet Scalper Pro, before purchase. Key Features: Uses The Sextet Trend Detection Method which is already a good strategy in itself for detecting l
Trend Ray
Andriy Sydoruk
The indicator shows the potential trend direction by cyclical-wave dependence. Thus, all the rays of the intersection will be optimal rays, in the direction of which the price is expected to move, taking into account the indicator period. Rays can be used as a direction for potential market movement. But we must not forget that the approach must be comprehensive, the indicator signals require additional information to enter the market.
Advanced Trend Regime
Shellard Securities (Pty) Ltd
The indicator has been designed to function on any time-frame and any pair.   This regime filter will help the trader better evaluate whether the current market is trending, and in which direction. It quickly reacts to changes in market dynamics using a series of advanced calculations. The user is able to select whether the calculation remains standard, or if a further filter constraint is added to the calculation.   A Yellow moving average of the signal has been included for the trader to smoot
PipFinite Trend PRO
Karlo Wilson Vendiola
4.9 (2775)
Breakthrough Solution For Trend Trading And Filtering With All Important Features Built Inside One Tool! Trend PRO's smart algorithm detects the trend, filters out market noise and gives entry signals with exit levels. The new features with enhanced rules for statistical calculation improved the overall performance of this indicator. Important Information Revealed Maximize the potential of Trend Pro, please visit www.mql5.com/en/blogs/post/713938 The Powerful Expert Advisor Version Automa
FreqoMaster
Stanislav Korotky
The main idea of this indicator is rates analysis and prediction by Fourier transform. The indicator decomposes exchange rates into main harmonics and calculates their product in future. The indicator shows 2 price marks in history, depicting price range in the past, and 2 price marks in future with price movement forecast. Buy or sell decision and take profit size are displayed in a text label in the indicator window. The indicator uses another indicator as an engine for calculations - FreqoMet
The indicator detects and displays 3 Drives harmonic pattern (see the screenshot). The pattern is plotted by the extreme values of the ZigZag indicator (included in the resources, no need to install). After detecting the pattern, the indicator notifies of that by a pop-up window, a mobile notification and an email. The indicator highlights the process of the pattern formation and not just the complete pattern. In the former case, it is displayed in the contour triangles. After the pattern is com
PZ Trend Trading
PZ TRADING SLU
4.75 (4)
许多盈利交易者不仅知道如何识别市场趋势,而且也能把握趋势建立后的交易机会。 Pz 趋势交易 指标设计用来在趋势行情中尽可能的赚取利润。 已建立的趋势提供了一揽子交易机会,但大多数趋势交易指标完全忽视了它们,让交易者在趋势行情时完全不知道该如何做!一般趋势指标只通知有关的趋势变化,但根本不足以得到卓越的回报. Pz 趋势交易 指标比一般趋势指标显示多达 20 倍的交易 , 因为它注重所谓的市场时机。它不仅显示当前的市场趋势,也有回调,内柱线的突破和调整。它令您在趋势回调之后介入,安全的柱线内突破金字塔加仓,以及发现潜在的反转,和已知的调整。 趋势改变 一个趋势改变在市场方向变化时发生。趋势变化在图表上用带数字的彩色圆圈显示。蓝色 (1) 信号为上涨开始, 而红色 (1) 信号为下跌开始。趋势变化并非评估当前价格动作的结果, 它意味着交易设置是不定时地。如果您正确使用本指标, 在趋势变化时, 您将将已经入场 (参看下面的调整)。 回调 但凡趋势在运动中,行情上下抖动,盈利者收割利润,且其它参与者入场。趋势回调代表好的买入机会,通常是由主力获利离场导致。如果行情在回调后回归上行, 指
Shark Deal Book
Philip Pankaj Suthagar
4 (3)
Term  "shark"  in the business world denotes a high volume investor who just made a good investment in a highly Potential business deal.So, sharks are the ones who make the market move. In our case, if an American shark bought a Japanese company, he/she has to convert American dollars into Japanese yen to make the deal. So, the demand for the Japanese yen will increase sharply. Thus USD/JPY will go short rapidly if the deal was from the shark. Another example, In the case of forex, if fed increa
Signal Undefeated   indicator is designed for trend and signal trading. This indicator generates trend signals.  It uses many algorithms and indicators to generate this signal. It tries to generate a signal from the points with the highest trend potential. This indicator is a complete trading product. This indicator does not need any additional indicators.  You can only trade with this indicator. The generated signals are displayed on the graphical screen.  Thanks to the alert features you can g
Title : UT_Bot - ATR-Based Trading Indicator Introduction : Discover the power of "UT_Bot," the ultimate trading indicator that leverages the Average True Range (ATR) to provide unparalleled accuracy in your trading decisions. If you're seeking a more reliable alternative to the Super Trend indicator, look no further. UT_Bot is your key to precision trading. Key Features : ATR-Powered Precision: UT_Bot uses the ATR to deliver accurate signals that adapt to market volatility. Enhanced Trend Detec
ATeam Divergence
Hoang Ngoc Thach
The CCI Divergence is a reasonably useful indicator in itself, but it is even more effective when used with divergence pattern trading. The CCI Divergence indicator signal is one of the most potent signals among the indicators that exist in the market. Here is new version for Divergence Indicator using CCI method, with more improvements. Divergences indicate a potential investment point because the directional moment does not confirm the price. A bullish divergence occurs when the underlying
FreqoMeterForecast
Stanislav Korotky
The main idea of this indicator is rates analysis and prediction by Fourier transform. Indicator decomposes exchange rates into main harmonics and calculates their product in future. You may use the indicator as a standalone product, but for better prediction accuracy there is another related indicator - FreqoMaster - which uses FreqoMeterForecast as a backend engine and combines several instances of FreqoMeterForecast for different frequency bands. Parameters: iPeriod - number of bars in the ma
[ MT5 Version ] Ultimate Alpha Trend MT4 Ultimate Alpha Trend is the first trend indicator, which combines volatility, volume, average price and momentum. The results is a highly versatile representation of trendy and sideways market conditions, highlighting, at the same time, significant supply and demand levels. The Ultimate Alpha Trend indicator can be used to find entry oportunities and to set SLs taking into consideration current market volatility, volume and momentum. Besides that, the in
The indicator detects and displays Shark harmonic pattern (see the screenshot). The pattern is plotted by the extreme values of the ZigZag indicator (included in the resources, no need to install). After detecting the pattern, the indicator notifies of that by a pop-up window, a mobile notification and an email. The indicator highlights the process of the pattern formation and not just the complete pattern. In the former case, it is displayed in the contour triangles. After the pattern is comple
Strength and weakness of currencies : Shows the currency status at any time, values between 50 and -50 are neutral, everything outside indicates a trend change  Waves : Current state of waves, daily, weekly monthly and yearly Recommended volume for trading a specific number of waves Yearly High Low Drawn waves on which the market will react in advance, without redrawing Yearly candle with bonus levels used to display deviations  For more info contact me
该产品的买家也购买
Atomic Analyst
Issam Kassas
5 (2)
首先值得强调的是,该交易指标是非重绘、非延迟的指标,这使其成为手动和机器人交易的理想选择。 Atomic Analyst是一种PA价格行动指标,利用价格的力量和动量来寻找市场上更好的机会。配备了高级过滤器,可帮助去除噪音和假信号,并提高交易潜力。使用多层复杂的指标,Atomic Analyst扫描图表,并将复杂的数学计算转化为任何初学者都能理解并用来做出一致交易决策的简单信号和颜色。 “Atomic Analyst”是专为新手和经验丰富的交易者量身定制的综合交易解决方案。它将高级指标和一流功能融合为一体的交易策略,使其成为所有类型交易者的多功能选择。 日内交易和剥头皮策略:专为快速准确的日内交易和短期交易而设计。 日内和摆动交易策略:可用作追求价格大幅波动的日内和摆动交易者的可靠工具。 多货币和市场:凭借其可靠的精度,在不同的工具和市场上运作。 多个时间框架:可在多个时间框架上使用,性能良好。 稳定性:所有指标均不重绘、不重绘和不滞后,确保可靠的信号。 信号清晰度:提供箭头信号,用于清晰的入场和出场点。 实时警报:通过交易入场、SL和TP警报通知交易者。 多个利润水平:使用
TPSproTREND PrO
Roman Podpora
5 (15)
TPSpro TRENDPRO  - is a trend indicator that automatically analyzes the market and provides information about the trend and each of its changes, as well as giving signals for entering trades without redrawing! The indicator uses each candle, analyzing them separately. referring to different impulses - up or down impulse. Exact entry points into transactions for currencies, crypto, metals, stocks, indices!  -  Version MT5               DETAILED DESCRIPTION        /       TRADING SETUPS           
Advanced Currency Strength28 Indicator
Bernhard Schweigert
4.9 (663)
目前26%的折扣 任何新手或专家交易者的最佳解决方案! 这个指标是一个独特的、高质量的、可负担得起的交易工具,因为我们纳入了一些专有的功能和一个新的公式。只需一个图表,你就可以读出28个外汇对的货币强度!想象一下,你的交易将如何得到改善,因为你的交易是在你的手中进行的。想象一下,你的交易将如何改善,因为你能够准确地确定新趋势或剥头皮机会的触发点? 用户手册:点击这里  https://www.mql5.com/en/blogs/post/697384 这是第一本,原版的! 不要买一个毫无价值的崇拜者的克隆品。 特别的 子窗口中的箭头显示强劲的货币势头GAP将指导你的交易! 当基础货币或报价货币处于超卖/超买区域(外盘斐波那契水平)时,在个人图表的主窗口中出现警告信号。 当货币力量从外围区间回落时,回撤/反转警报。 十字星模式的特别警报 可选择多个时间框架,以快速查看趋势! 货币强度线在所有的时间框架中都非常平稳,当使用较高的时间框架来识别总体趋势,然后使用较短的时间框架来确定精确的入口时,效果非常好。你可以根据自己的意愿选择任何时间框架。每个时间框架都由其自身进
目前八折优惠! 对任何新手或专家交易者来说都是最好的解决方案! 这个仪表板软件适用于28种货币对。它基于我们的两个主要指标(高级货币强度28和高级货币冲动)。它对整个外汇市场提供了一个伟大的概述。它显示高级货币强度值,货币运动速度和28个外汇对在所有(9)时间段的信号。想象一下,当你可以使用图表上的单一指标观察整个市场,以确定趋势和或剥头皮的机会时,你的交易将得到改善 我们已经在这个指标中建立了一些功能,使你更容易识别强势和弱势货币,同时识别和确认潜在的交易。该指标以图形方式显示货币的强势或弱势是增加还是减少,以及它在所有时间段的表现。 增加的新功能是动态市场斐波那契水平,它适应当前的市场条件变化,这是一个已经在我们的高级货币强度28和高级货币冲动指标中使用的成熟的加分项。 在交易时,总是将弱势货币和强势货币配对,这个新指标将帮助你做到这一点。 用户手册:点击这里  https://www.mql5.com/en/blogs/post/708783 特点  显示每个时间段的ACS28和GAP-speed(冲动)的货币强度值。 列:颜色代码以7种颜色
Quantum Trend Sniper Indicator MT4
Bogdan Ion Puscasu
4.59 (39)
介绍   量子趋势狙击指标 ,突破性的 MQL5 指标,正在改变您识别和交易趋势反转的方式!由拥有超过13年交易经验的资深交易员团队开发,     量子趋势狙击指标   旨在通过其创新的方式以极高的准确度识别趋势反转,将您的交易之旅推向新的高度。 ***购买量子趋势狙击指标,即可免费获得量子突破指标!*** 当量子突破指标识别出趋势反转时,它会向您发出警报和信号箭头,并建议您三个止盈水平。 它既适合新手交易者,也适合专业交易者。 量子 EA 通道:       点击这里 MT5版本:       点击这里 建议: 时间范围:  所有时间范围。为了获得最佳结果,我们建议在 M15、M30 和 H1 时间范围内使用它。 货币对:欧元兑美元、英镑兑美元、澳元兑美元、欧元兑英镑, EURAUD, XAUUSD 账户类型:ECN、Raw 或 Razor,点差极低 经纪时间:任意 经纪商:IC Markets、Pepperstone with Raw 和 Razor 的点差最低 建议止损:50 点 建议止盈水平:20 点、50 点和 1
TPSpro RFI Levels
Roman Podpora
5 (13)
A key element in trading is zones or levels from which decisions to buy or sell a trading instrument are made. Despite attempts by major players to conceal their presence in the market, they inevitably leave traces. Our task was to learn how to identify these traces and interpret them correctly. Reversal First Impulse levels (RFI)   -  Version MT5                INSTRUCTIONS                 RUS                 ENG                                       R ecommended to use with an indicator   -  
Quantum Breakout Indicator PRO
Bogdan Ion Puscasu
4.96 (26)
介绍     Quantum Breakout PRO   ,突破性的 MQL5 指标,正在改变您交易突破区域的方式!   Quantum Breakout PRO 由拥有超过 13 年交易经验的经验丰富的交易者团队开发,旨在通过其创新和动态的突破区域策略将您的交易之旅推向新的高度。 量子突破指标将为您提供带有 5 个利润目标区域的突破区域的信号箭头,以及基于突破框的止损建议。 它既适合新手交易者,也适合专业交易者。 量子 EA 通道:       点击这里 MT5版本:   点击这里 重要的!购买后请私信我领取安装手册。 建议: 时间范围:M15 货币对:GBPJPY、EURJPY、USDJPY、NZDUSD、XAUUSD 账户类型:ECN、Raw 或 Razor,点差极低 经纪商时间:GMT +3 经纪商:IC Markets、Pepperstone with Raw 和 Razor 的点差最低 规格: 不重漆! 最多 5 个建议利润目标区域 建议止损水平 可定制的盒子。您可以设置自己的 Box Time Start 和 Box Time E
FX Volume
Daniel Stein
4.6 (35)
通过 mql5 和 Telegram 上 的 " 晨间简报 "获取每日市场更新,包括详细信息和屏幕截图 ! 外汇交易量(FX Volume)是第一个也是唯一一个从经纪商角度真正洞察市场情绪的交易量指标。 直接在您的图表上看到这些信息是真正改变游戏规则和突破性的交易解决方案。 受益于独特的市场数据洞察,如 比率(Ratios )显示货币多头和空头头寸的比率(百分比 比率变化 显示所选时间段内的多头比率及其百分比变化 总交易量 显示货币的总交易量(多头和空头),以手为单位 多头 交易量显示货币所有多头头寸的交易量 空头 交易量显示所有货币空头头寸的交易量 净多头 显示净多头交易量,即所有多头头寸减去所有空头头寸(以手为单位)。 净多头百分比 显示货币净多头交易量的变化 请阅读我们的基本教程 -> "如何使用外汇交易量进行交易 " 获取更多信息,如常见问题、交易技巧和教程视频,请访问我们的 外汇交易量公共信息频道 请 安装并运行 SI Connect 以建立与我们数据中心的持续连接 背景信息 我们都知道,外汇是一个分散的市场。这就是为什么我们必须打破常规思维,开发一个独
FX Power MT4 NG
Daniel Stein
5 (8)
通过 mql5 和 Telegram 上 的晨间简报获取每日市场更新,包括详细信息和屏幕截图 ! FX Power MT4 NG 是我们长期以来非常受欢迎的货币强度计算器 FX Power 的下一代产品。 这款下一代强度计算器能提供什么?您所喜爱的原版 FX Power 的所有功能 附加功能 黄金/XAU 强度分析 更精确的计算结果 可单独配置的分析周期 可自定义计算限制,以获得更好的性能 为希望查看更多信息的用户提供特殊的多实例设置 无尽的图形设置,可在每个图表中设置您最喜欢的颜色 无数的通知选项,让您再也不会错过任何重要信息 采用 Windows 11 和 macOS 风格的全新圆角设计 神奇的移动指标面板 FX Power 主要功能 所有主要货币的完整强势历史 所有时间框架内的货币强弱历史 所有经纪商和图表的计算结果完全相同 100% 可靠的实时计算 -> 无重绘 可通过下拉列表选择分析时段 通过自定义模式单独配置分析时段 可在一个图表中使用多个实例 可移动 FX Power 显示屏(通过拖放) 适用于高分辨率 QHD、UHD 和 4K 显示器 自动终端配置 针对平板电脑
引入神奇外汇指标:释放精准交易的力量 你是否厌倦了寻找在所有时间框架上都能取得出色结果的完美外汇指标?别再继续寻找了!神奇外汇指标已经来到,改变您的交易体验,将您的利润推向新的高度。 神奇外汇指标基于尖端技术和多年的精心开发,堪称外汇市场上的强大和精确的巅峰之作。这个卓越的工具旨在满足各个层次的交易者需求,在追求持续盈利性方面提供无与伦比的优势。 神奇外汇指标的独特之处在于其无与伦比的适应性。无论您是日内交易者、波段交易者还是更喜欢长期持仓,该指标都经过优化,能在所有时间框架上取得出色的结果。然而,当在1小时时间框架上使用时,它的准确性和捕捉市场复杂走势的能力得到真正展示。 准备好对神奇外汇指标的准确性和可靠性感到惊讶。其先进的算法无缝结合了强大的指标、统计分析和趋势识别,实时为您提供全面的市场视图。指标的智能和动态信号使您能够自信地做出明智的交易决策,最大限度地提高获胜交易的机会。 不再犹豫和迷茫。神奇外汇指标消除了交易的猜测,使您在市场参与者中具有独特的优势。其用户友好的界面和直观的设计使得无论是经验丰富的专业人士还是初学者都能轻松掌握这一卓越工具的力量。 有了神奇外汇指标的支持,
Advanced Supply Demand
Bernhard Schweigert
4.92 (310)
现在优惠 33%! 任何新手或专业交易者的最佳解决方案! 该指标是一款独特、高质量、且价格合理的交易工具,因为我们已经整合了许多专有功能和新公式。 依据此更新,您将能够显示双重时间帧区域。 您不仅可以显示一个较高的时间帧,还可以同时显示图表时间帧,加上更高的时间帧:显示嵌套时区。 供需双方所有交易者都会喜欢它。 :) 重要信息披露 高级供需的最大潜力,请访问 https://www.mql5.com/zh/blogs/post/720245   想象您的交易如何得以改善,是因为您能够精准定位入场或目标位吗? 构建于新的底层算法,它可以更轻松地识别出买卖双方之间的潜在失衡。 这是因为它以图形方式展示供需最强劲区域,及其过去的表现(显示旧区域)。 这些功能旨在帮助您更轻松地发现最佳入场区域和价位。 现在您可以针对您的交易品种和时间帧来优化和编辑区域强度! 高级供需指标适用于所有产品和时间帧。 它是一个新的公式,非常新的功能是两个区域强度函数可由用户输入进行调整! 这在交易中是一大优势。 当您学习如何使用专有功能,例如带有价格游离最小 X 因子的区域强度时,您能够判断该区域强劲与否。 供
TrendMaestro
Stefano Frisetti
5 (2)
note: this indicator is for METATRADER4, if you want the version for METATRADER5 this is the link: TRENDMAESTRO recognizes a new TREND in the bud, he never makes mistakes. The certainty of identifying a new TREND is priceless. DESCRIPTION TRENDMAESTRO identifies a new TREND in the bud, this indicator examines the volatility, volumes and momentum to identify the moment in which there is an explosion of one or more of these data and therefore the moment in which prices have strong probability of f
Price Action Entry Alerts
Stephen Sanjeeve Sahayam
5 (3)
该指标筛选每个柱的买入或卖出压力,并识别 4 种具有最高交易量的蜡烛形态。然后使用多个线性过滤器过滤这些蜡烛以显示买入或卖出信号。结合更高的时间框架方向以及在高交易量时段进行交易时,信号效果最佳。所有过滤器都是可定制的并且独立工作。单击按钮即可查看单个方向的信号。 该指标还包含最重要的价格行为和智能货币概念,可以帮助您的决策过程。 信号和交易教育集于一工具之中。 特征 : 信号不会重新绘制。 识别吞没蜡烛、拒绝蜡烛、扩展范围蜡烛和 Pinbar 蜡烛。 显示每个有效信号的多个入场点、止损和多个止盈水平。 按高容量会话进行过滤。 按支撑/阻力位和蜡烛结构过滤。 按 MACD 柱状图过滤。 ICT 买方和卖方流动性水平(亚洲突袭/伦敦突袭/犹大摇摆)。 洁净空间或间隙检测。 识别停止搜寻级别。 基于纯粹的价格行为自动绘制支撑/阻力位。 前一日高点和前日低点。 心理数字和整点、半点和四分之一点的图表水平。 显示基于动态移动平均线的价格交叉和回调。 每日开盘价。 识别 HH、HL、LL 和 LH 点。 内置蜡烛倒计时和符号传播。 内置损益信息面板。 私人导师小组访问。 包括教育、分析和支
Entry Points Pro
Yury Orlov
4.7 (225)
这是一款 MT4 的趋势指标,可提供准确的入场交易信号,且无重绘或延迟。 它可应用在任何金融资产:外汇、加密货币、贵金属、股票、指数。 最好的结果出现在 M15+ 的时间帧内。 指标的 MT5 版本 重要! 购买后请联系我,以便获取详细指南和奖励。 视频 (6:22) - 一个信号赢取的利润等于指标价格的三倍。 视频 (4:44) - 它如何在测试器中工作,我的提示和技巧。 视频 (1:44) - 有关它如何处理加密货币和指数的几句话。 大多数交易者在 Entry Points Pro 指标的帮助下,在第一个交易周内就改善了他们的交易结果。 Entry Points Pro 指标的益处 入场信号无重绘或延迟 如果信号出现,并得到确认(如果信号所在烛条已收盘),则它不会再消失;不像是重绘指标,它会导致重大的财产损失,因为它们可以在显示信号后再将其删除。 无差错开仓 指标算法可令您找到入场交易(买入或卖出资产)的理想时机,从而提高每位交易者的成功率。 Entry Points Pro 可操作任何资产 它允许您在 MT4 平台上交易任何经纪商提供的加密货币、股票、
How to use Pair Trading Station Pair Trading Station is recommended for H1 time frame and you can use it for any currency pairs. To generate buy and sell signal, follow few steps below to apply Pair Trading Station to your MetaTrader terminal. When you load Pair Trading Station on your chart, Pair Trading station will assess available historical data in your MetaTrader platforms for each currency pair. On your chart, the amount of historical data available will be displayed for each currency pai
PTS Precision Index Oscillator V2
PrecisionTradingSystems
5 (1)
精密指数振荡器(Pi-Osc)由Precision Trading Systems的Roger Medcalf开发 版本2经过精心重新编码,以在您的图表上加载速度非常快,还加入了一些其他技术改进,以提高体验。 Pi-Osc旨在提供准确的交易定时信号,旨在找到极端的耗尽点,这些点是市场被迫去触及,以清理每个人的止损单。 该产品解决了一个古老的问题,即知道极端点在哪里,这使得交易员的生活变得更加简单。 这是一个高度复杂的共识指标,与行业标准的振荡器相比,具有一些强大的区别。 它使用的一些特征包括需求指数、资金流动、RSI、随机指标、模式识别、成交量分析、标准偏差极端点以及不同长度上述各种变化的分歧。 乍一看,对于未经培训的人来说,它似乎与任何其他振荡器没有什么不同,但当与其他振荡器(如RSI或动量等)相对比时,这个指标的真正威力开始显现。 据我所知,没有其他振荡器可以频繁地精确指出顶部和底部,具有相同的定期效率。 精密指数振荡器由许多不同的数学方程组成,用于测量多个时间框架采样中的价格和成交量变动,从而高度准确地预测趋势可能发生转折的位置。 PTS P
GOLD Impulse with Alert
Bernhard Schweigert
4.56 (9)
这个指标是我们2个产品 Advanced Currency IMPULSE with ALERT  +   Currency Strength Exotics 的一个超级组合。 它适用于所有时间框架,并以图形方式显示8种主要货币和一种符号的强势或弱势冲动! 该指标专门用于显示任何符号的货币强度加速,如黄金、异国货币对、商品、指数或期货。这是它的第一个指标,任何符号都可以被添加到第9行,以显示黄金、白银、石油、DAX、US30、MXN、TRY、CNH等的真实货币强度加速(冲动或速度)。 建立在新的基础算法上,它使识别和确认潜在的交易更加容易。这是因为它以图形方式显示了一种货币的强势或弱势是否正在加速,并测量了这种加速的速度--把它想象成你汽车中的速度表。当你加速时,事情显然会发生得更快,这在外汇市场上也是一样的,即如果你配对的货币正在向相反的方向加速,你就会发现一个潜在的有利可图的交易。 动态市场斐波那契28水平被用作警报触发器,将适应市场活动。如果冲动击中黄色触发线,你将收到警报。然后你就知道作为一个交易员应该做什么。货币对和方向已经给出。只需点击警报按钮,就可以
PTS Divergence Buy Finder
PrecisionTradingSystems
PTS - Divergence Buy Finder 由Precision Trading Systems制作 Precision Divergence Finder旨在精确找到市场底部,并经常成功。在技术分析中,挑选底部通常比挑选顶部容易得多,这个工具正是为了完成这个任务而设计的。在识别出牛市背离后,等待趋势上升再购买是明智的。您可以使用10或20个周期的最高点进场,或者使用15-30周期的移动平均线上升来识别趋势变化。 这个复杂的算法会实时逐根柱状图寻找并计算活跃的需求指数背离的数量。 该模型观察市场价格何时创出新低,而需求指数未创新低,从而产生背离。 该指标使用两个设置。     • 需求指数(DI)长度,它将为指标提供寻找的对象,并将为您选择的长度上的任何DI背离进行查找。     • 差异,这是[DI值现在]与[DI值长达200个周期以前]之间的背离量,对于它从各种回望期间找到的每个背离,它将在指标窗口中生成[1]输出。 最多检查20个周期,最大输出值将显示为20。 建议的设置 需求指数长度从15到100都可以使用,但最佳范围在20到60之间。 背离的差异为0.1至2
PTS Divergence Sell Finder V2
PrecisionTradingSystems
PTS Divergence Finder Sell Indicator(Roger Medcalf出品) - Precision Trading Systems。 该指标只提供看跌 - 卖出信号。 首先,我多次被问及为什么多年来一直提供买入信号的差异指标,而没有提供卖出差异指标。 我回答说,卖出差异信号不如买入差异信号可靠,这仍然是事实。 我们找到了一些解决办法,不是屈服于同行的压力,也不是修改我在十五年前制作的这个指标,而是通过更改默认设置来使其更加严格。 PTS差异查找器卖出指标是如何工作的? PTS差异查找器卖出指标准确测量了发生在需求指数中的差异数量,这是一个基于成交量的指标。由于MT4提供的是交易量而不是成交量,因此基础需求指数指标中发生的波动大约要小10倍,因此必须减小下面所述的差异输入。 这是一个子图二的柱状图样式指标,它绘制出看起来像是从底部升起的石笋一样的尖峰。 该指标检查了您指定的长度的基于成交量的需求指数指标的多个回溯期。它找到了价格中的高点,其中DI没有形成新的“局部”高点,并且与您输入的“差异”设置相差较远。 在众多人投票市场方向的流动市场中,效果最好。 每
TPA True Price Action indicator reveals the true price action of the market makers through 100% non-repainting signals (except early signals mode) strictly at the close of a candle! TPA shows entries and re-entries, every time the bulls are definitely stronger than the bears and vice versa. Not to confuse with red/green candles. The shift of power gets confirmed at the earliest stage and is ONE exit strategy of several. There are available now two free parts of the TPA User Guide for our custo
Cycle Sniper
Elmira Memish
4.4 (35)
NEW YEAR SALE PRICE FOR LIMITED TIME!!! Please contact us after your purchase and we will send you the complimentary indicators to complete the system Cycle Sniper is not a holy grail but when you use it in a system which is explained in the videos, you will feel the difference. If you are not willing to focus on the charts designed with Cycle Sniper and other free tools we provide, we recommend not buying this indicator. We recommend watching the videos about the indiactor and system before pu
Indicator : RealValueIndicator Description : RealValueIndicator is a powerful tool designed specifically for trading on the EURUSD pair. This indicator analyzes all EUR and USD pairs, calculates their real currency strength values, and displays them as a single realistic value to give you a head start on price. This indicator will tell you moves before they happen if you use it right. RealValueIndicator allows you to get a quick and accurate overview of the EURUSD currency pair tops and bottoms,
Reversal Sniper
Elmira Memish
5 (3)
Reversal Sniper is designed to find the extreme reversals of the price. Indicator collects data of Cycle Sniper Indicator. NOTE: REVERSAL SNIPER Indicator is made for Cycle Sniper Users as an additional tool.  However, it can be used by the traders who look for finding out strong reversal levels. Indicator works on all timeframes and all instruments. Reversal  Sniper  Checks: Harmonic Patterns RSI Zig Zag and Harmonic Swings Cycle Sniper Indicator's Buy / Sell Signals The complex algo i
XQ Indicator MetaTrader 4
Marzena Maria Szmit
3 (2)
Step into the realm of Forex trading with confidence and precision using XQ, a cutting-edge Forex indicator designed to elevate your trading game to unprecedented heights. Whether you're a seasoned trader or just stepping into the world of currency exchange,   XQ Forex Indicator   empowers you with the insights and signals needed to make informed trading decisions. The signal conditions are a combination of three indicators, and XQ Forex Indicator only display  medium and long-term trends . The
XPointer
Andrey Kozak
5 (3)
XPointer is a completely ready trading system. It shows the trader when to open and close a trade. It works on all currency pairs and all time frames. Very easy to use and does not require additional indicators for its operation. Even a beginner trader can start working with XPointer. But it will also be useful for professional traders to confirm the opening of orders. Features of the XPointer indicator It does not redraw its values. It works on all currency pairs and all time frames. It has a
NO REPAINT ADVANCED CHART PATTERN INDICATOR By definition, a price ( chart)  pattern is a recognizable configuration of price movement that is identified using a series of  trendlines  and/or curves. When a price pattern signals a change in trend direction, it is known as a reversal pattern; a continuation pattern occurs when the trend continues in its existing direction following a brief pause. Advanced Chart Pattern Tracker is designed to find the MOST ACCURATE patterns. A special script is
Currency Strength Exotics
Bernhard Schweigert
4.88 (33)
目前8折优惠! 对任何新手或专家交易者来说都是最好的解决方案! 这个指标是专门用来显示任何符号的货币强度,如异国货币对、商品、指数或期货。它是同类产品中的第一个,任何符号都可以添加到第9行,以显示黄金、白银、石油、DAX、US30、MXN、TRY、CNH等的真实货币强度。这是一个独特的、高质量的、负担得起的交易工具,因为我们已经纳入了一些专有的功能和一个新的公式。想象一下,你的交易将如何改善,因为你能够准确地确定新趋势或剥头皮机会的触发点? 用户手册:点击这里   https://www.mql5.com/en/blogs/post/708876 它适用于所有时间框架。你将很快能够看到TREND! 根据新的基础算法设计,它使识别和确认潜在交易变得更加容易。这是因为它以图形方式显示了8种主要货币和一种符号的强弱。 该指标显示了8种主要货币(澳元加元瑞士法郎欧元英镑日元新西兰美元)的强弱线,再加上一个符号! 该指标显示了符号的真实价值。例如:对于XAUUSD(黄金):价格以美元报价。如果黄金在上涨,你怎么能知道是黄金的强势还是美元的弱势?只有当黄金走强时,我们才会进行
Royal Scalping Indicator M4
Vahidreza Heidar Gholami
4.17 (6)
Royal Scalping Indicator is an advanced price adaptive indicator designed to generate high-quality trading signals. Built-in multi-timeframe and multi-currency capabilities make it even more powerful to have configurations based on different symbols and timeframes. This indicator is perfect for scalp trades as well as swing trades. Royal Scalping is not just an indicator, but a trading strategy itself. Features Price Adaptive Trend Detector Algorithm Multi-Timeframe and Multi-Currency Trend Low
Gartley Hunter Multi MT4
Siarhei Vashchylka
4.67 (3)
Gartley Hunter Multi - An indicator for searching for harmonic patterns simultaneously on dozens of trading instruments and on all classic timeframes: (m1, m5, m15, m30, H1, H4, D1, Wk, Mn). Manual (Be sure to read before purchasing) | Version for MT5 Advantages 1. Patterns: Gartley, Butterfly, Shark, Crab. Bat, Alternate Bat, Deep Crab, Cypher 2. Simultaneous search for patterns on dozens of trading instruments and on all classic timeframes 3. Search for patterns of all possible sizes. Fr
Supply and Demand Dashboard PRO
Bernhard Schweigert
4.82 (22)
目前八折优惠! 这个仪表板是一个非常强大的软件,可用于多个符号和多达9个时间段。 它是基于我们的主要指标(最佳评论:高级供应需求)。 Advanced Supply Demand 该仪表板提供了一个伟大的概述。它显示。   筛选后的供需值,包括区域强度评级。 区间内和区间外的点位距离。 它突出了嵌套的区域。 在所有(9个)时间段内,它对所选符号发出4种警报。 它是高度可配置的,以满足您的个人需求! 您的利益! 对每个交易者来说,最重要的问题是。 什么是入市的最佳水平? 在强大的供应/需求区域内或附近进入你的交易,以获得最佳的成功机会和风险/回报。 我的止损的最佳位置是哪里? 把你的止损放在强势供应/需求区的下方/上方是最安全的。 我的最佳盈利目标是什么? 你的退出策略和你的进入策略一样重要,了解更高的时间框架图可以帮助你。对于买入,使用下一个供应区作为目标,对于卖出,使用下一个需求区作为目标。在回撤到供应区或需求区时进场,以确保有足够的利润空间,达到更高的时间框架的供应和需求,将增加你的利润。 为什么我们要过滤强区和
作者的更多信息
This script allows selecting the TakeProfit and StopLoss levels. It analyzes the history data, and then calculates the probability of reaching a given price level. How the script works Suppose you have a trading strategy and you want to select the TakeProfit and StopLoss levels. Run the script and set the parameter: Number of Bars - the average position holding time in bars. Once the script operation is complete, the AIS-PPL.csv file will be created in the Files folder in the terminal data cat
FREE
该脚本基于使用随机数生成器模拟贸易交易。即使使用相同的输入参数,这也可以使您获得完全不同的结果。运行脚本时,将打开一个对话框,您可以在其中设置外部变量的所需值。 在块中,TradingOptions定义了模拟交易所需的基本参数。 StartBalance  - 设置交易余额的初始大小。 NumberTrade  - 设置脚本运行时将建模的交易事务数。为了获得或多或少的显着结果,该参数必须大于30。 ProbabilityWinning  - 获胜交易的概率。表示为百分比,有效值为1到99。 Min.StopLoss  - 表示以点为单位的最小StopLoss值,将在建模交易操作时使用。 Max.StopLoss  - 以磅为单位设置StopLoss的最大值。 PositiveWin。 - 该变量建立修正,借助于该修正在模拟交易中获得积极的期望。 脚本的工作是执行以下操作。首先,计算获胜交易的预期概率 -  PW。之后,随机设置StopLoss的值,该值将在此事务中使用。考虑到预期收益应为正数,计算TakeProfit规模。考虑到点值,TakeProfit和StopLoss水平将转换为
FREE
MinDeposit MT5
Aleksej Poljakov
3 (1)
The script analyzes the history of quotes and gives recommendations on the minimum deposit. The calculations take into account the variability of prices and the standard deviation. Margin requirements for the instrument are also taken into account. The result of the script is the minimum recommended deposit for trading the given currency pair.
FREE
The script allows selecting the required 'Filter level' value of the AIS-MTF MT5 indicator. Run the script on the required chart and selected timeframe. Once its operation is complete, the HPS.csv file will be created in the Files folder. Open the file. You will see three columns. The 'Filter lvl' column represents the value of the 'Filter level' for the AIS-MTF indicator. Am. dev. - degree and direction of the indicator's deviation from the price level (sorted in ascending order). Negative valu
FREE
该脚本基于使用随机数生成器模拟贸易交易。即使使用相同的输入参数,这也可以使您获得完全不同的结果。运行脚本时,将打开一个对话框,您可以在其中设置外部变量的所需值。 在块中,TradingOptions定义了模拟交易所需的基本参数。 StartBalance  - 设置交易余额的初始大小。 NumberTrade  - 设置脚本运行时将建模的交易事务数。为了获得或多或少的显着结果,该参数必须大于30。 ProbabilityWinning  - 获胜交易的概率。表示为百分比,有效值为1到99。 Min.StopLoss  - 表示以点为单位的最小StopLoss值,将在建模交易操作时使用。 Max.StopLoss  - 以磅为单位设置StopLoss的最大值。 PositiveWin。 - 该变量建立修正,借助于该修正在模拟交易中获得积极的期望。 脚本的工作是执行以下操作。首先,计算获胜交易的预期概率 -  PW。之后,随机设置StopLoss的值,该值将在此事务中使用。考虑到预期收益应为正数,计算TakeProfit规模。考虑到点值,TakeProfit和StopLoss水平将转换为
FREE
选择StopLoss和TakeProfit的水平会对交易的整体表现产生非常强烈的影响。除了交易交易的明显参数 - 可能获胜或可能亏损的大小 - 止损和止盈的水平也会影响交易的预期持续时间以及一般交易的盈利能力。 如果您已使用“ AIS-ODT ”脚本确定了最佳事务持续时间,则可以开始确定与StopLoss和TakeProfit级别关联的参数。 为此,我们按以下步骤操作。首先,我们将确定在一个方向或另一个方向上的所有可能的价格偏差,并计算在一定时间内实现它们的概率。之后,您可以根据其大小,概率和预期利润值计算StopLoss和TakeProfit的最佳水平。 为此,请在感兴趣的货币对的图表和所需的时间范围内运行脚本。使用属性窗口中的ILB参数,设置交易仓位的期望持续时间,以柱数表示。在实用程序的工作期间,分析整个历史记录的数据,并选择最佳值。在脚本结束时,形成了两个文件 - “Buy.csv”和“Sell.csv”,其中包含获得结果的表 - 图1。 在表格的第一列中,指示了可能的TakeProfit大小,在第二列中,指示了最佳的StopLoss大小。第三列显示以百分比表示获胜这些参数的概
FREE
该脚本的设计使交易者可以确定交易交易的平均持续时间,在此期间可能的利润和损失的比率将是最佳的。 首先,让我们看一下确定贸易交易最佳持续时间的一般方法。我们介绍以下变量: R  - 交易的结果; T  - 交易开放的时间; W  - 上一笔交易结束与下一交易开盘之间的时间。 每个交易者都努力在最短的时间内获得最大的利润。这种愿望可以通过以下简单表达来描述: R/(T+W)→max 。 很明显,变量  T  和  W  取决于交易的总持续时间和交易数量。设  ATD  是交易的平均持续时间, N  是交易总数。然后,交易的平均持续时间应与其总数的平方根成比例增长,即: ATD~√N 。 但是,有一些有根据的问题出现 - 任何交易持续时间等同于其他交易持续时间,交易持续时间如何影响交易操作的结果?为了得到所提问题的答案,我们将对历史数据的价格行为进行一项小型研究。 我们继续如下。我们将历史数据划分为由一定数量的柱组成的系列,对应于交易的平均持续时间。在每个这样的系列中,我们计算最大价格变动,我们将引用更大的偏差  StopLoss ,并且更小 - 到 TakeProfit 。 之后,我们将计
FREE
MinDeposit
Aleksej Poljakov
5 (1)
The script analyzes the history of quotes and gives recommendations on the minimum deposit. The calculations take into account the variability of prices and the standard deviation. Margin requirements for the instrument are also taken into account. The result of the script is the minimum recommended deposit for trading the given currency pair.
FREE
选择StopLoss和TakeProfit的水平会对交易的整体表现产生非常强烈的影响。除了交易交易的明显参数 - 可能获胜或可能亏损的大小 - 止损和止盈的水平也会影响交易的预期持续时间以及一般交易的盈利能力。 如果您已使用“ AIS-ODT ”脚本确定了最佳事务持续时间,则可以开始确定与StopLoss和TakeProfit级别关联的参数。 为此,我们按以下步骤操作。首先,我们将确定在一个方向或另一个方向上的所有可能的价格偏差,并计算在一定时间内实现它们的概率。之后,您可以根据其大小,概率和预期利润值计算StopLoss和TakeProfit的最佳水平。 为此,请在感兴趣的货币对的图表和所需的时间范围内运行脚本。使用属性窗口中的ILB参数,设置交易仓位的期望持续时间,以柱数表示。在实用程序的工作期间,分析整个历史记录的数据,并选择最佳值。在脚本结束时,形成了两个文件 - “Buy.csv”和“Sell.csv”,其中包含获得结果的表 - 图1。 在表格的第一列中,指示了可能的TakeProfit大小,在第二列中,指示了最佳的StopLoss大小。第三列显示以百分比表示获胜这些参数的概
FREE
该脚本的设计使交易者可以确定交易交易的平均持续时间,在此期间可能的利润和损失的比率将是最佳的。 首先,让我们看一下确定贸易交易最佳持续时间的一般方法。我们介绍以下变量: R - 交易的结果; T - 交易开放的时间; W - 上一笔交易结束与下一交易开盘之间的时间。 每个交易者都努力在最短的时间内获得最大的利润。这种愿望可以通过以下简单表达来描述: R/(T+W)→max 。 很明显,变量 T 和 W 取决于交易的总持续时间和交易数量。设 ATD 是交易的平均持续时间, N 是交易总数。然后,交易的平均持续时间应与其总数的平方根成比例增长,即: ATD~√N 。 但是,有一些有根据的问题出现 - 任何交易持续时间等同于其他交易持续时间,交易持续时间如何影响交易操作的结果?为了得到所提问题的答案,我们将对历史数据的价格行为进行一项小型研究。 我们继续如下。我们将历史数据划分为由一定数量的柱组成的系列,对应于交易的平均持续时间。在每个这样的系列中,我们计算最大价格变动,我们将引用更大的偏差 StopLoss ,并且更小 - 到 TakeProfit 。 之后,我们将计算整个历史中价格范围的
FREE
The script allows selecting the required 'Filter level' value of the AIS-MTF indicator. Run the script on the required chart and selected timeframe. Once its operation is complete, the HPS.csv file will be created in the Files folder. Open the file. You will see three columns. The 'Filter lvl' column represents the value of the 'Filter level' for the AIS-MTF indicator. Am. dev. - degree and direction of the indicator's deviation from the price level (sorted in ascending order). Negative values i
FREE
This script allows selecting the TakeProfit and StopLoss levels. It analyzes the history data, and then calculates the probability of reaching a given price level. How the script works Suppose you have a trading strategy and you want to select the TakeProfit and StopLoss levels. Run the script and set the parameter: Number of Bars - the average position holding time in bars. Once the script operation is complete, the AIS-PPL.csv file will be created in the Files folder in the terminal data cat
FREE
AIS 正确平均线指标允许您设置市场趋势运动的开始。该指标的另一个重要品质是趋势结束的明确信号。指标不会重新绘制或重新计算。 显示值 h_AE - AE 通道的上限 l_AE - AE通道的下限 h_EC - 当前柱的高预测值 l_EC - 当前柱的低预测值 使用指标时的信号 主要信号是通道AE和EC的交点。 当 l_EC 线高于 h_AE 线时,可能会开始上升趋势。 在 h_EC 线低于 l_AE 线之后,可以预期下降趋势的开始。 在这种情况下,应注意 h_AE 和 l_AE 线之间的通道宽度。它们之间的差异越大,趋势就越强。您还应该注意 AE 通道实现的局部高点/低点。这时,价格变化的趋势变得最强。 可定制的指标参数 设置指标包括根据时间范围选择 LRH 参数。此参数的有效值范围为 1 到 350。 此参数越小,指标越敏感,错误信号的增加可能。另一方面,此参数不应设置得太高,因为指标会变得不那么敏感并会跳过信号。
AIS Weighted_Moving_Average 指标计算加权移动平均线,并允许您确定趋势市场运动的开始。 权重系数的计算考虑了每个柱的具体特征。这使您可以过滤掉随机的市场走势。 确认趋势开始的主要信号是指标线方向的变化和穿过指标线的价格。 WH(蓝线)是高价的加权平均值。 WL(红线)是最低价的加权平均值。 WS(绿线)是所有价格点的加权平均值。 选项 LH - 计算值的柱数。 要快速选择 LH,您首先需要检查是较高时间范围的倍数的值。 例如,指标设置为 M15。 然后我们检查以下LH的值 周期 M30/M15 = 2 期间 H1/M15 = 4 期间 H4/M15 = 16 周期 D1/M15 = 96 周期 W1/M15 = 480 它们之间的值也可能是有趣的。
AIS Advanced Grade Feasibility 指标旨在预测未来价格可能达到的水平。他的工作是分析最后三个柱形图并在此基础上进行预测。该指标可用于任何时间范围和任何货币对。在设置的帮助下,您可以达到预期的预测质量。 预测深度 - 以条形图设置所需的预测深度。建议在 18-31 内选择此参数。 你可以超越这些限制。但在这种情况下,预测水平的“固定”是可能的(对于小于 18 的值),或者水平宽度过大(对于大于 31 的值)。 置信水平 1、置信水平 2 和置信水平 3 - 预测置信水平。可在 1-99 范围内设置。置信度 1 应该大于置信度 2,置信度 3 应该是最小的。 这些水平中的每一个都显示价格将达到此值的概率百分比,该值由预测深度参数确定的柱线数量决定。 Color lvl high 和 Color lvl low - 允许您选择线条的颜色 Style lvl - 允许您选择与级别对应的线条样式 宽度 lvl - 设置与级别对应的线的宽度
The indicator is designed to measure the price volatility. This allows determining the moments for opening or closing trade positions more accurately. High intensity of the market indicates the instability of its movement, but allows for better results. And, conversely, low intensity of the market indicates the stability of its movement. Parameters Bars to process - the number of bars to measure the price movements. A low value of this parameter allows determining the moments of rapid price mo
This indicator uses the Fibonacci p-numbers to smooth a price series. This allows combining the advantages of the simple and exponential moving averages. The smoothing coefficients depend on the level of the p-number, which is set in the indicator parameters. The higher the level, the greater the influence of the simple moving average and the less significant the exponential moving average. Parameters Fibonacci Numbers Order - order of the Fibonacci p-number, specified by trader. Valid values
The indicator is based on the analysis of interaction of two filters. The first filter is the popular Moving Average. It helps to identify linear price movements and to smooth minor price fluctuations. The second filter is the Sliding Median. It is a non-linear filter. It allows to filter out noise and single spikes in the price movement. A predictive filter implemented in this indicator is based on the difference between these filters. The indicator is trained during operation and is therefore
This indicator studies the price action as a combination of micro-trends. All micro-trends are analyzed and averaged. Price movement is filtered based on this averaging. IP_High and IP_Low (blue and red dashed lines) show the instantaneous price movement. They display the forecast only for the current price values, taking into account only the number of bars defined by the 'Filter level' parameter. SP_High and SP_Low (blue and red solid lines) smooth the price movements with respect to history.
This indicator implements the process of simple linear smoothing. One of the disadvantages of exponential smoothing is the rapid attenuation of the signal. This does not allow for a full-fledged monitoring of long-term tendency of a price series. Linear smoothing allows fine-tuning the signal filtering. The indicator is configured by selecting the parameters: LP - period of smoothing. The higher the value, the more long-term tendencies are displayed by the indicator. Valid values are from 0 to 2
该指标是基于中值和移动平均特性的组合的顺序混合滤波器。 使用中值允许滤除价格序列值中的异常异常值和随机脉冲。同时,中值滤波器不会对价格变动的趋势起作用,而是保持不变。 由于中值滤波器是非线性的,因此使用简单移动平均值进行平均来平滑其值。这种方法使我们不仅可以更准确地识别趋势,还可以更准确地识别价格变动中的周期性成分。此外,它还增加了指标对价格变化的敏感度,并减少了价格序列与指标读数之间的延迟。因此,指标可以相当准确地警告新趋势的开始,以及旧趋势的结束。 您可以使用 FL 参数调整滤波器的深度及其灵敏度。其允许值为0到63.同时, 2 * FL + 1 条用于计算指标值。因此,FL值越大,指标显示价格图表的趋势越强。
该指标是两个改进的Lanczos滤波器的组合。 第一个过滤器用于推断价格。根据过去的价值,他预测当前柱内可能的价格变动。也就是说,它表明如果过去的趋势保持不变,价格会是多少。 第二个过滤器,用于平滑和平均窗口内的价格,由过滤器的级别决定。由于选择了权重,此过滤器最积极地响应价格变动中存在的周期性组件。 可以使用EF和IF参数调整指标。通过选择 EF 和 IF 的值,您可以获得有关趋势价格变动开始的信号。 EF   - 指数滤波器的窗口大小。有效值为 EF = 0 ... 255 。并且在计算期间处理的条数是 2 * EF + 1 。该参数越大,价格序列的过去价值的影响越大。结果以实线绘制。 IF   - 调整平均窗口的大小。 IF = 0 ... 255 的值。要计算的条数是 2 * IF + 1 。 IF 值越大,使用此过滤器检测到价格变动的较长时段。结果以虚线显示在图表上。
让我们看一下外汇市场价格变化的本质,而不是关注这些变化发生的原因。这种方法将使我们能够确定影响价格变动的主要因素。 例如,让我们看一下欧元兑美元货币对和H1时间框架的开盘价。对于这些价格,我们构建了Lameray图(图1)。 在该图中,可以看出价格变动基本上根据线性方程发生。要确定此等式的参数,可以使用最小二乘法。在这个特定的例子中,改变开盘价的等式采用以下形式: Open [i] = 0.99989 * Open [i + 1] +0.00013。 让我们来看看这个等式如何充分描述价格变动。为此,我们删除线性分量并分析残差(图2)。 从图中可以清楚地看出,这些残留物相当混乱,如果我们将它们视为噪声,我们可以得到一个相当简单的系统来预测下一个柱的开盘价,这是以该指标的形式实现的。
该指标更具信息量。他的工作基于这样的假设,即市场中的价格变动可以表示为特定颜色的噪声,这取决于价格值分布的参数。由此,可以从不同角度分析价格变化,并将价格变动视为特定颜色的噪声,可以获得有关市场当前状态的信息并对价格行为进行预测。 在分析指标读数时,会考虑指标线的位置 - 它们位于当前柱的开盘价的上方或下方以及距离它的距离。 白噪声(白噪声) - 这种方法的特点是价格(当前和史前)被认为功率相等,这与简单的移动平均值相结合。白噪声信号更有可能证实这一特征 - 它越偏离当前价格,市场中的趋势运动就越强烈。相反,如果白噪声线接近开盘价,那么这就是趋势结束或横向价格变动的证据。 闪烁噪声(闪烁噪声)概述了趋势的上边界或下边界(取决于线是否高于或低于价格)。此外,这种噪音线与货币对价格的交叉点可以作为新趋势开始的证据,甚至是短期趋势的开始。 布朗噪声在很多方面的行为类似于指数平滑。因此,噪声线跟随价格,只有市场突然和突然的变化才有可能出现大的偏差。 蓝噪声显示趋势对当前趋势的强烈程度。由于蓝色噪声线与当前价格存在较大偏差,我们可以说趋势已经耗尽其力量并接近完成。 紫色噪音表明周期性或周期性价
尽管“ AIS Color Noise Filter ”指示器存在一些缺点,但使用它来平滑价格序列和预测价格的想法看起来非常有吸引力。 这是由于以下几个原因: 首先,考虑到几个噪声成分,可以建立相互独立的因素预测,从而提高预测质量; 其次,价格序列的噪声特征在整个历史中表现得相当稳定,从而可以获得稳定的结果; 最后,噪声变化使我们希望预测系统非常敏感,并且它对价格变化的反应将非常快。 因此,我们得到一个指标,尽管有所有简化,但能够准确预测价格将会移动的渠道。该指标的主要优点是速度快,易于学习。主要缺点是指标无法选择最重要的预测因素。 LH 是一个参数,用于设置进行预测的历史数据的长度。其允许值为0  -  255,而指标处理的柱数超过此参数指定的单位数。
很多时候,在金融系列的研究中应用他们的平滑。使用平滑,您可以删除高频成分 - 据信它们是由随机因素引起的,因此无关紧要。平滑总是包括一些平均数据的方法,其中时间序列中的随机变化相互吸收。大多数情况下,为此目的,使用简单或加权移动平均方法,以及指数平滑。 这些方法中的每一种都有其优点和缺点。因此,简单的移动平均值简单直观,但其应用需要时间序列的周期和趋势分量的相对稳定性。另外,信号延迟是移动平均值的特征。指数平滑方法没有滞后效应。但即使在这里也存在缺陷 - 只有在将系列与随机异常值对齐时,指数平滑才有效。 简单和指数平均值之间的合理折衷是使用加权移动平均线。但是,存在选择特定重量值的问题。让我们一起尝试解决这个问题。 因此,首先要定义我们希望从平滑过程中实现的目标: •首先,我们需要从价格序列中删除随机变化和噪音; •其次,我们希望识别异常排放和异常价格行为,这些行为也可用于贸易; •最后,平均程序应确定市场中存在的可持续趋势。 当然,我们希望平滑程序适应当前的市场情况。 为了获得理想的结果,我们将根据此价格水平与研究期间的最高和最低价格之间的差异来计算权重。通过这种方法,我们得到一个
为了隔离长期和非随机组件,不仅要知道价格变化了多少,还要知道这些变化是如何发生的。换句话说 - 我们不仅对价格水平的价值感兴趣,而且对这些水平相互替代的顺序感兴趣。通过这种方法,人们可以找到影响(或可能影响)特定时间点价格变化的长期和稳定因素。了解这些因素可以让您做出或多或少准确的预测。 让我们确定我们希望从财务系列的分析中得到什么具体结果: •首先,我们需要强调这一趋势,如果它存在于市场中; •其次,我们需要确定周期性成分; •第三,结果应足够稳定,可用于预测; •最后,我们的分析方法应该适应当前的市场形势。 为了满足指定的条件,我们使用相对价格变化的回归分析,并基于该模型做出指标。该指标的算法基于对历史数据的学习,其工作在交易者的完全控制之下。 LH 是一个参数,用于确定用于平滑金融系列的柱数。其允许值介于0到255之间。 UTS 是影响学习速度和深度的参数。它的值也在0到255之间。如果UTS的值为零,则在整个历史记录中进行学习。在所有其他情况下,训练集会不时更新。更新越频繁,UTS值越小。 该指标的主要缺点是,当平滑金融系列被认为是静止时,这可能会导致一些延迟。
其中一种强大的分析方法是使用Levy流程对财务系列进行建模。这些过程的主要优点是它们可用于模拟大量现象 - 从最简单到最复杂。我只想说市场中分形价格变动的想法只是Levy过程的一个特例。另一方面,通过适当选择参数,任何Levy过程都可以表示为简单的移动平均值。图1显示了一个Levy过程的示例,其中片段放大了几次。 让我们考虑使用Levy流程来平滑价格图表的可能性。首先,您需要选择Levy过程的参数,以便它可以用于模拟线性过程。然后我们得到一个权重系统,其中包括不同符号的系数。有了这个,我们不仅可以平滑金融范围,还可以跟踪其中存在的反趋势和周期性成分。 通过选择参数 LF 来配置指示器的操作。它决定了故事的深度,并将对其进行分析。此参数的允许值位于0  -  255之间。用于计算的条形数将比此数字多两个。 蓝线表示高价平滑的结果,绿线表示收盘价,红线表示低价。 该指标的主要缺点是根据严格定义的算法执行抗锯齿,该算法没有考虑市场中的急剧和强烈变化。此外,与所有平滑指标一样,存在可以达到简单移动平均值的滞后。
AIS Channel Price
Aleksej Poljakov
通常,交易者面临着确定价格在不久的将来可能发生变化的程度的任务。为此,您可以使用Johnson分发类型SB。这种分布的主要优点是即使只有少量的累积数据也可以使用它。用于确定此分布参数的经验方法允许您准确地确定价格通道的最大和最小水平。 这些值可用于不同的情况。例如,它们可用于设置市场订单的止损和止盈水平,或挂单的入场点。此外,使用追踪止损时可以定向这些水平。此外,在历史足够大的情况下,指标可能预示着上升趋势或下降趋势的开始。嗯,或者说它的结束,如果这样的趋势是。 该指标的主要缺点是对价格排放的敏感度极高,以及对市场形势变化的反应较迟。 蓝色和红色线分别显示价格通道的最大值和最小值。绿线表示在给定市场情况下价格的均衡值。 使用 LB 参数配置指标。此参数确定将在计算中使用的柱数,其允许值在2-64之间。
此指标可让您确定价格达到一个或另一个级别的可能性。它的算法非常简单,并且基于对特定货币对的价格水平的统计数据的使用。由于收集的历史数据,可以确定价格在当前柱形期间的变化程度。 尽管简单,但该指标可以为交易提供宝贵的帮助。因此,在其帮助下,可以确定交易头寸的TakeProfit和StopLoss水平。它可以帮助确定挂单的价格和确定TrailingStop的价格水平。 此外,该指标可以纳入现有战略。例如,您使用某种日内策略。然后,通过在D1时间框架上设置此指标,您可以在克服已经不希望开启新交易头寸之后获得水平。 该指标的主要缺点是它完全依赖于历史数据,并且不会以任何方式对某些当前的市场变化作出反应。 通过选择输入参数-L1 ... L4来执行该指标的设置 - 每个输入参数确定从每个柱的开盘价达到价格价格的概率。每个参数的值必须在99 ... 0之内,并且以下每个参数必须严格小于前一个参数。 尼古拉·尼古拉耶维奇(Nikolai Nikolaevich)是创造这个指标的意识形态灵感,如果你喜欢这个指标,那就写下几句话,我会告诉他。
筛选:
无评论
回复评论