• 概述
  • 评论 (2)
  • 评论 (2)
  • 新特性

Support and Resistance Dashboard MT5

5

40% off. Original price: $50

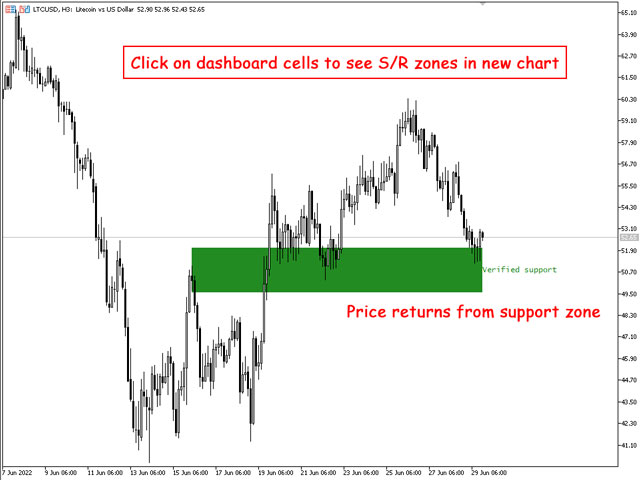
Support and Resistance Dashboard for MT5 is a multi-timeframe and multi-symbol scanner and alert system that finds S/R zones and pivot points for all timeframes and symbols and alerts when price has interaction with them.

If you are using support and resistance (or supply and demand) zones in your trading strategy, this dashboard and its alert and filtering system is a big time saver for you.

Download demo version (works on M4,M5,M6,M12,H3,H8 timeframes)

Full description of scanner parameters -> click here.

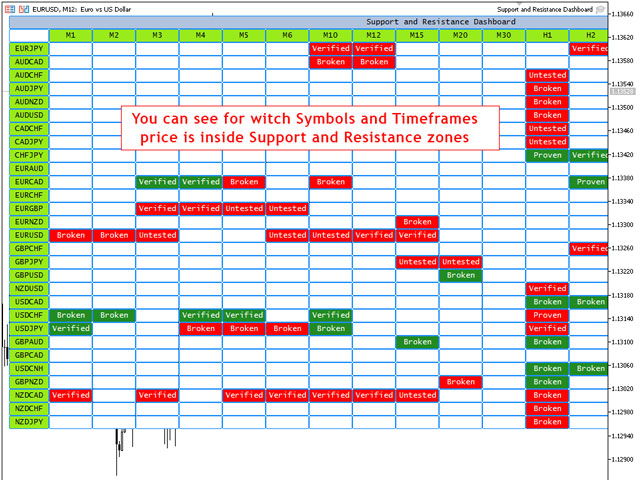
Also, if you are using other trading strategies, you can use this dashboard to avoid getting caught in support and resistance zones. Dashboard shows if the price is in S/R zones without the need to manually check all timeframes.

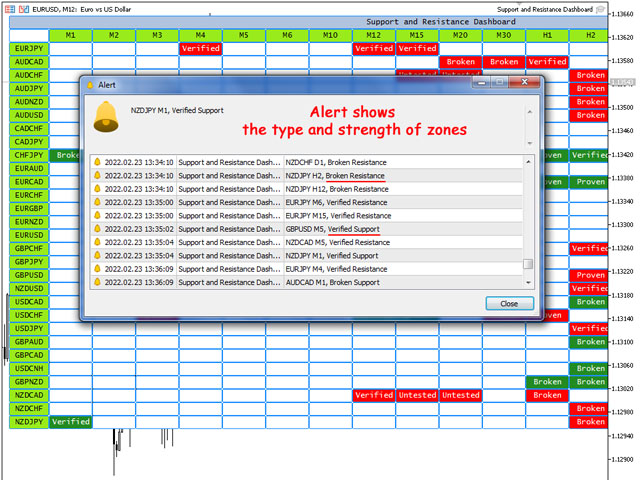
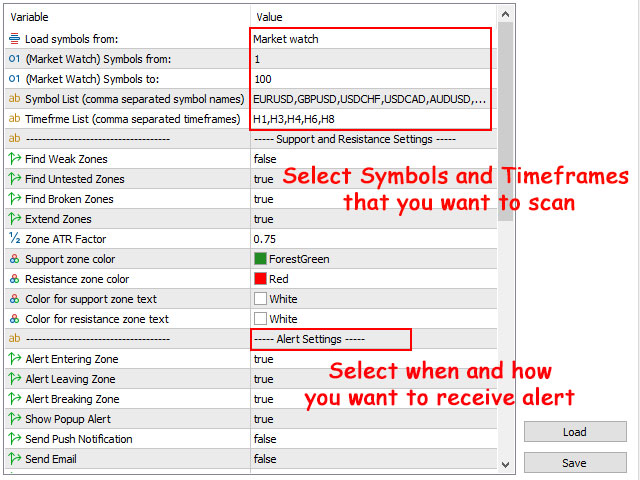
You don't need any more checking different symbols and timeframes to see if the price is inside the support or resistance zones, just run the dashboard and check the chart when an alert happens (you can select symbols and timeframes that you want to receive alerts).

Informative Dashboard:

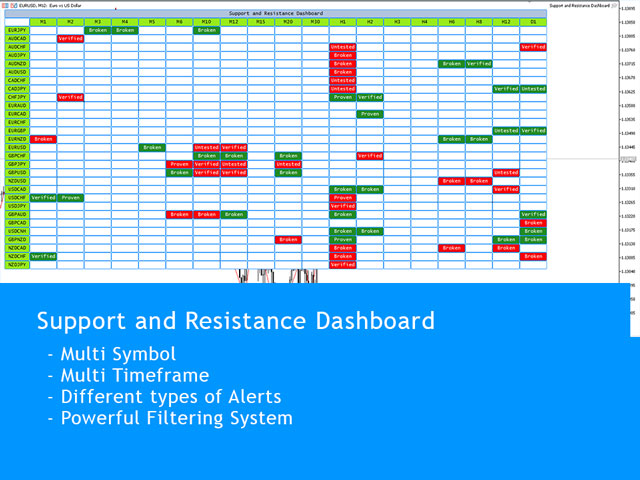
  • Dashboard shows if price has interaction with support and resistance zones from M1 to W1 timeframes for all defined symbols.
  • Cell text shows the strength of support and resistance zones and the cell color shows the type of support and resistance zone.
  • The pivot column shows the type and timeframe of pivot point levels that price breaks them or returns to them.
  • By clicking on any of the dashboard cells, you can see the nearest S/R zones to the price and the pivot levels on the new chart.

Dashboard shows Strengths of Support and Resistance Zones:

Zones have different strengths that are:

  • Weak fresh zones: high and low points in trend that price didn't touch them again yet
  • Fresh zones: important high and low points (major turning points) that price didn't touch them again yet
  • Verified zones: strong zones, price touched them before but couldn't break them
  • Proven zones: verified zone that at least four times the price can't break it
  • Broken zones: zones that price breaks them (not applied for weak zones)

Pivot Points Features:

  • Support and resistance dashboard finds the daily, weekly and monthly pivot point levels on the chart.
  • You can receive alert when price breaks a pivot point level or returns to it.
  • You can choose between 5 different calculation type of pivot points (standard, fibonacci, camarilla, woodie and demark).

Powerful alert filters:

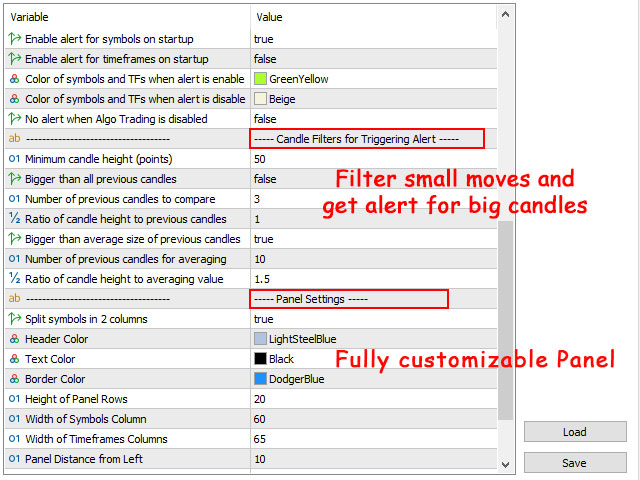
Dashboard has 6 filters to ignoring low quality alerts and finding best prices for order setups. 
  • minimum candle height
  • minimum candle body to height ratio
  • minimum candle height to zone height ratio
  • comparison between candle height and the height of previous candles
  • comparison between candle body and average body length of previous candles
  • comparing the ratio of candle body to ATR value

Dashboard Features:

  • You can set the parameters for support and resistance zones in dashboard input parameters.
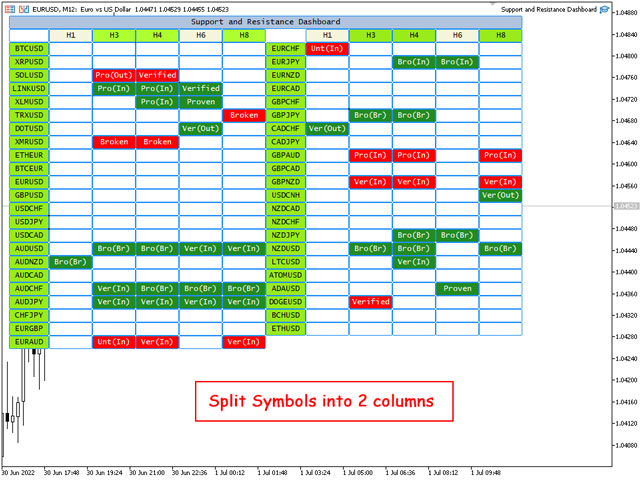
  • You can split the symbols into 2 columns to show more symbols on the chart.
  • You can separate symbols into multiple dashboards with different parameters for each dashboard (for example for different markets).
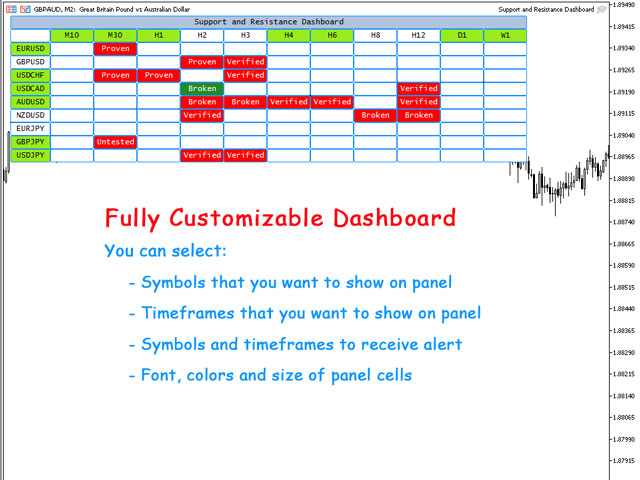
  • There are a full set of parameters for customizing the appearance of the dashboard.
  • You can enable/disable alerts for symbols and timeframes directly from the dashboard.
  • Dashboard works for all markets and for all symbols, you can write the symbol names in the settings (comma separate) or simply set the dashboard to read the symbols from the market watch.

Different Alert Types:

You can enable the following alerts at the same time in the dashboard settings.

  • Show Pop Up Alert: Show alert window when alert triggers.
  • Send Push Notification: Send push notification to mobile phone when alert triggers. (You should set metatrader Notifications options)
  • Send Email: Send email when alert triggers. (You should set metatrader Email options)

Notes:

  • Dashboard updates every 1-minute candle open time, run it on more volatile symbols like EURUSD and BTCUSD to receive new price ticks faster.
  • Dashboard finds support and resistance zones based on shevd supply and demand indicator that you can download for free from this link (Dashboard doesn't need the indicator to run).

If you have any question, please ask in the comments section. I'll do my best to answer your questions.

评论 2
Naveen003
29
Naveen003 2024.03.24 12:37 
 

Great product - Very helpful. The seller responds in time and respectful.

Nicolas Dobrovsky
704
Nicolas Dobrovsky 2023.11.27 19:52 
 

This is an absolutely great dashboard. The creator responds to suggestions. Can now be seen when the price is near the SR zone. The speed of the dashboard is also very good, nothing crashes, almost instantly loaded 10 TFs. I used to watch 2 hours a day of different TFs, now I can see everything on the dashboard. Thanks

推荐产品
Owl Smart Levels MT5
Sergey Ermolov
4.49 (37)
MT4版本  |   FAQ Owl Smart Levels Indicator 是一個完整的交易系統,包含 Bill Williams 的高級分形、構建正確的市場波浪結構的 Valable ZigZag 以及標記準確入場水平的斐波那契水平等流行的市場分析工具 進入市場和地方獲利。 策略的详细说明 指示灯使用说明 顾问-贸易猫头鹰助手助理 私人用户聊天 ->购买后写信给我,我会将您添加到私人聊天中,您可以在那里下载所有奖金 力量在於簡單! Owl Smart Levels 交易系統非常易於使用,因此適合專業人士和剛開始研究市場並為自己選擇交易策略的人。 策略和指標中沒有隱藏的秘密公式和計算方法,所有策略指標都是公開的。 Owl Smart Levels 允許您快速查看進入交易的信號,突出顯示下訂單的水平並向您發送有關已出現信號的通知。 優點很明顯: 清楚地顯示主要和更高時間框架的趨勢方向。 指示儀器信號的出現。 標記開單、止損設置和固定利潤的水平。 沒有多餘的,只有必要的結構! ZigZag 表示全球趨勢的方向,因此也表示貿易方向。 市場反轉點的短線清楚地表明在什麼水平上構建斐波
Awesome Oscillator by Bill Williams with the ability to fine-tune and replace the averaging algorithms of the indicator, which significantly expands the possibilities of using this oscillator in algorithmic trading and brings it closer in its properties to such an indicator as the MACD. To reduce price noise, the final indicator is processed with an additional Smooth averaging. The indicator has the ability to give alerts, send mail messages and push signals when the direction of movement of th
Atomic Analyst MT5
Issam Kassas
5 (11)
首先值得强调的是,该交易指标是非重绘、非延迟的指标,这使其成为手动和机器人交易的理想选择。 Atomic Analyst是一种PA价格行动指标,利用价格的力量和动量来寻找市场上更好的机会。配备了高级过滤器,可帮助去除噪音和假信号,并提高交易潜力。使用多层复杂的指标,Atomic Analyst扫描图表,并将复杂的数学计算转化为任何初学者都能理解并用来做出一致交易决策的简单信号和颜色。 “Atomic Analyst”是专为新手和经验丰富的交易者量身定制的综合交易解决方案。它将高级指标和一流功能融合为一体的交易策略,使其成为所有类型交易者的多功能选择。 日内交易和剥头皮策略:专为快速准确的日内交易和短期交易而设计。 日内和摆动交易策略:可用作追求价格大幅波动的日内和摆动交易者的可靠工具。 多货币和市场:凭借其可靠的精度,在不同的工具和市场上运作。 多个时间框架:可在多个时间框架上使用,性能良好。 稳定性:所有指标均不重绘、不重绘和不滞后,确保可靠的信号。 信号清晰度:提供箭头信号,用于清晰的入场和出场点。 实时警报:通过交易入场、SL和TP警报通知交易者。 多个利润水平:使用
Your Trend Friend
Luigi Nunes Labigalini
The trend is your friend! Look at the color of the indicator and trade on that direction. It does not  repaint. After each candle is closed, that's the color of the trend. You can focus on shorter faster trends or major trends, just test what's most suitable for the symbol and timeframe you trade. Simply change the "Length" parameter and the indicator will automatically adapt. You can also change the color, thickness and style of the lines. Download and give it a try! There are big movements
Noize Absorption Index
Ekaterina Saltykova
Noize Absorption Index - is the manual trading system that measures the difference of pressure between bears forces and bulls forces. Green line - is a noize free index that showing curent situation. Zero value of index shows totally choppy/flat market.Values above zero level shows how powerfull bullish wave is and values below zero measures bearish forces.Up arrow appears on bearish market when it's ready to reverse, dn arrow appears on weak bullish market, as a result of reverse expectation.
Trading Utility for Forex Currency Pairs Only not for Gold  Functions Auto Lot Calculation based on Risk Auto stoploss  Auto TakeProfit Breakeven Auto Close Half % Close in percentage with respect to the PIPs Pending Orders BuyLimit Sell Limit with distances BuyStop Sell Stop    with distances Trading Informations Risk in percentage For Multiple trades Combine Takeprofit and Combine Stoplosses
Orbit Rage Final 2
BILLY ARANDUQUE ABCEDE
Note : i only sell this EA on MQL5, any other sellers is fake. Orbit Rage Final, a cutting-edge trading strategy meticulously designed around the bull/bear candle approach and divergence analysis. This powerful tool is engineered to empower you to shape the life you desire. To embark on this transformative journey, simply download and seamlessly integrate it into your MetaTrader 4 platform by placing it in the experts advisors folder. Orbit Rage Final revolutionizes trading by offering a risk-f
Trend Catcher with Alert MT5
Issam Kassas
4.59 (61)
趋势捕捉器: 具有警示指标的趋势捕捉器策略是一种多功能的技术分析工具,可帮助交易员识别市场趋势和潜在的进出点。它采用动态趋势捕捉器策略,根据市场条件进行调整,清晰地呈现趋势方向。交易员可以自定义参数,以符合其偏好和风险容忍度。该指标有助于识别趋势,发出潜在的反转信号,充当跟踪止损机制,并提供实时警报,以便及时应对市场。 具有警示指标的趋势捕捉器策略是一种多功能的技术分析工具,可帮助交易员识别市场趋势和潜在的进出点。它采用动态趋势捕捉器策略,根据市场条件进行调整,清晰地呈现趋势方向。交易员可以自定义参数,以符合其偏好和风险容忍度。该指标有助于识别趋势,发出潜在的反转信号,充当跟踪止损机制,并提供实时警报,以便及时应对市场。 特点: 趋势识别:信号牛市趋势和熊市趋势。 趋势反转:当蜡烛颜色从牛市变为熊市,反之亦然时,提醒可能的反转。 实时警报:为新趋势识别生成警报。 建议: 货币和货币对:EURUSD,AUDUSD,XAUUSD... 时间框架:H1。 账户类型:任何ECN,低点差账户。
FREE
Rainbow EA MT5
Jamal El Alama
Description : Rainbow EA MT5 is a simple Expert advisor based on   Rainbow MT5 indicator witch is based on Moving average with period 34. The indicator is incorporated in the EA, therefore, it is not required for the EA to operate, but if you wish, you can download it from   my product page . The Expert Advisor settings are as follows : Suitable for Timeframes up to H1 The parameters below can be set according to your trading rules. StopLoss ( Stop Loss in pips) TakeProfit ( Take Profit in pi
An indicator of pattern #31 ("Long Island") from Encyclopedia of Chart Patterns by Thomas N. Bulkowski. The second gap is in the opposite direction. Parameters: Alerts - show alert when an arrow appears   Push - send a push notification when an arrow appears (requires configuration in the terminal) GapSize - minimum gap size in points ArrowType - a symbol from 1 to 17 ArrowVShift - vertical shift of arrows in points   ShowLevels - show levels ColUp - color of an upward line ColDn - color of a
Total trade manager allows you to manage your trade to maximise your profits and minimise your losses. This is an essential for traders that are looking for consistency within their trading.  The features: Partial Stop Loss: This feature allows you to close a partial percentage of your trade once it goes into negative. So if your stop loss is 20 pips, you could close 75% of your trade at 10 pips and let the remainder of the position to continue running. Auto Stop Loss: This means that once you p
Dynamic Trading Panel Discover precision in trading with our innovative trading panel: Equity-Based Lot Sizing : Automatically calculate lot sizes based on a user-set percentage of your account equity. Tailor your trades to your risk comfort zone. Intuitive Risk Management : If no stop loss is set, the position is opened using the set percentage as margin. If a stop loss is chosen, your potential loss is capped at the user-defined percentage, safeguarding your equity. Visual SL/TP Setting : Simp
其中一个数字序列称为“森林火灾序列”。它被公认为最美丽的新序列之一。它的主要特点是该序列避免了线性趋势,即使是最短的趋势。正是这一属性构成了该指标的基础。 在分析金融时间序列时,该指标试图拒绝所有可能的趋势选项。只有当他失败时,他才会认识到趋势的存在并给出适当的信号。这种方法可以让人们正确地确定新趋势开始的时刻。然而,误报也是可能的。为了减少它们的数量,该指标添加了一个额外的过滤器。当新柱打开时会生成信号。在任何情况下都不会发生重绘。 指标参数: Applied Price   - 应用价格常数; Period Main   - 指标的主要周期,其有效值在 5 - 60 之间; Period Additional   - 附加周期,此参数的有效值为 5 - 40; Signal Filter   - 附加信号滤波器,有效值 0 - 99; Alerts   - 启用后,指示器会在出现新信号时提醒您; Send Mail   - 允许指标向电子邮件发送消息; Push   - 允许您发送 Push 消息。
Renko Gold
Ignacio Agustin Mene Franco
Renko Gold! clearly indicates the floors and ceilings where it goes from 4 lines, the line below that marks the floor in green confirming with the thinnest line clarifies the purchase entry, the same is for sale, the top line marks the ceiling and the thinnest red line marks the sale, This indicator works for all temporalities! For Forex and Synthetic Indices markets! It also works for crypto markets! Good profit! World Investor.
Mine Farm
Maryna Kauzova
5 (1)
Mine Farm is one of the most classic and time-tested scalping strategies based on the breakdown of strong price levels. Mine Farm is the author's modification of the system for determining entry and exit points into the market... Mine Farm - is the combination of great potential with reliability and safety. Why Mine Farm?! - each order has a short dynamic Stop Loss - the advisor does not use any risky methods (averaging, martingale, grid, locking, etc.) - the advisor tries to get
PZ Trend Trading MT5
PZ TRADING SLU
3.67 (3)
许多盈利交易者不仅知道如何识别市场趋势,而且也能把握趋势建立后的交易机会。 Pz 趋势交易 指标设计用来在趋势行情中尽可能的赚取利润。 已建立的趋势提供了一揽子交易机会,但大多数趋势交易指标完全忽视了它们,让交易者在趋势行情时完全不知道该如何做!一般趋势指标只通知有关的趋势变化,但根本不足以得到卓越的回报. Pz 趋势交易 指标比一般趋势指标显示多达 20 倍的交易 , 因为它注重所谓的市场时机。它不仅显示当前的市场趋势,也有回调,内柱线的突破和调整。它令您在趋势回调之后介入,安全的柱线内突破金字塔加仓,以及发现潜在的反转,和已知的调整。 趋势改变 一个趋势改变在市场方向变化时发生。趋势变化在图表上用带数字的彩色圆圈显示。蓝色 (1) 信号为上涨开始, 而红色 (1) 信号为下跌开始。趋势变化并非评估当前价格动作的结果, 它意味着交易设置是不定时地。如果您正确使用本指标, 在趋势变化时, 您将将已经入场 (参看下面的调整)。 回调 但凡趋势在运动中,行情上下抖动,盈利者收割利润,且其它参与者入场。趋势回调代表好的买入机会,通常是由主力获利离场导致。如果行情在回调后回归上行, 指
LT Rainbow Trend
Thiago Duarte
5 (1)
Do you, like me, like to trade with the trend? Then this indicator will help you! Rainbow Trend is a trend indicator, which uses several Moving Averages on the chart. It measures different trend strenght zones for different periods: very long term, long term, mid term, short term and very short term. Each zone has its color, and it is possible to have sound alert when the prices leaves a zone and enters another. Its configuration is very simple. If you find any bug or have any suggestions, co
这种用于从无穷远衡量货币强弱的创新指标是长期交易的黄牛和交易者不可或缺的助手。 分析货币强弱的系统早已被世界领先的交易者所熟知并在市场上使用。 没有这种分析,任何套利交易都是不完整的。 我们的指标很容易确定基础货币相对于彼此的强弱。 它显示所有或当前货币对的折线图,允许即时分析和搜索最强的入口点。 该指标直观,允许您快速找到并切换到任何一对,具有可放置在地下室和主图表上的移动面板。 通知货币强度变化的计时器模式使交易者有机会在手机上收到通知。  使用货币功率计无穷大指示器的几种策略: 1. 使用货币强度的线性显示图表搜索交叉点作为新兴趋势的信号 2. 在趋势反转信号出现后,向强势货币方向反弹 3. 使用货币强度发散分析扭转当前趋势 4. 使用其他无限指标向强势货币方向交易  如果您有任何问题或希望收到私人聊天的个人邀请,请写信给我:profitcamp@mail.ru
Andrews Trend Side MT5
Andrew Fedotov
3 (2)
Trend Side - 确定趋势的技术指标。它是一组成熟的交易策略。该指标使用先进的趋势过滤系统,有一个统计面板,计算进入和退出水平,并计算动态追踪止损水平。适用于任何类型的符号,从不重绘其信号和结果。专业趋势交易的综合工具。 趋势侧指标集还包括安德鲁斯趋势扫描仪 - 多货币和多时间框架趋势扫描仪、货币强度分析器、多时间框架趋势分析器,可分析可能的逆转。三个趋势分析仪内置于一个产品中。 购买指标后,请联系我免费获得安德鲁斯趋势扫描仪指标套件。 在我们的完整说明中更详细地描述了指示器和所有附加面板。本手册还详细描述了带有指标的交易策略、所有输入变量以及信号过滤。   [Download Instruction] 指标特点: - 通过过滤更高的时间框架来识别趋势,使用多时间框架扫描器来过滤趋势及其在 4 个时间框架的组合上的活动 - 区分真实趋势和小幅修正,借助货币强度分析了解整个市场正在发生的情况,了解所有货币对的价格走势以选择最佳 - 在一个窗口中使用多货币扫描仪、超过 10 对和所有时间框架分析整个市场 优点 : 适用于所有类型的市场 从不重绘结果 发送有关新信号的通知
该指标自动计算并绘制斐波那契支撑位和阻力位 - 最有效的市场分析工具之一。 计算使用所选期间和时间范围的平均价格数据。此期间的最小值和最大值被视为运动的开始和结束。 斐波那契水平让您可以看到潜在的参考点,围绕这些点价格走势可以放缓或逆转,也就是说,它们用于预测进一步的走势,以及设置止损和限价单。 参数: PartsShow - 从当前柱状图显示的历史级别数 CalcPeriod - 价格平均周期 SmoothingMethod - 价格平均法(26 个选项) TF - 用于计算的时间范围 LevelColor - 水平线的颜色 ZeroLevelColor - 零级颜色 ShowVerticalLine - 启用/禁用水平之间的垂直线的显示 VLineStyle - 垂直线的样式 VLineColor - 垂直线的颜色 ShowInfo - 启用以标签形式显示有关级别百分比值的信息,否则以对象描述的形式显示 InfoFontSize - 信息字体大小 InfoColor - 信息字符串的颜色 FiboLevels - 显示水平的百分比值
该指标将向您显示您已经为图表上的每个订单设置的 TP 和 SL 值(以该货币表示)(接近交易/订单行),这将帮助您估算每个订单的利润和损失。它还会向您显示 PIP 值。显示的格式是“我们的损益/PIP 值的货币值”。 TP 值将以绿色显示,SL 值将以红色显示。 如有任何问题或了解更多信息,请随时通过 fxlife.asia@hotmail.com 或 fxlife.asia@yahoo.com 与卖家联系 (而指标中即将加入的下一个功能是“自动或半自动TP和SL设置”,我们的客户将免费获得更新版本。谢谢...^_^) (或者如果您认为在指示中应该增加一些功能,请随时告诉我们) ========================================================
用於自動訂單和風險管理的實用程序。讓您從利潤中獲得最大收益並限制您的損失。由執業交易員為交易員創建。該實用程序易於使用,適用於交易者手動打開的任何市場訂單或在顧問的幫助下。可以按幻數過濾交易。該實用程序可以同時處理任意數量的訂單。 具有以下功能: 1. 設置止損和止盈水平; 2. 通過追踪止損位平倉; 3. 設定盈虧平衡水平。 該實用程序可以: 1. 分別處理每個訂單(為每個訂單單獨設置級別) 2. 處理一籃子單向訂單(所有訂單的水平設置相同,買入和賣出分開) 3. 處理一籃子多向訂單(所有訂單的級別都設置為通用的,BUY 和 SELL 一起) 選項: STOPLOSS - 如果不使用 =-1,則以點為單位止損; TAKEPROFIT - 以點為單位獲利,不與 -1 一起使用; TRAILING_STOP - 價格變動的點數,如果不使用 =-1; TRAILING_STEP - 每一步利潤將增加的點數; BREAKEVEN_STOP - 將訂單轉移到盈虧平衡點的點數,如果不使用 =-1; BREAKEVEN_ST
Fractal 358 Plus
Renato Fridschtein
Fractal 358 Plus is a predictive indicator that provides the clearest sight of price movements. Identifying graphic patterns such as Caixote (Crate), Pivot and Inside Candle , it shows entries and exits spots, as well as threats to your trades in the markets. It comes ready to use with B3 Mini Index (WIN$ series) and can be adjusted to use with any asset and timeframe. Fractal 358 unravels price movement Based on the Fibonacci sequence, Fractal 358 is a new and different way of reading and un
Laguerre SuperTrend Clouds   adds an Adaptive Laguerre averaging algorithm and alerts to the widely popular SuperTrend indicator. As the name suggests,   Laguerre SuperTrend Clouds (LSC)   is a trending indicator which works best in trendy (not choppy) markets. The SuperTrend is an extremely popular indicator for intraday and daily trading, and can be used on any timeframe. Incorporating Laguerre's equation to this can facilitate more robust trend detection and smoother filters. The LSC uses the
Point Black
Ignacio Agustin Mene Franco
Black Card Pack indicator 5/1 point black It has the strategy of professional bollingers where each arrow gives you a different entry signal. It is used to operate in m1 and in d1 It is used for scalping and intraday, modified for forex markets ! suitable for all pairs modified for synthetic index markets suitable for all pairs! Ideal for volatility and jumps!
Trend Monitor MT5
Pavel Zamoshnikov
3.67 (3)
The indicator generates early signals basing on ADX reading data combined with elements of price patterns. Works on all symbols and timeframes. The indicator does not redraw its signals. You see the same things on history and in real time. For better visual perception signals are displayed as arrows (in order not to overload the chart). Features The best results are obtained when the indicator works on two timeframes. For example: M30 – the indicator shows the main trend; M5 – the indicator ge
Blahtech Market Profile MT5
Blahtech Limited
5 (8)
Was: $249  Now: $99   Market Profile defines a number of day types that can help the trader to determine market behaviour. A key feature is the Value Area, representing the range of price action where 70% of trading took place. Understanding the Value Area can give traders valuable insight into market direction and establish the higher odds trade. It is an excellent addition to any system you may be using. Inspired by Jim Dalton’s book “Mind Over Markets”, this indicator is designed to suit the
The best time to trade Using this Indicator is when the time reach exactly hour,half,45 minutes,15 minutes and sometimes 5 minutes.. This indicators is helpful to those who trade boom and crash indecies.How to read this indicator first you'll see Blue allow and Red allow all these allows used to indicate or to detect the spike which will happen so the allow happens soon before the spike happen.This indicator works properly only in boom and crash trading thing which you have to consider when
首先,值得强调的是,这个交易工具是非重绘、非重画和非滞后的指标,非常适合专业交易。 智能价格行动概念指标是一个非常强大的工具,既适用于新手,也适用于经验丰富的交易者。它将超过20个有用的指标合并到一个指标中,结合了高级交易思想,如内圈交易员分析和智能资金概念交易策略。该指标侧重于智能资金概念,提供有关大型机构交易方式的见解,帮助预测它们的动向。 它在流动性分析方面尤其擅长,有助于理解机构的交易方式。它擅长预测市场趋势,并仔细分析价格波动。通过将您的交易与机构策略对齐,您可以更准确地预测市场走向。该指标多才多艺,擅长分析市场结构,识别重要的订单区块,并识别各种模式。 它擅长识别BOS和CHoCH等模式,理解动量的转变,并突出显示供需强劲的关键区域。它还擅长发现强大的不平衡,并分析价格创造更高高点或更低低点的模式。如果您使用斐波那契回撤工具,该指标可以满足您的需求。它还可以识别相等的高点和低点,分析不同的时间框架,并通过仪表板显示数据。 对于使用更高级策略的交易者,该指标提供了工具,如公平价值差指标和优惠和折扣区域的识别。它特别关注高时间框架订单区块,并在较长时间框架内彻
该产品的买家也购买
Trade Assistant MT5
Evgeniy Kravchenko
4.4 (171)
它有助于计算每笔交易的风险,容易安装新的订单,具有部分关闭功能的订单管理, 7 种类型的追踪止损和其他有用的功能。   注意,该应用程序在策略测试器中不起作用。 您可以在描述页面下载演示版  Manual, Description, Download demo 线条功能  - 在图表上显示开仓线、止损线、止盈线。 有了这个功能,就可以很容易地设置一个新的订单,并在开仓前看到它的附加特性。   风险管理  - 风险计算功能在考虑到设定的风险和止损单的大小的情况下,计算新订单的成交量。它允许你设置任何大小的止损,同时观察设定的风险。 批量计算按钮 - 启用 / 禁用风险计算。 在 " 风险 " 一栏中设置必要的风险值,从 0 到 100 的百分比或存款的货币。 在 " 设置 " 选项卡上选择风险计算的变量: $ 货币, % 余额, % 资产, % 自由保证金, % 自定义, %AB 前一天, %AB 前一周, %AB 前一个月。   R/TP 和 R/SL - 设置止盈和止损的关系。 这允许你设置相对于损失的利润大小。 例如, 1 : 1 - 这决定了 TP = SL 的大小。 2 :
您认为在价格可以瞬间变化的市场中,下单应该尽可能简单吗? 在 Metatrader 中,每次您要开单时,您都必须打开一个窗口,您可以在其中输入开盘价、止损和止盈以及交易规模。 在金融市场交易中,资本管理对于维持您的初始存款并使其倍增至关重要。 因此,当您想下订单时,您可能想知道应该开多大的交易? 在这单笔交易中,您应该承担多少百分比的存款? 您可以从这笔交易中获利多少,利润风险比是多少? 在您设置交易规模之前,您需要进行必要的计算,以获得交易规模应该是多少的问题的答案。 想象一下,您有一个工具可以自动完成所有这些工作。 您打开图表,进行市场分析并用水平线标记入场点、防御点(止损)和目标(止盈),最后您定义风险水平,例如 作为可用资本的百分比,您可以在此交易中承担,此时程序提供: 定义风险和止损规模的可接受交易规模 以点数、点数和账户货币计的止损和获利值 风险回报率 现在剩下的就是点击面板上的相应按钮来打开交易。 如果您是黄牛,需要在不设置防御或目标的情况下快速打开和关闭交易,那么您可以在交易管理器面板中轻松掌握一切,您可以在其中定义固定订单参数并通过单击“购买”或 “卖出”按钮。 关闭
Local Trade Copier EA MT5
Juvenille Emperor Limited
5 (63)
通过 Local Trade Copier EA MT5 获得非常快速的交易复制体验。它的简单1分钟设置,使您可以在同一台Windows计算机或Windows VPS上在多个MetaTrader终端之间复制交易,具有闪电般快速的复制速度,低于0.5秒。 无论您是初学者还是专业交易者, Local Trade Copier EA MT5 都提供了广泛的选项,可根据您的特定需求进行自定义。对于任何希望增加利润潜力的人来说,这都是终极解决方案。 今天就尝试一下,看看为什么它是市场上最快、最简单的贸易复印机! 提示: 您可以在您的模拟账户中下载并试用 Local Trade Copier EA MT5 模拟版: 这里 将下载的免费演示文件粘贴到您的 MT5 >> 文件 >> 打开数据文件夹 >> MQL5 >> 专家文件夹并重新启动您的终端。  免费演示版本每次可在 4 小时内发挥全部功能,仅限演示帐户。 要重置试用期,请转至 MT5 >> 工具 >> 全局变量 >> Control + A >> 删除。 请仅在非关键模拟账户上执行此操作,不要在挑战道具公司账户中执行此操作。 Loc
TradePanel MT5
Alfiya Fazylova
4.86 (113)
交易面板是一个多功能的交易助手。 该应用程序包含 50 多个手动交易功能,并允许您自动执行大多数交易操作。 适用于任何交易工具(外汇、差价合约、期货等)。 可以在一个终端窗口中处理所有符号。 可定制的面板尺寸(高达 4K 分辨率)。 它具有灵活直观的界面,允许您自定义面板,隐藏所有未使用的功能和选项卡。 该应用程序被设计为一组互连的面板: 贸易面板。 旨在执行基本交易操作: 打开挂单和仓位。 关闭挂单和仓位。 立场逆转。 通过开立相反仓位来封锁仓位。 一键执行所有仓位的部分平仓。 只需单击一下,即可将所有头寸的止盈和/或止损设置为同一水平。 一键点击,将所有仓位的止损设置至盈亏平衡水平。 开挂单和建仓时,您可以: 根据既定风险自动计算交易量。 一键打开多个订单。 将计算出的交易量分配给多个订单(如果计算出的交易量大于每个订单允许的最大交易量)。 使用标签打开订单,在图表上直观地显示未来订单的交易水平位置。 建仓时,设置最大点差限制。 使用止盈和止损之间的自动比率。 使用虚拟止损和止盈。 将当前点差添加到止损和止盈。 使用 ATR 指标计算止盈和止损。 为挂单设置“挂单到期日期”。 当关
Trade Manager DaneTrades
DaneTrades Ltd
4.73 (22)
交易管理器可帮助您快速进入和退出交易,同时自动计算风险。 包括帮助您防止过度交易、报复性交易和情绪化交易的功能。 交易可以自动管理,账户绩效指标可以在图表中可视化。 这些功能使该面板成为所有手动交易者的理想选择,并有助于增强 MetaTrader 5 平台。多语言支持。 MT4版本  |  用户指南+演示 交易经理在策略测试器中不起作用。 如需演示,请参阅用户指南 风险管理 根据%或$自动调整风险 可选择使用固定手数或根据交易量和点自动计算手数 使用 RR、点数或价格设置盈亏平衡止损 追踪止损设置 最大每日损失百分比,在达到目标时自动平仓所有交易。 保护账户免遭过多提款并阻止您过度交易 最大每日损失(以美元为单位)在达到目标时自动关闭所有交易。 保护账户免遭过多提款并阻止您过度交易 一键实现所有交易的盈亏平衡 自动计算从手机/电话发送的交易的风险 OCO 在设置中可用 交易和头寸管理 通过设置每月、每周、每天、每小时或每分钟的最大交易次数,停止过度交易和报复性交易。 高级挂单管理。 调整何时关闭挂单的规则 追踪挂单 支持市价订单和挂单 每日最大利润目标(以美元为单位)以确保头寸并停
The product will copy all telegram signal to MT5 ( which you are member) , also it can work as remote copier.  Easy to set up, copy order instant, can work with almost signal formats, image signal,  s upport to translate other language to English Work with all type of channel or group, even channel have "Restrict Saving Content", work with  multi channel, multi MT5 Work as remote copier: with signal have ticket number, it will copy exactly via ticket number. Support to backtest signal. How to s
MT5 to Telegram Signal Provider 是一个易于使用且完全可自定义的工具,它允许向 Telegram 的聊天室、频道或群组发送 指定 的信号,将您的账户变为一个 信号提供商 。 与大多数竞争产品不同,它不使用 DLL 导入。 [ 演示 ] [ 手册 ] [ MT4 版本 ] [ Discord 版本 ] [ Telegram 频道 ] 设置 提供了逐步的 用户指南 。 不需要了解 Telegram API;开发者提供了您所需的一切。 关键特性 能够自定义发送给订阅者的订单详情 您可以创建分层的订阅模型,例如铜、银、金。其中金订阅获得所有信号等。 通过 id、符号或评论过滤订单 包括执行订单的图表截图 在发送的截图上绘制已关闭的订单,以便额外核实 延迟发送新订单消息的可能性,以便在发送前对位置进行调整 订单详情完全透明: 新的市场订单*带截图 订单修改(止损、获利) 已关闭的订单*带截图 部分关闭的订单** 新的挂单 修改的挂单(进场价格) 挂单激活(作为新的市场订单附加) 已删除的挂单 历史订单报告*** 可自定义的评论 注意: *
Trade copier MT5
Alfiya Fazylova
4.35 (26)
Trade Copier 是一种专业实用程序,旨在复制和同步交易账户之间的交易。 复制发生从供应商的帐户/终端到收件人的帐户/终端,安装在同一台计算机或 vps 上。 在购买之前,您可以在演示帐户上测试演示版本。 演示 这里 。 完整说明 这里 。 主要功能和优点: 支持复制MT5>MT5、MT4>MT5、MT5>MT4,包括МТ5 netting账户。 供应商和收件人模式在同一产品中实现。 简单直观的界面,允许您直接从图表中实时控制复制。 连接中断或终端重新启动时不会丢失设置和位置。 允许您选择要复制的符号,也可以替换接收者的符号,例如 EURUSD> USDJPY。 支持回拷贝。 能够仅复制某些订单。 允许您设置开仓交易价格的最大差异和最大时间延迟。 正确复制部分订单关闭的执行。 计算复制手数的几种方法。 同步止盈和止损。有几种方法可以计算它们的位置。 支持通过执行在“Market account”上工作,其中 SL / TP 仅在开仓后设置。 如何使用简单的设置复制交易 将供应商终端和接收终端安装在同一台计算机或 VPS 上。 在供应商终端上以“Master”模式安装复印机,然后
Bots Builder Pro MT5
Andrey Barinov
4.75 (4)
This is exactly what the name says. Visual strategy builder . One of a kind. Turn your trading strategies and ideas into Expert Advisors without writing single line of code. Generate mql source code files with a few clicks and get your fully functional Expert Advisors, which are ready for live execution, strategy tester and cloud optimization. There are very few options for those who have no programming skills and can not create their trading solutions in the MQL language. Now, with Bots Build
-25% discount ($199 -> $149) Advanced trading tool: One click smart orders that execute under your conditions Developed by trader for trading community:  position size calculator (lot size), open position after price action, strategy builder, set and forget trading, mobile notifications... Risk Management -  Risk percentage position size calculator, gain percentage, target risk reward ratio, spread and commissions are included in calculations 7 Advanced order types  - Set and forget trading w
Mentfx Mmanage mt5
Anton Jere Calmes
4.43 (7)
The added video will showcase all functionality, effectiveness, and uses of the trade manager. Drag and Drop Trade Manager. Draw your entry and have the tool calculate the rest. Advanced targeting and close portions of a trade directly available in tool (manage trades while you sleep). Market order or limit order on either side with factored spread. Just draw the entry, the tool does the rest. Hotkey setup to make it simple. Draw where you want to enter, and the stop loss, the tool calculates al
The top-selling EAs on the market cost a lot and one day they are suddenly gone. This is because one strategy will not work in the forex market all the time. Our product is unique from all others in the MQL Marketplace because our EA comes with 34+ built-in indicators that allow develop strategies every time.  You build your strategy and keep updating it. If one strategy does not work, simply build another all using only one EA. This is All-In-One EA   in this market place. You can use as trade
将信号从您所属的任何渠道(包括私人和受限渠道)直接复制到您的 MT5。 该工具在设计时充分考虑了用户的需求,同时提供了管理和监控交易所需的许多功能。 该产品采用易于使用且具有视觉吸引力的图形界面。 自定义您的设置并在几分钟内开始使用该产品! 用户指南 + 演示  |   MT4版本  |   不和谐版本 如果您想尝试演示,请参阅用户指南。 Telegram To MT5 接收器在策略测试器中不起作用! Telegram 至 MT5 功能 一次复制多个通道的信号 从私人和受限频道复制信号 不需要机器人令牌或聊天 ID(如果出于某种原因需要,您仍然可以使用这些) 使用风险百分比或固定手数进行交易 排除特定符号 选择复制所有信号或自定义要复制的信号 配置单词和短语以识别所有信号(默认值应适用于 99% 的信号提供商) 配置时间和日期设置以仅在需要时复制信号 设置一次打开的最大交易量 交易和头寸管理 使用信号或自动设置的管理 通过设置每月、每周、每天、每小时或每分钟的最大交易次数,停止过度交易和报复性交易。 支持市价订单和挂单 每日最大利润目标(以美元为单位)以确保头寸并停止过度交易
OrderManager MT5
Lukas Roth
4.88 (16)
介绍 OrderManager :MT5的革命性工具 使用全新的Order Manager实用程序,像专业人士一样管理您在MetaTrader 5上的交易。Order Manager设计简单,易于使用,可让您轻松定义和可视化每笔交易的风险,从而做出明智的决策并优化您的交易策略。有关OrderManager的更多信息,请参阅手册。 [ 手册 ] [ MT4版本 ] [ Telegram 频道 ] 主要功能: 风险管理:快速轻松地定义您交易的风险,让您做出更好的决策并提高交易性能。 视觉表示:图形化地查看您的交易和相关风险,以清晰简洁地了解您的开放头寸。 订单修改:只需几次点击即可轻松修改或关闭您的订单,简化您的交易过程,为您节省宝贵的时间。 掌握新闻:一键获取最新市场新闻。 不要错过这个MT5交易员的必备工具。用Order Manager提升您的交易体验,将您的交易游戏提升到新的水平。 OrderManager在startegyTester中 不 工作! OrderManager 仅与 Windows 兼容。 请考虑给这个产品一个5星级评价。您的优秀反馈将激励作者加快更新
UTM Manager 是一款直观且易于使用的工具,可提供快速高效的交易执行。其中一项突出的功能是“忽略价差”模式,该模式使您能够以蜡烛的价格进行交易,完全忽略价差(例如,允许在 LTF 上交易更高价差的货币对,避免因价差而退出交易)。 UTM Manager 的另一个关键方面是其独特的本地交易复印机,允许在每个经纪商中灵活地运行不同的交易策略和设置,例如不同的 TP、BE 和风险规则。 交易执行: 快速高效的交易执行:通过点击图表上的入场价格和止损价格或使用一键固定止损尺寸功能轻松进入交易。 自动手数计算:根据预定义的风险设置计算手数,当通过拖动修改仓位时会重新计算手数。 能够同时处理一个或多个职位。 止盈和盈亏平衡: 灵活的止盈设置:通过特定的风险回报 (RR) 比率设置灵活的部分止盈水平。 可配置的自动盈亏平衡功能:当达到一定的利润水平时,将止损移至盈亏平衡点。 用户友好的界面: 用户友好的图形界面 (GUI),可轻松保存和加载设置。 内置帮助工具提示来解释其他功能。 职位定制: 仓位定制和调整:经理将所有仓位绘制在图表上,通过拖动线条即可轻松定制和调整。 图表上的按钮: 图
Trade Assistant 38 in 1
Makarii Gubaydullin
4.87 (15)
多功能工具:超过65个功能,其中包括:手数计算,价格行为,盈亏比,交易管理,供需区域。 演示版   |   用户手册   |  MT5版 任何问题 / 改进意见 / 如果发生了故障或错误    都可以联系我 该实用程序在策略测试器中不起作用:您可以在此处下载 演示版来测 试产品。 Trading functions require permitted auto trading (including on the broker's side) 简化,加快并且自动化你的交易过程。利用这款工具的控制功能就能增强普通交易端的执行力。 建立一笔新的交易:手数 / 风险 / 盈亏计算 1. 手数计算工具 (基于风险规模的交易量计算) 2. 风险计算工具 (基于手数大小的风险额计算) 3. 盈亏比 4. 订单的激活和触发,买入或卖出限价/买入或卖出止损 5. 虚拟的止损/止盈 (隐藏的止损,止盈:交易商不可见) 6.  智能的止损/入场点:当价格柱在收盘时已超越了才入场 (避免无效触发) 7. 隐藏掉挂单 (虚拟的订单) 8. 预订挂单:在市场关闭的时候你也可以下挂单 (适合周末
Adam FTMO MT5
Vyacheslav Izvarin
5 (1)
ADAM EA Special Version for FTMO Please use ShowInfo= false for backtesting ! Our 1st EA created using ChatGPT technology Trade only GOOD and checked PROP FIRMS  Default parameters for Challenge $100,000 Tested on EURUSD and GBPUSD only  Use 15MIN Time Frame Close all deals and Auto-trading  before Weekend at 12:00 GMT+3  Friday For Prop Firms MUST use special Protector  https://www.mql5.com/en/market/product/94362 Signal using ADAM  https://www.mql5.com/en/signals/2190554 --------------------
交易面板一键交易。 处理仓位和订单! 通过 图表 或 键盘 进行交易 。 使用我们的交易面板,您只需单击一下即可直接从图表中执行交易,执行交易操作的速度比使用标准 MetaTrader 控件快 30 倍。 参数和函数的自动计算使交易者的交易更加快捷、方便。 图形提示、信息标签和有关贸易交易的完整信息均位于图表 MetaTrader 上。 MT4版本 详细描述   +DEMO +PDF 如何购买 如何安装     如何获取日志文件     如何测试和优化     Expforex 的所有产品 打开和关闭、反转和锁定、部分关闭/Autolot。虚拟/真实止损/止盈/追踪止损/盈亏平衡,订单网格... МetaТrader 5 中主要订单的交易控制面板 :买入、卖出、buystop、buylimit、sellstop、selllimit、平仓、删除、修改、追踪止损、止损、获利。 有 5 个选项卡 可用:头寸、挂单、账户信息、信号和总利润。 Description on English VirtualTradePad在“  MQL5语言最佳图形面板  ”竞赛中 获得二等奖 。 注意
DrawDown Limiter
Haidar, Lionel Haj Ali
5 (17)
Drawdown Limiter EA You are in the right place if you were searching for Drawdown control, Drawdown limiter, Balance protection, Equity Protection or Daily Drawdown Limit related to Prop Firm, FTMO, or Funded account trading, or if you want to protect your trading account. Have you suffered from controlling your drawdown when trading funded accounts? This EA is meant for you. Prop firms usually set a rule called “Trader Daily Drawdown”, and if it is not respected, you are disqualified.  I am an
将信号从任何您是会员的渠道(无需机器人令牌或管理员权限)直接复制到您的 MT5。 它的设计以用户为中心,同时提供您需要的许多功能 该产品采用易于使用且具有视觉吸引力的图形界面。 自定义您的设置并在几分钟内开始使用该产品! 用户指南 + 演示  | MT4版本 | 电报版本 如果您想尝试演示,请参阅用户指南。 Discord To MT5 在策略测试器中不起作用。 Discord MT5 功能 从您是会员的任何频道复制。 无需机器人令牌或聊天 ID 使用风险百分比或固定手数进行交易 排除特定符号 选择复制所有信号或自定义要复制的信号 配置单词和短语以识别所有信号(默认值应适用于 99% 的信号提供商) 配置时间和日期设置以仅在需要时复制信号 设置一次打开的最大交易量 交易和头寸管理 使用信号或自动设置的管理 通过设置每月、每周、每天、每小时或每分钟的最大交易次数,停止过度交易和报复性交易。 支持市价订单和挂单 每日最大利润目标(以美元为单位)以确保头寸并停止过度交易 确保仓位的每日最大利润目标(%) 最大开放交易以限制风险和敞口。 使用 RR、点数或价格自动获取部分内容 使用固
-25% discount ($149 -> $111) Everything for chart Technical Analysis indicator mt5 in one tool Draw your supply demand zone with rectangle and support resistance with trendline and get alerts to mobile phone or email alert -  Risk reward indicator mt5 Video tutorials, manuals, DEMO download   here .   Find contacts on my   profile . 1.   Extended rectangles and trendlines Object will be extended to the right edge of the chart when price will draw new candles on chart. This is rectangle extend
Trade Dashboard MT5
Fatemeh Ameri
5 (25)
Tired of complex order placement and manual calculations? Trade Dashboard is your solution. With its user-friendly interface, placing orders becomes effortless, by a single click, you can open trades, set stop loss and take profit levels, manage trade lot size, and calculate risk to reward ratios, allowing you to only focus on your strategy. Say goodbye to manual calculations and streamline your trading experience with Trade Dashboard. Download   demo version   right now. You can find   deta
MT4 to Discord Signal Provider 是一款用户友好、完全可定制的工具,专为直接向 Discord 发送交易信号而设计。这个工具将您的交易账户转变为一个高效的信号提供者。 自定义消息格式以适应您的风格!为了方便使用,您可以从预先设计的模板中选择,并决定包括或排除哪些消息元素。 [ 演示 ] [ 手册 ] [ MT4 版本 ] [ Telegram 版本 ] 设置 遵循我们详细的 用户指南 进行简单设置。 不需要预先了解 Discord API;我们提供所有必要工具。 主要特性 为订阅者更新自定义订单详情。 实施分层订阅模型,如铜牌、银牌、金牌,每一层都提供不同级别的信号访问。 附加执行订单的图表截图。 在这些截图上显示已关闭的订单,以增加清晰度。 提供延迟发送新订单消息的选项,以便在发送前进行最后调整。 透明和详细的订单信息: 带截图的新市场订单。 订单修改(止损、获利)。 已关闭和部分关闭的订单。 新的和修改的挂起订单。 挂起订单的激活和删除。 关于历史订单的详细报告。 每个订单的可定制评论。 注意: * 截图包括图表上的任何对象,如指标。 ** 在报
Grid Manual MT5
Alfiya Fazylova
4.83 (12)
Grid Manual是一个交易面板,用于处理订单网格。 该实用程序是通用的,具有灵活的设置和直观的界面。 它不仅可以在亏损方向上设置订单网格,还可以在盈利方向上设置订单网格。 交易者不需要创建和维护订单网格,实用程序会这样做。 打开一个订单就足够了,Grid manual会自动为它创建一个订单网格,并伴随它直到非常关闭。 该实用程序的主要特性和功能: 伴隨以任何方式打開的訂單,包括從移動終端打開的訂單。 適用於兩種類型的網格:“限制”和“停止”。 使用兩種方法計算網格間距:固定和動態(基於 ATR 指標)。 允許您更改未結訂單網格的設置。 顯示圖表上每個網格的盈虧平衡水平。 顯示每個網格的利潤率。 允許您一鍵關閉網格中的盈利訂單。 讓您一鍵關閉每個訂單網格。 允許您對訂單網格應用追踪止損功能。 允許您在訂單網格上應用將訂單網格的止損轉移到盈虧平衡水平的功能。 相對於訂單網格的盈虧平衡水平自動重新排列止盈(僅在限價網格模式下,距離取決於所選的計算類型:“保守”或“激進”)。 最多可管理 20 個訂單網格,每個網格最多可包含 100 個訂單。 計算初始手數時,要考慮入金的大小,不要讓大手
Equity Shield mt5
Vladimir Stepanov
4 (7)
EA 将通过持续监控净值并按照参数输入的规则来保护您的账户免受意外损失。 当违反规则时,EA 将关闭所有交易。 您可以将 EA 设置为以特定百分比或货币亏损关闭所有交易,或以特定百分比或货币利润关闭。 我的信号和其他产品可以在这里找到 购买后请联系我以获得支持和礼物。 参数: For 1 pair only: 将 Equity Guard For all pairs at account :Equity Shield 放在任何货币对上) TP at money(0:关闭):TP in money SL at money(0:关闭):SL in money TP at % at account Equity: TP 将在 X% 的账户利润中关闭交易 SL   at % account equity :SL 如何开始: EA 自定义您的设置 不理会EA,永远不要关闭该图表 Equity Shield Equity shield 在 交易 公司 时 效果 很 好 , 因为 您 将 您 的 提款 保持 在 较 水平。 例如 , 每 日 最 跌幅 为 为 为 为 为 请 确保 将 sl 设置
T Manager Plus, the ultimate trade management solution designed by traders for traders. If you are searching for a simple and efficient trade panel, trade manager, or trade assistant, you are at the right place. T Manager Plus includes advanced charting utilities with a single goal to help traders analyze, plan, execute, and manage their trades on a single platform. The market contains a diverse number of those tools, but   this one is designed by traders for traders . I designed this tool, an
Active Lines
Yury Kulikov
5 (4)
Attention: Demo version for review and testing can be downloaded here . It does not allow trading and can only be run on one chart. Active Lines - a powerful professional tool for operations with lines on charts. Active Lines provides a wide range of actions for events when the price crosses lines. For example: notify, open/modify/close a position, place/remove pending orders. With Active Lines you can assign several tasks to one line, for each of which you can set individual trigger conditions
YuClusters
Yury Kulikov
4.93 (43)
Attention: You can view the program operation in the free version  YuClusters DEMO .  YuClusters is a professional market analysis system. The trader has unique opportunities to analyze the flow of orders, trade volumes, price movements using various charts, profiles, indicators, and graphical objects. YuClusters operates on data based on Time&Sales or ticks information, depending on what is available in the quotes of a financial instrument. YuClusters allows you to build graphs by combining da
控制您的外匯投資組合。立即查看您的站立位置、工作原理以及導致您疼痛的原因! 此處提供 MT4 版本: https://www.mql5.com/en/market/product/58375 交易經理儀表板旨在讓您一目了然地顯示您當前在外匯市場中的每個頭寸,並使風險管理和貨幣敞口更易於理解。 對於通過多個頭寸或交易網格和籃子策略逐漸進入市場的交易者,這是需要查看的關鍵信息。監控終端中的多個位置通常很難管理。 過度槓桿化和使用低風險:回報是新交易者和一些經驗豐富的交易者面臨的主要問題,交易經理向您展示您對每種貨幣的風險敞口,確保您不會同時進行雙向交易。 特徵: 未平倉交易 - 查看您當前按貨幣對排序的所有未平倉交易。您不僅可以在該貨幣對上看到您的方向偏差,還可以在該貨幣對上運行的每筆交易或頭寸上看到您的方向偏差。 回撤和利潤信息 - 立即查看您交易活躍的貨幣對的回撤或盈利情況。輕鬆識別需要管理的交易。 手數大小 - 查看您在每個貨幣對上的手數以及您進行的交易數量。 風險敞口 - 查看您對每種貨幣的方向偏差,以確保您不會在另一個入場時以相反的方向交易。另請查看您在該貨幣中使用
Averager FULL
Vladislav Andruschenko
4.9 (10)
Exp-Averager 旨在通过开立平均交易对已收到一定回撤的交易进行平均。 顾问可以顺势和逆势建仓! 包括一系列头寸的平均追踪止损! 他们正在增加和减少批次。 一种流行的策略,用于将无利可图的头寸调整至平均价格。 MT4版本 详细描述 +DEMO +PDF 如何购买 如何安装     如何获取日志文件     如何测试和优化     Expforex 的所有产品 链接 MetaTrader 5 终端中 Expert Advisor 中平均器的操作示例:   Exp - TickSniper   。 具有平均功能的通用交易顾问 The X 笔记 这不是一个自动交易系统。 它会监控您的交易并在出现亏损时对其进行平均,直到您获得利润。 您可以在策略测试器中测试 Expert Advisor,并在可视化模式下使用我们的 EAPADPRO 工具栏进行交易! 它是如何工作的? EA 交易将在指定点数( 距离 )后以相同方向开仓。 持仓交易量的计算方式为前一笔交易的交易量 *   LotsMartin   。 此外,EA 还会修改所有交易的共同止盈,将其设置为“同一方向所有仓位的
作者的更多信息
RSI divergence indicator finds divergences between price chart and   RSI   indicator and informs you with alerts (popup, mobile notification or email). Its main use is to find trend reversals in the chart. Always use the divergence indicators with other technical assets like support resistance zones, candlestick patterns and price action to have a higher possibility to find trend reversals. Three confirmation type for   RSI   divergences: RSI   line cross 50 level Price returns to previous H/L C
FREE
50% off. Original price: $375  (Ends in May 15th) Reward Multiplier is a semi-automatic trade manager based on pyramid trading that opens additional orders with the running profit of your trades to maximize return exponentially without increasing the risk. Unlike other similar EAs, this tool shows potential profit/loss and reward to risk ratio before even entering the first trade! Download Demo here  (starting lot is fixed at 0.01) Guide + tips here MT5 version   here You only open the firs
50% off. Original price: $60 Triangle Finder is a multi symbol multi timeframe dashboard that finds symmetrical triangle pattern in 28 symbols and 9 timeframes with a deep scan feature to scan all market watch symbols (up to 1000 instruments!). Download Demo here  (Scans only M1, M5 and M10) Settings description   here MT4 version   here Triangle Finder features: Realtime monitoring of 28 customizable instruments and 9 timeframes at the same time. Deep scan mode to scan all market watch sym
50% off. Original price: $375 (Ends in May 15th) Reward Multiplier is a semi-automatic trade manager based on pyramid trading that opens additional orders with the running profit of your trades to maximize return exponentially without increasing the risk. Unlike other similar EAs, this tool shows potential profit/loss and reward to risk ratio before even entering the first trade! Download Demo here  (starting lot is fixed at 0.01) Guide + tips here MT4 version   here You only open the first ord
40% off. Original price $50 (Ends in May 15th) ATR Scanner Pro is a multi symbol multi timeframe volatility scanner that monitors and analyzes Average True Range indicator value in up to 28 symbols and 9 timeframes in 3 modes : ATR value:  As a volatility dashboard it shows the ATR indicator value in all pairs and timeframes and signals when the ATR value reaches a maximum or minimum in a given duration. Short term ATR/Long term ATR ratio:  It shows ratio of 2 ATRs with different periods. It's
40% off. Original price: $50 (Ends in May 15th) Advanced Bollinger Bands Scanner is a multi symbol multi timeframe Bollinger bands dashboard that monitors and analyzes the Bollinger Bands indicator from one chart. This panel monitors the Bollinger bands indicator in up to 28 configurable instruments and 9 timeframes for price overbought/oversold, price consolidation (Bollinger bands squeeze), and consolidation breakout (squeeze break)  with a deep scan feature to scan all market watch symbols (
25% off. Original price: $40 (Ends in May 15th) Order Manager is a trade assistant with money manager that helps traders open, modify and close manual trades in a simple way to help them focus more on their market analysis and open orders with just a few clicks. Download Demo here  (It only works on demo accounts) Full guide   here MT5 version here Order Manager features: Works on all instruments such as currency pairs, CFD, metals, cryptocurrencies, etc. Proper money management with a buil
MACD divergence indicator finds divergences between price chart and MACD indicator and informs you with alerts (popup, mobile notification or email) . Its main use is to find trend reversals in the chart. Always use the divergence indicators with other technical assets like support resistance zones, candlestick patterns and price action to have a higher possibility to find trend reversals. Three confirmation type for MACD divergences: MACD line cross zero level Price returns to previous H/L Crea
FREE
RSI divergence indicator finds divergences between price chart and RSI   indicator and informs you with alerts (popup, mobile notification or email). Its main use is to find trend reversals in the chart. Always use the divergence indicators with other technical assets like support resistance zones, candlestick patterns and price action to have a higher possibility to find trend reversals. Three confirmation type for RSI   divergences: RSI   line cross 50 level Price returns to previous H/L Creat
FREE
50% off. Original price: $60 RSI Divergence Scanner is a multi-timeframe and multi-symbol dashboard and alert that checks all timeframes and symbols to find divergences between price chart and RSI indicator. This divergence scanner is integrated with support and resistance zones so you can check the RSI divergences in the most important areas of the chart to find trend reversals in the price chart. Download demo version   (works on M 1,M5,M30,W1 timeframes) Full description of scanner paramet
Ichimoku Trend Alert is the Ichimoku Kinko Hyo indicator with Alerts and signal filters. Ichimoku Trend Alert features: Optional check of Ichimoku cloud, Tenkan sen(Conversion Line), Kijun sen(Base Line), Senkou span A, Senkou span B, and Chikou span relative to price, and more. Popup, email, and phone notification alerts for selected symbols and timeframes. There are 9 classic Ichimoku trend filters you can enable/disable in settings: Price/Cloud Order:   Checks the price position relative
FREE
50% off. Original price: $60 MACD Divergence Scanner is a multi-timeframe and multi-symbol dashboard and alert that checks all timeframes and symbols to find regular and hidden divergences between price chart and MACD indicator. This divergence scanner is integrated   with support and resistance zones so you can check the MACD divergences in the most important areas of the chart to find trend reversals in the price chart. Download demo version   (works on M4,M5,M6,M12,H3,H8 timeframes) Full d
Moving Average Trend Alert is a triple MA indicator that helps traders to identify potential market trends based on 3 MAs alignment and crossover. Moving Average Trend Alert features: Customizable short-term, medium-term, and long-term MAs. Option to filter signals based on a minimum distance between moving averages to avoid premature MAs alignment. Optional Filter of signals with RSI indicator overbought/oversold levels. Optional Filter of signals with ADX indicator. Popup, email, and phone n
FREE
50% off. Original price: $60 Ichimoku Assistant is a multi-timeframe panel and alert system that scans all timeframes for multiple rules related to different ichimoku strategies. The Ichimoku indicator has 5 different lines, including Tenkan-sen, Kijun-sen, Senku Span A, Senku Span B and Chikou Span. This scanner checks the status of these lines compared to each other and gives alert based on your selected rules. If you are using ichimoku kinko hyo in your trading strategy, this scanner and its
25% off. Original price: $40 (Ends in May 15th) Order Manager is a trade assistant with money manager that helps traders open, modify and close manual trades in a simple way to help them focus more on their market analysis and open orders with just a few clicks. Download Demo here  (It only works on demo accounts) Full guide   here MT4 version here Order Manager features: Works on all instruments such as currency pairs, CFD, metals, cryptocurrencies, etc. Proper money management with a buil
50% off. Original price: $60 RSI Divergence Scanner is a multi-timeframe and multi-symbol dashboard and alert that checks all timeframes and symbols to find regular and hidden divergences between price chart and RSI indicator. This divergence scanner is integrated with support and resistance zones so you can check the RSI divergences in the most important areas of the chart to find trend reversals in price chart. Download demo version   (works on M4,M5,M6,M12,H3,H8 timeframes) Full description
40% off. Original price: $50 Support and Resistance Dashboard for MT4 is a multi-timeframe and multi-symbol scanner and alert system that finds S/R zones and pivot points for all timeframes and symbols and alerts when price has interaction with them. If you are using support and resistance (or supply and demand) zones in your trading strategy, this dashboard and its alert and filtering system is a big time saver for you. Download demo version   (works on M 1,M5,M30,W1   timeframes) Full descrip
50% off. Original price: $60 Candlestick Pattern Scanner is a multi-timeframe and multi-symbol dashboard and alert system that checks all timeframes and currency pairs for different candlestick patterns that are formed in them. Scanner is integrated with support and resistance zones so you can check the candlestick patterns in the most important areas of the chart to find breakout and reversal patterns in the price chart. Download demo version   (works on M1,M5,M30,W1 timeframes) Read the full
40% off. Original price: $50 Moving Average Trend Scanner is a multi symbol multi timeframe triple MA crossover dashboard that helps traders to monitor, and identify potential market trends from one chart. This panel scans 3 moving averages in up to 28 configurable instruments and 9 timeframes for triple moving average alignment and moving average crossover  with a deep scan feature to scan all market watch symbols (up to 1000 instruments!). Download Demo here  (Scans only M1 and M5) Settings
MACD divergence indicator finds divergences between price chart and MACD indicator and informs you with alerts (popup, mobile notification or email). Its main use is to find trend reversals in the chart. Always use the divergence indicators with other technical assets like support resistance zones, candlestick patterns and price action to have a higher possibility to find trend reversals. Three confirmation type for MACD divergences: MACD line cross zero level Price returns to previous H/L Creat
FREE
40% off. Original price: $50  (Ends in May 15th) Ichimoku Trend Finder is a multi symbol multi timeframe trend dashboard that helps traders to monitor and identify potential market trends from one chart. This panel scans the Ichimoku Kinko Hyo indicator in 28 configurable instruments and 9 timeframes for classic Ichimoku trend signals  with a deep scan feature to scan all market watch symbols (up to 1000 instruments!).    Download Demo here  (Scans only M1 and M5) Settings description   here
Ichimoku Trend Alert is the Ichimoku Kinko Hyo indicator with Alerts and signal filters. Ichimoku Trend Alert features: Optional check of Ichimoku cloud, Tenkan sen(Conversion Line), Kijun sen(Base Line), Senkou span A, Senkou span B, and Chikou span relative to price, and more. Popup, email, and phone notification alerts for selected symbols and timeframes. There are 9 classic Ichimoku trend filters you can enable/disable in settings: Price/Cloud Order: Checks the price position relative to
FREE
50% off. Original price: $60 Candlestick Pattern Scanner is a multi-timeframe and multi-symbol dashboard and alert system that checks all timeframes and currency pairs for different candlestick patterns that are formed in them. Scanner is integrated   with support and resistance zones so you can check the candlestick patterns in most important areas of the chart to find breakout and reversal patterns in the price chart. Download demo version   (works on M4,M5,M6,M12,H3,H8 timeframes) Read the f
Moving Average Trend Alert is a triple MA indicator that helps traders to identify potential market trends based on 3 MAs alignment and crossover. Moving Average Trend Alert features: Customizable short-term, medium-term, and long-term MAs. Option to filter signals based on a minimum distance between moving averages to avoid premature MAs alignment. Optional Filter of signals with RSI indicator overbought/oversold levels. Optional Filter of signals with ADX indicator. Popup, email, and phone n
FREE
50% off. Original price: $60 MACD Divergence Scanner is a multi-timeframe and multi-symbol dashboard and alert that checks all timeframes and symbols to find regular and hidden divergences between price chart and MACD indicator. This divergence scanner is integrated with support and resistance zones so you can check the MACD divergences in the most important areas of the chart to find trend reversals in the price chart. Download demo version   (works on M 1,M5,M30,W1   timeframes) Full descript
40% off. Original price: $50 Moving Average Trend Scanner is a multi symbol multi timeframe triple MA crossover dashboard that helps traders to monitor, and identify potential market trends from one chart. This panel scans 3 moving averages in up to 28 configurable instruments and 9 timeframes for triple moving average alignment and moving average crossover with a deep scan feature to scan all market watch symbols (up to 1000 instruments!).   Download Demo   here   (Scans only M1 and M6) Sett
Reward Multiplier is a semi-automatic trade manager based on pyramid trading that opens additional orders with the running profit of your trades to maximize return exponentially without increasing the risk.Unlike other similar EAs, this tool shows potential profit/loss and reward to risk ratio before even entering the first trade! Download full version here  ( In the mini version. Starting lot is fixed at 0.01 (or minimum allowed lot size ) Guide + tips here MT4 version   here You only open the
FREE
50% off. Original price: $60 Support and Resistance zones indicator for MT5 is a multi-timeframe panel and alert that finds support and resistance zones and pivot points for all timeframes of MetaTrader 5 and gives alert when price has interaction with them. Download demo version (works on GBPUSD, EURJPY and NZDUSD symbols) Read the full description of scanner parameters in the blog page . Many unique features in one indicator: Integrating support and resistance zones and pivot points in one in
Triangle Finder MT4
Amir Atif
4.5 (4)
50% off. Original price: $60 Triangle Finder is a multi symbol multi timeframe dashboard that monitors and finds symmetrical triangle pattern in 28 symbols and 9 timeframes with a deep scan feature to scan all market watch symbols (up to 1000 instruments!). Download Demo here  (Scans only M1 and M5) Settings description   here MT5 version   here Triangle Finder features: Realtime monitoring of 28 customizable instruments and 9 timeframes at the same time. Deep scan mode to scan all market w
40% off. Original price: $50  (Ends in May 15th) Ichimoku Trend Finder is a multi symbol multi timeframe trend dashboard that helps traders to monitor and identify potential market trends from one chart. This panel scans the Ichimoku Kinko Hyo indicator in 28 configurable instruments and 9 timeframes for classic Ichimoku trend signals with a deep scan feature to scan all market watch symbols (up to 1000 instruments!).     Download Demo here  (Scans only M1 and M6) Settings description   here
筛选:
Naveen003
29
Naveen003 2024.03.24 12:37 
 

Great product - Very helpful. The seller responds in time and respectful.

Nicolas Dobrovsky
704
Nicolas Dobrovsky 2023.11.27 19:52 
 

This is an absolutely great dashboard. The creator responds to suggestions. Can now be seen when the price is near the SR zone. The speed of the dashboard is also very good, nothing crashes, almost instantly loaded 10 TFs. I used to watch 2 hours a day of different TFs, now I can see everything on the dashboard. Thanks

回复评论
版本 5.1 2024.01.16
+ ATR indicator added to filter the alerts base on the ratio of candle body to ATR value.
+ Alert for PP level added to Pivot Point alerts.
+ If you set the parameter "Symbol List"=0 then the dashboard only loads the current chart symbol.
+ If you set the parameter "Timeframe List" =0 then the dashboard only loads the current chart timeframe for all symbols.
版本 5.0 2023.11.16
+ Now dashboard can show the price distance to upper and lower S/R zones and pivot levels for all symbols and timeframes.
+ Dashboard shows if the price gets near to the S/R zones by changing the background color of related cell (near is based on the ATR value).
+ You can receive alerts when the price gets near to the S/R zones (near is based on the ATR value).
+ Minor bug fixes and improvements.
版本 4.5 2023.05.09
+ Now the dashboard shows 6 near S/R zones (previously 4) in opened charts when you click on dashboard cells.
+ You can choose which type of price interaction with the S/R zones must be shown on the dashboard (entering, leaving, breaking or being inside the zone).
+ Dashboard optimization for receiving alert when “Every minute” parameter is active.
+ Now the dashboard can show the S/R zones and pivot lines on the new charts opened with custom template.
+ A parameter added to enable alerts for selected timeframes on startup of dashboard.
+ Improving the dashboard appearance.
+ Minor improvements and bug fixes.
版本 4.0 2022.11.09
+ Pivot point lines and alerts (daily, weekly, and monthly) added to the dashboard.
+ Input parameters modified and updated.
版本 3.1 2022.10.20
+ You can now choose when the scanner check for alerts: on timeframe candle close or on 1-minute candle close.
+ More informative alert messages.
版本 3.0 2022.10.13
+ Now dashboard shows the near zones to price (and their name and price labels) when you click on any cell of the dashboard.
+ You can select to update the dashboard each minute or on timeframe candle close.
+ 2 more candle filters added to the dashboard: "Min. candle body to height ratio" and "Min. candle height to zone height ratio".
+ Now you can set different colors for different S/R zones.
+ You can select to show zones in the dashboards chart instead of opening a new chart when clicking on a dashboard cell (useful for wide screens).
+ Detection of broken zones optimized.
+ Now you can choose to disable finding the proven and verified zones (for those who want to work only with fresh zones).
+ "Weak" and "Untested" names for zones changed to more meaningful names "Weak fresh" and "Fresh".
+ 2 parameters "Fractal Fast Factor" and "Fractal Fast Factor" added for more compatibility with "Shved Supply and Demand" indicator.
+ Improvement in dashboard performance and minor improvements in different parts of dashboard.
版本 2.0 2022.07.01
- Pagination added to the parameters, you can separate the market watch symbols in multiple dashboards.
- Panel shows the symbol and timeframe that is loading (on the header).
- The option “Split symbols in 2 columns” added to the parameters, now you can show more symbols in the dashboard on a single chart.
- Improvement in showing the S/R zones in charts that are opened by clicking on dashboard cells.
- Small bug fixes and performance improvement.