• 概述
  • 评论
  • 评论

Traders Dynamic Index TDI

Online Translation - 网上传输

交易员动态指数是将多个指标组合成一个复杂的信号阵列,可以对市场行为进行解释。

它结合了RSI、布林线和移动平均线,最早由Dean Malone开发,由于它将一个经常使用的策略结合到一个单一的指标中,因此得到了突出的应用。

RSI将确定仪器的超买或超卖阶段,该阶段将被MA平滑和过滤,然后布林线将评估价格的振幅和预期方向。

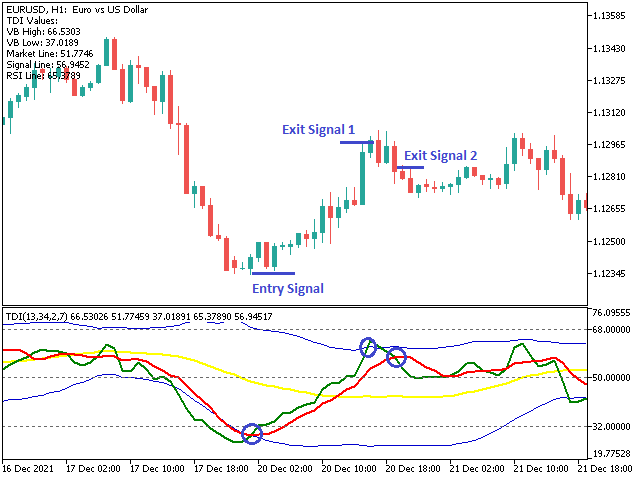
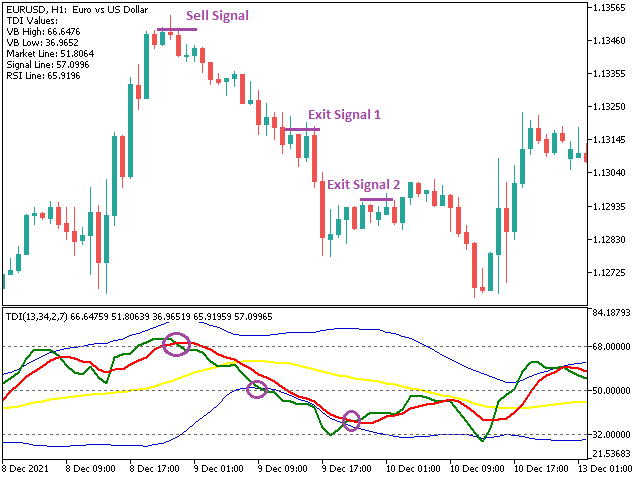
该指标绘制了5条线来帮助你的交易。VBHigh和VBLow线是由布林线和黄色市场主线定义的交易通道。当这条线越过通常的RSI超买和超卖区域时,它可以表明市场的反转。

绿线和红线来自RSI,可以被认为是快线(绿)和慢线(红)。当这些线交叉时,就会出现短期信号。

下面的例子显示了你如何利用RSI线的交叉来获得进场信号,以及你如何利用布林带通道来决定出场。

有很多方法可以解释这些信息,只要知道个别指标试图告诉你什么,就可以制定出适合个别工具的策略。

推荐产品
Forex Relative Performance indicator This indicator calculates the relative strength of major currencies against the US dollar. The basic idea behind this indicator is "to buy strong currency and to sell weak currency". This indicator allows you to quickly identify the best forex pair to trade according to your trading style (Intraday, Scalping, Swing, or Long Term)
324 USD
DeviationScaledMAV1
Hicham Ait Taleb
The "Deviation Scaled Moving Average Crosses" indicator is a powerful technical analysis tool designed for the MetaTrader 5 trading platform. It facilitates informed trading decisions by visually presenting the interaction between two moving averages, both of which are smoothed and scaled to offer enhanced insights into market trends. This custom indicator is developed by mladen and is copyright-protected for the year 2023. Using a unique approach, the indicator displays two types of deviatio
150 USD
Gioteen Volatility Index (GVI) - your ultimate solution to overcoming market unpredictability and maximizing trading opportunities. This revolutionary indicator helps you in lowering your losing trades due to choppy market movements. The GVI is designed to measure market volatility, providing you with valuable insights to identify the most favorable trading prospects. Its intuitive interface consists of a dynamic red line representing the volatility index, accompanied by blue line that indicate
100 USD
Quantum Trends Indicator for MT5
QUANTUM TRADING SOFTWARE LIMITED
One of the oldest maxims in trading is ‘let the trend be your friend’. You must have come across it! This is easier said than done! First, you have to identify one, then you have to stay in – not easy. Staying in a trend to maximise your profits is extremely difficult. In addition, how do you know when a trend has started? It’s very easy to look back and identify the trend. Not so easy at the live edge of the market. The Quantum Trends indicator is the ‘sister’ indicator to the Quantum Trend Mon
197 USD
Limitless MT5
Dmitriy Kashevich
Limitless MT5 is a universal indicator suitable for every beginner and experienced trader. works on all currency pairs, cryptocurrencies, raw stocks Limitless MT5 - already configured and does not require additional configuration And now the main thing Why Limitless MT5? 1 complete lack of redrawing 2 two years of testing by the best specialists in trading 3 the accuracy of correct signals exceeds 80% 4 performed well in trading during news releases Trading rules 1 buy signa
1 399 USD
Exclusive Bollinger MT5
Evgeny Belyaev
3.25 (4)
Exclusive Bollinger is a professional indicator based on the popular Bollinger Bands indicator and provided with an advanced algorithm. Unlike the standard Bollinger , my Exclusive Bollinger provides better signals and is equipped with flexible settings allowing traders to adjust this indicator to their trading style. In the indicator, you can set up alerts (alert, email, push), so that you won't miss a single trading signal. Exclusive Bollinger for the MetaTrader 4 terminal :  https://www.mql5.
32 USD
Smooth price for Monarch
Konstantin Gruzdev
5 (1)
The Smooth Price technical indicator is used for plotting a smoothed line as close to the price of the financial instrument as possible, and serves to eliminate its noise components. The indicator is part of the Monarch trading system, but here it is presented as an independent technical analysis tool. The indicator is based on the cluster digital filter , which, unlike the ClusterSMA , is applied directly to the price time series. Smooth Price does not redraw (except the very last, zero bar) an
999 USD
EA Falcon MT5
Renat Garaev
EA Falcon 是一種基於兩種主要策略的算法,允許您在主要趨勢的方向上進行交易,並使用附加功能使交易在風險和利潤方面更安全、更合理。 這是一款多功能的 EA 交易和出色的投資組合多元化工具,具有靈活的設置,可根據您的喜好配置為保守、最佳或激進的交易。 這些設置可以在產品討論中下載,或者您可以要求為您單獨進行設置。 交易貨幣對、金屬和指數的顧問。 (EURUSD、GBPUSD、AUDUSD、JPYUSD、NZDUSD、USDCAD、XAUUSD、DE40、USTECH、US500 等。) 聯繫我進行個別諮詢。 策略: - 不對稱分形。 Сustom 指標。 - 線性回歸。 Сustom 指標。 這允許 EA 僅在主要趨勢的方向上交易。 功能: - 新聞過濾器。 允許您指定在拍賣會外發布消息前後的時間。 您還可以選擇新聞的重要性級別。 可以啟用或禁用該功能。 - 在選定時間範圍內關閉蠟燭時在網格中開倉訂單,這樣您就可以避免在突然變動期間開立大量頭寸。 可以啟用或禁用該功能。 - 傳播控制。 在打開第一個倉位和網格中的倉位時檢查點差
799 USD
Cycles Forecast
Pooriya Alirezaee
This indicator is based on a mathematical formula and an ANN combined, designed to make a model(using previous prices) of the most recent market condition (any chart*) in order to use the model as a forecasting tool. *This indicator can operate on any chart/timeframe, but it's suggested you use multiple timeframes for each trade because this method relies solely on the time factor, you can not use this indicator to predict price volatility, but if it's fit correctly it will show you when the nex
1 449 USD
A professional tool for trading - the divergence indicator between the WPR and the price, which allows you to receive a signal about a trend reversal in a timely manner or catch price pullback movements (depending on the settings). The indicator settings allow you to adjust the strength of the divergence due to the angle of the WPR peaks and the percentage change in price, which makes it possible to fine-tune the signal strength. The indicator code is optimized and is tested very quickly as par
37 USD
Inputs controller
Maryna Shulzhenko
I want again that the wedge light on all the indicators did not converge. No matter how hard you search, you still will not find an indicator that will always and in all conditions give you exclusively profitable signals. As you can see, everything is quite simple, and you don’t even need to analyze anything, in fact. In general, I would say that the Signal No Problem indicator can be a great help for creating your own trading system. It goes without saying that you don’t need to trade only by a
89 USD
This indicator scans the 1-3 Trendline pattern . The indicator is a 100 % non repaint low risk breakout system . The patterns are formed around swing high and swing lows which make them a low risk pattern with high reward. PATTERN BACKGROUND The 1-3 Trendline Breakout pattern is formed by four(4) points which are composed of three (3) primary points and the pattern neck. A trendline is always formed by the point 1 and the neck of the pattern . When price breaks out of the trendline formed ,
89 USD
AV Monitor MT5
Anja Vivia Vogel
5 (1)
"AV Monitor MT5" is an indicator for MetaTrader 5, which alowes a history analysis of the closed orders. It helps to achieve a quick visual analysis of your own trading or different expert advisors among themselves. Compare and analyze your expert advisors: Which one is the best? I use an "AV Monitor MT5" indicator per running expert advisor chart to track its performance split into long & short, as well as an index chart e.g. DOW with this indicator and the setting "Show Balance & Equity" to
70 USD
Trend Scanner MT5
Alfiya Fazylova
5 (1)
Trend Scanner is a trend indicator that helps to determine the current and forecast market direction using an advanced algorithm. Thanks to flexible alert settings, the indicator will promptly warn you about a trend reversal. The indicator is intuitive and easy to use, and will be an excellent filter in your trending trading strategies. The lines of this indicator are also an excellent dynamic level for stop loss, and is used as one of the types of trailing stop in Trading Panel . To fine-tune t
30 USD
Reverse Rayer MT5
Oleksandr Novosiadlyi
Description Reverse Rayer  is an indicator that draws rays on inclined trend levels. Recommendations You can use this indicator to determine the trend and, accordingly, to determine the direction of opening a position or closing an opposite position. Parameters ===== _INDICATOR_SETTINGS_ =====  - indicator settings Maximum History Bars  - maximum number of history bars for calculating the indicator. Average True Range Period  - ATR indicator period (used to calculate the difference be
30 USD
Furia
Osaeldi Honorato De Jesus
The Fúria indicator was developed to work when the market is in trend, that is, you will rarely see any signs in consolidation zones. It can be used for both Forex and Binary Options. The signs plotted on the graph do not repaint or recalculate, even if you close and reopen your MT4 / MT5 they will be there. Wait for the signal to set on the candle before you can enter the next candle. ================================================== * BUFFERS: 0 (CALL) and 1 (PUT); * TYPE OF ENTRY: n
85 USD
Scalping Entry Points - is a manual trading system that can adjust to price movements and give signals to open trades without redrawing. The indicator determines the direction of the trend by the central level of support and resistance. The dot indicator provides signals for entries and exits.  Suitable for manual intraday trading, scalping and binary options. Works on all time frames and trading instruments. The indicator gives several types of alerts. How to use the product The blue line
155 USD
用於確定平面和趨勢的指標。 如果價格低於兩條直方圖和兩條線(紅色和藍色)中的任何一條,則這是一個賣出區域。 購買此版本的指標時,一個真實賬戶和一個模擬賬戶的 MT4 版本 - 作為禮物(收到,給我寫私信)! 如果價格高於兩條直方圖和兩條線(紅色和藍色)中的任何一條,則這是一個買入區域。 MT4 版本: https://www.mql5.com/en/market/product/3793 如果價格在兩條線之間或在任何直方圖的區域內,那麼市場就沒有明確的趨勢。簡單地說,市場是平的。 指標的工作在屏幕截圖中更清楚地顯示。 該指標可用作獨立的交易系統。該指標可用於獲取領先數據或確定當前趨勢的方向。對於任何級別的交易者來說,這都是一個很好的工具!
69 USD
Draga 13
Yriy Doronin
The indicator is created using a unique algorithm that has no analogues. Based on the calculations, the contract price itself and the percentages displayed in it are calculated, which are displayed in the indicator in the form of histograms in two drawing options, as well as in six options for displaying prices on a chart in various combinations, which allows you to accurately see the interest of all trading participants in the form of drawing levels support and resistance. Trading decisions can
300 USD
Price action is among the most popular trading concepts. A trader who knows how to use price action the right way can often improve his performance and his way of looking at charts significantly. However, there are still a lot of misunderstandings and half-truths circulating that confuse traders and set them up for failure. Using PA Trend Reversal will be possible to identify high probability exhaustion moves of a trend. Features The indicator gives alerts in real-time when the conditions are me
60 USD
PipFinite Breakout EDGE MT5
Karlo Wilson Vendiola
4.84 (111)
The Missing Edge You Need To Catch Breakouts Like A Pro. Follow a step-by-step system that detects the most powerful breakouts! Discover market patterns that generate massive rewards based on a proven and tested strategy. Unlock Your Serious Edge Important information here www.mql5.com/en/blogs/post/723208 The Reliable Expert Advisor Version Automate Breakout EDGE signals using "EA Breakout EDGE" Click Here Have access to the game changing strategy that will take your trading to the n
98 USD
However, the difficult task here for traders is to understand and select the indicator or tool that can help them with their trading plan and benefit their trading style. Traders want a tool that requires minimal effort and provides as much support as it can. There are multiple reasons for which traders need an indicator. One such reason is to determine the buy-sell signals in the market. The   King Binary Forex Scalping Indicator   is a tool that can help traders get answers to many questio
699 USD
Flag Pattern pro is a   Price Action (PA)   analytical tool that scans the   continuation patterns   known as   "Flag and Pennant Patterns"   . Flag and Pennant patterns are continuation patterns characterized by a move in a previous trend direction after a shallow retracement usually below 50% of the original move . Deep retracements can however be sometimes found at the 61.8 % levels. The original move is know as the   flag pole   and the   retracement   is called the flag. Indicator Fun
89 USD
FX Tiger MT5
Benedict Paul Wilson
A simple and highly effective Strength and Weakness currency indicator that can be used to aid your fundamental and technical analysis for winning trade decisions. The indicator is very easy to use and can be applied to all time frames. FX Tiger uses an advanced algorithm to calculate a score table for all major currencies. Green indicates currency strength and red indicates currency weakness. Once you have identified the strong and weak currencies, pair strong versus weak currencies and co
299 USD
FFx Universal MTF Alerter MT5
Eric Venturi-Bloxs
4.67 (3)
The FFx Universal MTF alerter shows on a single chart all the timeframes (M1 to Monthly) with their own status for the chosen indicator. 9 indicators mode (MACD-RSI-Stochastic-MA-ADX-Ichimoku-Candles-CCI-PSAR). Each can be applied multiple times on the same chart with different settings. Very easy to interpret. Confirm your BUY entries when most of the timeframes are showing green color. And confirm your SELL entries when most of the timeframes are showing red color. 2 Alert Options : input to
39 USD
Nemesisfx boom and crash
Shandrey Naswil Petersen
trade boom and crash with trend arrows no repaint arrows direction of use  if you buy boom stoploss below arrow  if you sell crash stoploss above arrow please note that you need to follow trend to have perfect trades only use on m15   allow candles to close before taking trades please make sure you find this indicator useful as it has a 80% win rate on m15 h1 and h4 make good trades
100 USD
The indicator detects divergence signals - the divergences between the price peaks and the MACD oscillator values. The signals are displayed as arrows in the additional window and are maintained by the messages in a pop-up window, e-mails and push-notifications. The conditions which formed the signal are displayed by lines on the chart and in the indicator window. The indicator parameters MacdFast - fast MACD line period MacdSlow - slow MACD line period MacdSignal - MACD signal line period Mac
30 USD
Naked Forex Kangaroo Tail Indicator Kangaroo Tail Indicator is a pattern recognition indicator for Forex, Stocks, Indices, Futures, Commodities and Cryptos. The Kangaroo Tail is a multi-bar pattern. The Kangaroo Tail pattern is very effective and is very simple to trade. The strategy that comes with the Kangaroo Tail is based on price action. The indicator does what it was designed for: displaying Kangaroo Tail patterns.   Don't expect to follow the up and down arrows and make money . Tr
177 USD
MarketMagnet
Kelly Adediran Raymond
Are you ready to take your trading journey to new heights? Look no further than MarketMagnet, this groundbreaking indicator designed to propel your trading success with excitement and accuracy. Powered by the convergence of Momentum and CCI (Commodity Channel Index), MarketMagnet equips traders with the ultimate tool to determine direction and entry prices for a wide range of recommended currency pairs and instruments. It is designed for traders seeking to scalp for a few pips on lower timeframe
499 USD
该产品的买家也购买
IVISTscalp5
Vadym Zhukovskyi
5 (1)
我们向您介绍iVISTscalp5指标,它不仅独特,而且在交易操作中也非常有效。该指标基于时间数据,是多年金融市场经验和深入分析的结果。iVISTscalp5指标是手动交易的优秀工具。便利性、简单性和可视化 - 所有的复杂性都隐藏在内部。我们将iVISTscalp5指标的设置和使用简化到了最大程度。该指标适用于MT5终端中您所拥有的所有金融工具。 操作时间为UTC+3的早上4点到晚上8点。 iVISTscalp5指标菜单(见截图1): History - 计算行情的周数 dT_min - 选择时间间隔的时间(分钟) TFline - 绘制水平成交量(时间帧) BARSline - 绘制水平成交量(条数) TFtrend1 - 绘制日线通道(时间帧) BARStrend1 - 绘制日线通道(条数) TFtrend2 - 绘制周线通道(时间帧) BARStrend2 - 绘制周线通道(条数) ALERT_TIMER - 设置闹钟 ALERT - 开启/关闭闹钟 Save - 开启/关闭将时间记录到文本文件。 图表上的红色和蓝色旗帜表示时间(VIST智能剃须系统的信号)。卖出信号为红旗,买入
500 USD
Advanced Supply Demand MT5
Bernhard Schweigert
4.36 (11)
任何新手或专业交易者的最佳解决方案! 该指标是一款独特、高质量、且价格合理的交易工具,因为我们已经整合了许多专有功能和新公式。 依据此更新,您将能够显示双重时间帧区域。 您不仅可以显示一个较高的时间帧,还可以同时显示图表时间帧,加上更高的时间帧:显示嵌套时区。 供需双方所有交易者都会喜欢它。 :) 重要信息披露 高级供需的最大潜力,请访问 https://www.mql5.com/zh/blogs/post/720245   想象您的交易如何得以改善,是因为您能够精准定位入场或目标位吗? 构建于新的底层算法,它可以更轻松地识别出买卖双方之间的潜在失衡。 这是因为它以图形方式展示供需最强劲区域,及其过去的表现(显示旧区域)。 这些功能旨在帮助您更轻松地发现最佳入场区域和价位。 现在您可以针对您的交易品种和时间帧来优化和编辑区域强度! 高级供需指标适用于所有产品和时间帧。 它是一个新的公式,非常新的功能是两个区域强度函数可由用户输入进行调整! 这在交易中是一大优势。 当您学习如何使用专有功能,例如带有价格游离最小 X 因子的区域强度时,您能够判断该区域强劲与否。 供需区域用作警报触发器
199 USD
PZ Harmonacci Patterns MT5
PZ TRADING SLU
3.25 (4)
可以说,这是您可以为MetaTrader平台找到的最完整的谐波价格形成自动识别指标。它检测19种不同的模式,像您一样认真对待斐波那契投影,显示潜在的反转区域(PRZ),并找到合适的止损和获利水平。 [ 安装指南 | 更新指南 | 故障排除 | 常见问题 | 所有产品 ] 它检测19种不同的谐波价格形态 它绘制了主要,衍生和互补的斐波那契投影(PRZ) 它评估过去的价格走势并显示每个过去的形态 该指标分析其自身的质量和性能 它显示合适的止损和获利水平 它使用突破来表明合适的交易 它在图表上绘制所有样式比率 它实现了电子邮件/声音/视觉警报 受斯科特·M·卡尼(Scott M. Carney)的书的启发,该指标旨在满足最纯粹和最熟练的交易者的需求。但是,它采取了一种使交易更容易的方式:在向交易发出信号之前,它会等待Donchian朝正确方向突破,从而使交易信号非常可靠。 斐波那契投影与向量无关 它实现了电子邮件/声音/推送警报 它绘制了ABCD投影 重要提示: 为了符合 Scott M. Carney先生 的商标申诉,某些图案名称已重命名为不言自明的替代方式, Scot
299 USD
XQ Indicator MT5
Marzena Maria Szmit
3.25 (4)
The signal conditions are a combination of three indicators, and XQ Forex Indicators only display  medium and long-term trends . The indicator's efficacy has been improved with the addition of a filter that blocks out false signals. The XQ Forex Indicator can be used on  FX pairs, CFDs, and Cryptocurrencies . There are two type of signals:  Buy or Sell and Big Long or Big Short It is possible to enable sending emails when a major trend-change signal is detected, as well as to display the alerts
179 USD
TPA True Price Action indicator reveals the true price action of the market makers through 100% non-repainting signals strictly at the close of a candle! TPA shows entries and re-entries, every time the bulls are definitely stronger than the bears and vice versa. Not to confuse with red/green candles. The shift of power gets confirmed at the earliest stage and is ONE exit strategy of several. There are available now two free parts of the TPA User Guide for our customers. The first "The Basics"
168 USD
RubdFx Perfect Reversal , The reversal indicator is used to determine areas of support and resistance by Drawing an arrow with a level of supply and demand ( ReversalZones ). - You will catch more swings by reducing the period, and less swings if you increase period - Mobile, computer and email alerts available . it is not pushed by price which means the arrow will stay in one place,suitable for scalping and long term trading  Also Compatible with all forex paris , BUY RULES;  open a buy positio
159 USD
Volume by Price MT5
Brian Collard
5 (2)
The Volume by Price Indicator for MetaTrader 5 features Volume Profile and Market Profile TPO (Time Price Opportunity). Get valuable insights out of currencies, equities and commodities data. Gain an edge trading financial markets. Volume and TPO histogram bar, line and metric charts. TPO letter and block marker charts including split structures. Positioning and styling options to suit the user's needs and context. Volume Profile and Market Profile TPO Point of Control (VPOC and TPOC), Imbalanc
259 USD
Introduction to Fractal Pattern Scanner Fractal Indicator refers to the technical indicator that makes use of the fractal geometry found in the financial market. Fractal Pattern Scanner is the advanced Fractal Indicator that brings the latest trading technology after the extensive research and development work in the fractal geometry in the financial market. The most important feature in Fractal Pattern Scanner is the ability to measure the turning point probability as well as the trend probabil
185 USD
本指标是实践实战交易完善的波浪自动分析的指标   ! 黄金实战 案例... 注:波浪分级用西方叫法不习惯,因 受到缠论(缠中说禅)命名方式习惯的影响,我是将基础波浪命名为 笔 , 将二级波段命名为 段 , 同时具有趋势方向的段命名为 主趋段 (以后笔记中都是这种命名方式,先告知大家),但是算法上和缠论关系不大切勿混淆.反映的是本人分析盘面总结的 千变万化纷繁复杂的运行规律 . 对波段进行了标准化定义,不再是不同人不同的浪 , 对人为干扰的画法进行了排除 , 在严格分析进场起到了关键的作用 . 指标内容 1.   基础波浪(笔): 首先我们找出了价格波动过程中的基础波动拐点,当然他的有序性还不算太强,为下一步的计算提供基础 . 2.   二级波段(段) :在基础波浪的基础上,通过算法分析得到层级更明显的二级波段,二级波段为波浪提供了分析基础 3.   波浪(浪): 有着更清晰的趋势,更清晰直观的方向.分析一个波浪是否延续,需要看二级波段的形态,分析二级的构成,可以得出波浪后续的预测. 4.   通道: 通道计算采用了线性回归的方式进行计算. 5.   回撤: 波浪中的两个重要回撤会在
188 USD
PZ Divergence Trading MT5
PZ TRADING SLU
3.67 (3)
棘手的发现和频率稀缺是最可靠的交易方案之一。该指标使用您喜欢的振荡器自动查找并扫描常规和隐藏的发散。 [ 安装指南 | 更新指南 | 故障排除 | 常见问题 | 所有产品 ] 容易交易 发现常规和隐藏的分歧 支持许多知名的振荡器 根据突破实现交易信号 显示适当的止损和获利水平 可配置的振荡器参数 可自定义的颜色和尺寸 按条形过滤大小差异 实现绩效统计 它实现了电子邮件/声音/视觉警报 为了提供广阔的市场前景,可以使用不同的振荡器在同一张图表中多次加载该指标,而不会产生干扰。该指标支持以下振荡器: RSI CCI MACD OSMA 随机 动量 很棒的振荡器 加速器振荡器 威廉姆斯百分比范围 相对活力指数 由于差异可能会扩大很多,尤其是在外汇市场中,因此该指标产生了转折:它在等待交易突破之前等待donchian突破确认差异。最终结果是带有非常可靠的交易信号的重新粉刷指示器。 输入参数 幅度:用于寻找差异的之字形周期 振荡器-选择要加载到图表的振荡器。 突破期-交易信号的突破期,以柱为单位。 发散类型-启用或禁用发散类型:隐藏,常规或两者。 最小散度单位为条形-最
249 USD
Introduction to X3 Chart Pattern Scanner X3 Cherart Pattern Scanner is the non-repainting and non-lagging indicator detecting X3 chart patterns including Harmonic pattern, Elliott Wave pattern, X3 patterns, and Japanese Candlestick patterns. Historical patterns match with signal patterns. Hence, you can readily develop the solid trading strategy in your chart. More importantly, this superb pattern scanner can detect the optimal pattern of its kind. In addition, you can switch on and off individu
250 USD
Bill Williams Advanced
Siarhei Vashchylka
5 (1)
Bill Williams Advanced is designed to analyze the chart according to Bill Williams' Profitunity system. The indicator analyzes the signals of the AO, AC indicators and places them in the panel in the upper left corner of the chart. In addition, using hot keys, the indicator instantly displays / hides the AO and AC indicators (for more details, see the video instructions). Description Each line of the indicator table represents the signals of the Profitunity system that are valid on the last fi
199 USD
VTrende Pro
Andrii Diachenko
VTrende Pro - MTF indicator for trend trading with a display panel for MT5 *** Videos can be translated into any language using subtitles (video language - Russian) Although the signals of the VTrende Pro indicator can be used as signals of a full-fledged trading system, it is recommended to use them in conjunction with the Bill Williams TS. VTrende Pro is an extended version of the VTrende indicator. Difference between Pro version and VTrende: - Time zones - Signal V - signal 1-2 waves
697 USD
Traffic Signal
Ramzi Abuwarda
推出瞩目的MT5指标——交通信号,它基于分析RSI(相对强弱指标)、Stochastics(随机指标)、CCI(商品通道指标)和趋势等多个时间框架上的水平,以获取最准确的入场信号的特殊策略。交通信号是您成功交易的终极通道!该创新指标精确且专业,通过集成先进的技术指标,并覆盖所有时间框架,助您准确把握市场动向,为您提供无与伦比的自信心。 通过交通信号,您可以全面分析关键指标,经过精密校准,以探测最具利润潜力的交易机会。告别不确定性,迎接明智决策的新时代。交通信号将RSI、Stochastics、CCI和趋势等指标融合得天衣无缝,为您描绘市场动态提供鲜活画面,前所未有。 畅享轻松的市场趋势和模式,交通信号为您持续监测各个时间框架。无论您偏好短期激动还是长期战略,这一杰出指标均可满足您的交易风格,为您提供对市场起伏的整体认知。 交通信号的准确性是其成功的基石。通过广泛的研究与开发,该指标提供精确调校和时机准确的信号。告别虚假信号,迎接前所未有的可靠性水平。就像有一位可信赖的盟友与您并肩作战,以毫不动摇的准确性引导您走向丰盈机会。 通过直观的界面和易于理解的信号,您将体验到自信交易的乐趣。无论
450 USD
Weis Wave with Alert MT5
Trade The Volume Waves Single Member P.C.
4.93 (14)
Get 30% Discount until 30/9/20203 on Lifetime package 420$ from 599$. Rental/Lifetime Package Options and Privileges  * For optimum results the yearly or lifetime package is suggested due to live training and Discord  channel trading with the  creator! Rent Monthly Six Months   Yearly/Lifetime Weis Wave with Speed with Alert+Speed Index x x x Manual  x x x Quick Set up Video x x x Blog x x x Lifetime Updates x x x Setup and Training Material x x Free Rectangle Break Alert Tool      x Discord
420 USD
Introduction Excessive Momentum Indicator is the momentum indicator to measure the excessive momentum directly from raw price series. Hence, this is an extended price action and pattern trading. Excessive Momentum Indicator was originally developed by Young Ho Seo. This indicator demonstrates the concept of Equilibrium Fractal Wave and Practical Application at the same time. Excessive Momentum detects the market anomaly. Excessive momentum will give us a lot of clue about potential reversal and
200 USD
Elliott Wave Trend MT5
Young Ho Seo
4 (3)
Elliott Wave Trend was designed for the scientific wave counting. This tool focuses to get rid of the vagueness of the classic Elliott Wave Counting using the guideline from the template and pattern approach. In doing so, firstly Elliott Wave Trend offers the template for your wave counting. Secondly, it offers Wave Structural Score to assist to identify accurate wave formation. It offers both impulse wave Structural Score and corrective wave Structure Score. Structural Score is the rating to sh
200 USD
PZ Trend Trading MT5
PZ TRADING SLU
3.67 (3)
许多盈利交易者不仅知道如何识别市场趋势,而且也能把握趋势建立后的交易机会。 Pz 趋势交易 指标设计用来在趋势行情中尽可能的赚取利润。 已建立的趋势提供了一揽子交易机会,但大多数趋势交易指标完全忽视了它们,让交易者在趋势行情时完全不知道该如何做!一般趋势指标只通知有关的趋势变化,但根本不足以得到卓越的回报. Pz 趋势交易 指标比一般趋势指标显示多达 20 倍的交易 , 因为它注重所谓的市场时机。它不仅显示当前的市场趋势,也有回调,内柱线的突破和调整。它令您在趋势回调之后介入,安全的柱线内突破金字塔加仓,以及发现潜在的反转,和已知的调整。 趋势改变 一个趋势改变在市场方向变化时发生。趋势变化在图表上用带数字的彩色圆圈显示。蓝色 (1) 信号为上涨开始, 而红色 (1) 信号为下跌开始。趋势变化并非评估当前价格动作的结果, 它意味着交易设置是不定时地。如果您正确使用本指标, 在趋势变化时, 您将将已经入场 (参看下面的调整)。 回调 但凡趋势在运动中,行情上下抖动,盈利者收割利润,且其它参与者入场。趋势回调代表好的买入机会,通常是由主力获利离场导致。如果行情在回调后回归上行, 指
249 USD
"Piranha" - an autonomous trading system that determines overbought and oversold levels on the chart. Red and blue zones represent overbought and oversold levels respectively. Entry points are marked with arrows: a downward arrow in the red zone for "sell" and an upward arrow in the blue zone for "buy". The Take profit level is indicated by the green moving average. Key features: Adjusting the Take profit level as the green moving average changes position. Averaging ability when a new market e
300 USD
PZ Swing Trading MT5
PZ TRADING SLU
5 (4)
Swing Trading 是第一个旨在检测趋势方向的波动和可能的反转波动的指标。它使用在交易文献中广泛描述的基准摆动交易方法。该指标研究多个价格和时间向量,以追踪总体趋势方向,并检测市场超卖或超买并准备好进行修正的情况。 [ 安装指南 | 更新指南 | 故障排除 | 常见问题 | 所有产品 ] 市场波动的利润不会被窃取 指示器始终显示趋势方向 彩色价格带代表机会基准 彩色虚线表示可能的反转波动 该指标分析其自身的质量和性能 它实现了一个多时间仪表板 可定制的趋势和波动周期 它实现了电子邮件/声音/推送警报 指示器为非重涂或重涂 什么是摇摆交易 摇摆交易是一种尝试在一天到一周内从证券中获得收益的交易方式,尽管某些交易最终可以保持更长的寿命。摇摆交易者使用技术分析来买入弱点和卖出力量,并有耐心等待这些机会的发生,因为在发生一波抛售浪潮之后购买证券而不是陷入抛售更有意义。 机会基准 关于历史数据的大量研究证明,适合于波动交易的市场倾向于在基线价格带上下交易,基线价格带由图表显示,使用平均真实区间计算得出。波动交易者使用基线,该策略是购买常态和卖出躁狂,或做空常态并掩盖沮丧。
249 USD
Description Very precise patterns to detect: entry signals as well as breakout, support and resistance reversal patterns. It points out zones in which, with a high probability, institutional orders with the potential to change the price’s direction and keep moving towards it, have been placed. Support:   We create great tools for the entire trading community. Most of them are free. If you believe in what we do  Support Us Here.   KEY LINKS:   Indicator Manual  -  All Products  How is this ind
280 USD
LT Regression Chanel MT5
Sie Samuel Roland Youl
LT 回归通道是一种高度复杂的技术指标,结合了各种分析方法的原理,提供全面准确的市场评估。 其中关键组成部分——信封指标,使得交易员能够评估市场波动性,为潜在价格波动提供宝贵的见解。此外,斐波那契分析的应用增强了对超买和超卖水平的准确识别,帮助交易员做出明智的交易决策。 此外,傅里叶外推在该指标中的加入在预测未来市场走势中起着至关重要的作用。通过同时考虑信封指标和斐波那契分析的数据,LT 回归通道能够提供全面的市场趋势和潜在价格行动。 该指标的一个重要优势在于其多功能性。交易员可以选择将其作为独立工具使用,也可以与其他指标结合,进行更全面的市场分析。它还兼容多种时间框架和图表类型,适用于具有不同交易风格和偏好的交易员。 然而,需要注意的是,该指标可能会出现一些重绘,这意味着过去的数据点可能会随着新数据的添加而改变。为了减轻这种情况,建议使用较长的时间周期,最好在500以上。这样做可以显著提高指标的稳定性,从而实现更可靠和准确的预测。 总体而言,LT 回归通道是一个强大的工具,可以极大地增强交易员的市场分析和决策过程。凭借其整合不同分析原理的能力和适应各种交易场景的
200 USD
PZ Day Trading MT5
PZ TRADING SLU
2.6 (5)
该指标仅使用价格行为分析和donchian渠道以锯齿形检测价格反转。它是专门为短期交易而设计的,根本不需要重新粉刷或补漆。对于精明的交易者来说,这是一个绝佳的工具,旨在增加他们的运作时间。 [ 安装指南 | 更新指南 | 故障排除 | 常见问题 | 所有产品 ] 极易交易 它在每个时间段都提供价值 实施自我分析统计 它实现了电子邮件/声音/视觉警报 基于可变长度的突破和拥挤区域,该指标仅使用价格行为来选择交易并对市场快速做出反应。 显示过去信号的潜在利润 该指标分析其自身的质量和性能 突围的损失突出显示并解决 该指标是不可重涂和不可重涂的 该指标将帮助盘中交易者不要错过单个价格反转。但是,并非所有价格反转都是一样的,也不是具有相同的可行质量。决定要突破哪些突破而忽略哪些取决于交易者的良好判断。 如何解释统计数据 该指标研究其自身信号的质量,并在图表上绘制相关信息。将分析每笔交易,并在图表的左上角显示总体历史结果,这使您可以针对任何给定的工具和时间范围自行优化指标参数。每个乐器和时间表都有其自己的最佳设置,您可以自己找到它们。 最大优惠交易:对于任何给定的交易,MFE都是
249 USD
The indicator is recommended to be used on D1. This version, unlike the version for MT4, does not have an additional filter. Peculiarities Suitable for all tools Many strategies; Important levels, recommendations; Flexibility in settings for different instruments and intervals. Signals B,S - predict the direction of movement of the candle at the beginning or at the close of the candle. Recommended TF from H4 and above. BuyStopLvl, SellStopLvl - levels that can be used to set Limit, Stop order
200 USD
Matreshka
Dimitr Trifonov
5 (1)
Matreshka self-testing and self-optimizing indicator: 1. Is an interpretation of the Elliott Wave Analysis Theory. 2. Based on the principle of the indicator type ZigZag, and the waves are based on the principle of interpretation of the theory of DeMark. 3. Filters waves in length and height. 4. Draws up to six levels of ZigZag at the same time, tracking waves of different orders. 5. Marks Pulsed and Recoil Waves. 6. Draws arrows to open positions 7. Draws three channels. 8. Notes support and re
245 USD
INTRODUCING WORLD'S FIRST MT5 "AUTO SCALE" Naveen Geometric Square with Circle To Analyze Markets Geometric Relationship. Naveen's Geometric Square  has some of the most impressive features you will ever find in Gann & Geometric Analysis world. The Naveen's Geometric Square  is a Powerful method of squaring TIME AND PRICE .It is a free-hand drawing tool giving you control of the size of the box. The internal diagonals, grid-lines and angles can be Enabled/ Disabled. All square diagonals lik
1 299 USD
VAP Volume at price
Savio Araujo
1 (1)
Traders know that paying attention to volume can make the crucial difference in understanding how the market will move. Information such as the traded volume, frequency of executed trades and the correlation of buyers and sellers at a certain time period expand our understanding of volume and can significantly improve the accuracy of our trading forecast. The Volume at Price (or VAP) indicator displays the cumulative traded volume for each price level during a time period, as well as the corr
180 USD
Introduction to Chart Pattern MT Chart Pattern MT is a chart pattern scanner to detect the triangle pattern, falling wedge pattern, rising wedge pattern, channel pattern and so on. Chart Pattern MT uses highly sophisticated chart pattern detection algorithm. However, we have designed it in the easy to use with intuitive user interface. Chart Pattern MT will show all the patterns in your chart in the most efficient format for your trading. You do not have to do tedious manual pattern detection an
180 USD
Robos
Namu Makwembo
5 (2)
Big promotion on the Robos, Get yours now Robos Indicator The   ROBOS   indicator is a multi timeframe oscillator that targets the   overbought   and   oversold  regions of a price chart, a signal is indicated by the two lines crossing, compatible with all tradable instruments Latest Release The latest release is the version 4.0 #What's new in version 4.0 ? Features Extreme oversold and overbought levels ROBOS version  4.0  comes with cool new feature , the ability to target on
255 USD
WAPV Full MT5
Eduardo Da Costa Custodio Santos
## 使用 WAPV Full 專業操作並能夠跟踪 大玩家的錢在哪裡 想像一下,您手中有一個可以單獨進行閱讀的工具 主要市場參與者,顯示最佳交易區域 基於價格和數量分析。 WAPV Full 是一個完整的工具, 100% 專注於 R. Wyckoff 的操作 除了繪製交易波中的市場走勢外,它還繪製了 通過閱讀價格和數量來了解市場。 專業市場根據 R. Wyckoff 的 3 條定律運作 #因果關係 # 供給與需求 # 努力 x 結果 所有這些都在 WAPV Full 中提供,它為您提供 16 種基本工具 為您專業地分析市場,從而 改善你的結果。 查看圖片和視頻以了解我在說什麼。 ## Shǐyòng WAPV Full zhuānyè cāozuò bìng nénggòu gēnzōng dà wánjiā de qián zài nǎlǐ xiǎngxiàng yīxià, nín shǒuzhōng yǒu yīgè kěyǐ dāndú jìnxíng yuèdú de gōngjù zhǔyào shìchǎng cānyù zhě, xiǎnshì zuì jiā jiā
199 USD
作者的更多信息
Simple Long Term MACD
Stephen Carmody
1 (1)
Long Term Double MACD Strategy with EMA Trend Confirmation This strategy uses a leading and lagging MACD indicator. The leading indicator gives the entry signals, and the lagging indicator gives the exit signals. This Expert does not use any account management and as such you should make sure to set good stop losses. Works best on longer timeframes on low volatility pairs.
FREE
Long Term Double MACD Strategy with EMA Trend Confirmation This strategy uses a leading and lagging MACD indicator. The leading indicator gives the entry signals, and the lagging indicator gives the exit signals. Works best on Forex pairs at H1 and higher. It works best on low volatility pairs. If you want to use it on shorter Timeframes then put the default MACDs significantly out from what they are. The long term EMA would need some fine tuning after that. When not using the trailing st
30 USD
筛选:
无评论
回复评论