Stephen Carmody / 卖家
已发布的产品

Long Term Double MACD Strategy with EMA Trend Confirmation
This strategy uses a leading and lagging MACD indicator. The leading indicator gives the entry signals, and the lagging indicator gives the exit signals. This Expert does not use any account management and as such you should make sure to set good stop losses.
Works best on longer timeframes on low volatility pairs.
FREE

Long Term Double MACD Strategy with EMA Trend Confirmation
This strategy uses a leading and lagging MACD indicator. The leading indicator gives the entry signals, and the lagging indicator gives the exit signals.
Works best on Forex pairs at H1 and higher. It works best on low volatility pairs. If you want to use it on shorter Timeframes then put the default MACDs significantly out from what they are. The long term EMA would need some fine tuning after that.
When not using the trailing stop

Online Translation - 网上传输
交易员动态指数是将多个指标组合成一个复杂的信号阵列,可以对市场行为进行解释。
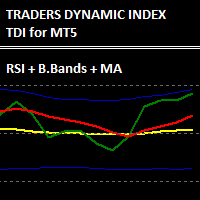
它结合了RSI、布林线和移动平均线,最早由Dean Malone开发,由于它将一个经常使用的策略结合到一个单一的指标中,因此得到了突出的应用。
RSI将确定仪器的超买或超卖阶段,该阶段将被MA平滑和过滤,然后布林线将评估价格的振幅和预期方向。
该指标绘制了5条线来帮助你的交易。VBHigh和VBLow线是由布林线和黄色市场主线定义的交易通道。当这条线越过通常的RSI超买和超卖区域时,它可以表明市场的反转。
绿线和红线来自RSI,可以被认为是快线(绿)和慢线(红)。当这些线交叉时,就会出现短期信号。
下面的例子显示了你如何利用RSI线的交叉来获得进场信号,以及你如何利用布林带通道来决定出场。
有很多方法可以解释这些信息,只要知道个别指标试图告诉你什么,就可以制定出适合个别工具的策略。