Wick Fill Trend Screener
- 指标
- Javier Morales Fernandez
- 版本: 1.0
- 激活: 5
什么是交易中的灯芯?这个筛选器是如何工作的?
蜡烛图中的灯芯反映了价格的拒绝。本筛选器试图识别具有巨大潜力的灯芯。本筛选器专注于发生在趋势市场中的灯芯。
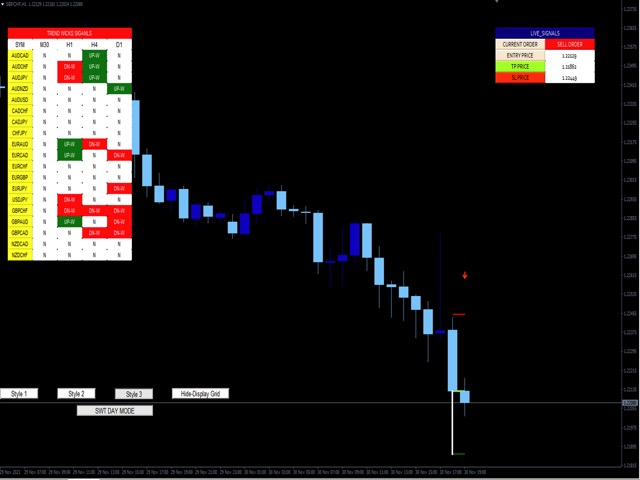
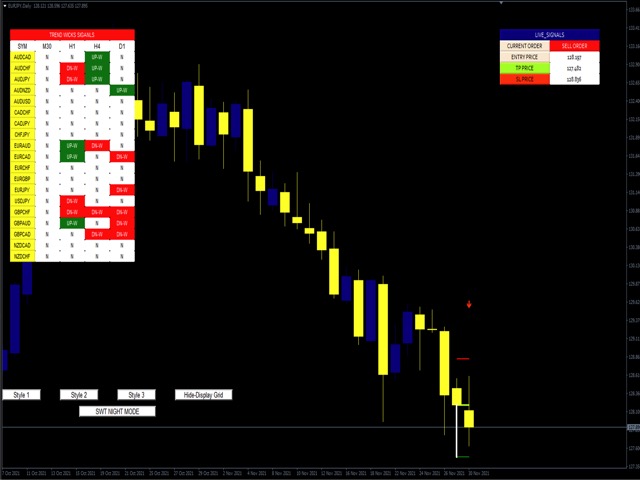
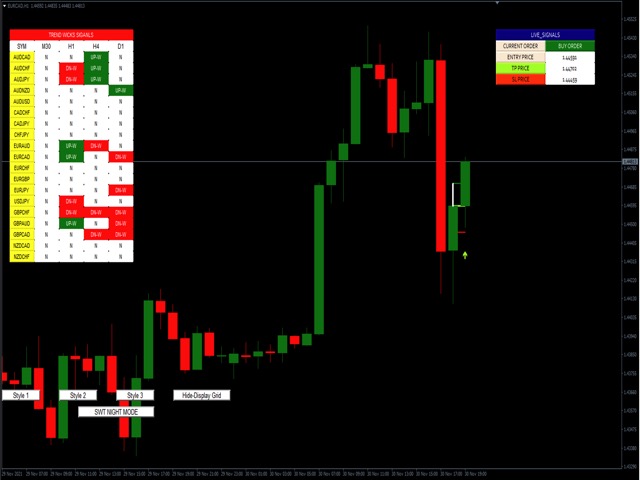
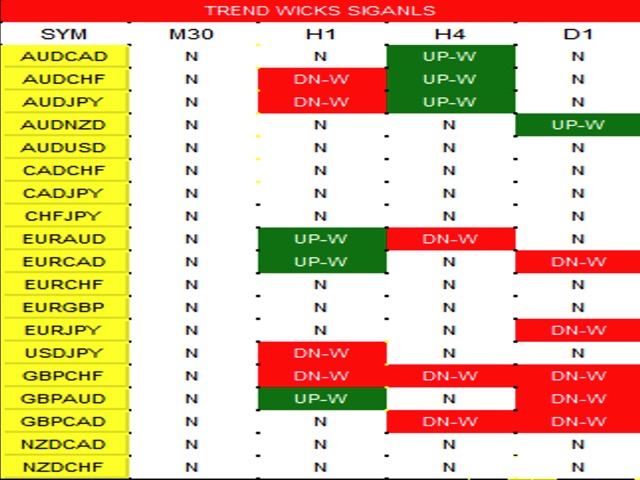
筛选器显示一个仪表板,提供了现场交易的潜在灯芯的整体视图。它显示了所有按时间框架组织的交易对/工具。买入机会被命名为 "UP-W"。它们在仪表板上显示为绿色,而卖出机会被命名为 "DN-W "并显示为红色。交易者必须在屏幕上显示的仪表板上点击所需的灯芯机会,筛选器将显示该具体交易。筛选器根据交易者选择的输入显示机会。请注意,诸如黄金或US30等工具通常有不同的合约大小,这取决于经纪人。请尽量使用具有相同合约大小的交易对或工具。否则,其中一个合约大小的交易对/工具将不会显示任何信号。
-投入
趋势阀芯。这个输入决定了指标必须扫描的芯块大小。它是以%来衡量的。默认情况下是20%。
-信号的数量。这是为成功率模拟器扫描的信号数量。
-移动平均数。这个过滤器是移动平均线指标和RSI的组合。用户有机会根据自己的需要设置RSI和移动平均线。
-前一栏方向。这个功能可以避免或允许基于前一根蜡烛的信号。如果是真的,该指标将只考虑在前一根蜡烛是在相同的趋势方向上的灯芯作为信号。如果它是假的,它将考虑所有的灯芯。
-最后的高点和低点:该功能允许交易者在最后的 "x "条中扫描最后的高点和低点,以避免范围期。
-最小蜡烛尺寸。此项输入是指标将考虑扫描烛芯的最小条形尺寸。
-最大的蜡烛尺寸。这个输入是指标将考虑扫描蜡烛图的最大条形尺寸。
-止损比率。默认情况下,止损是信号蜡烛的HH或LL。这个功能允许用户根据灯芯信号设置一个更大或更小的止损。例如,如果用户选择2,将是基于蜡烛芯的双倍止损。
-交易列表。这个设置选择哪些交易对/工具应该显示在筛选器上。请遵循以下格式。EURUSD, AUDCAD, GBPNZD
*如果你的经纪人名单使用前缀或后缀,你可以使用前缀或后缀。
-警报设置。该指标有警报,可以发送到你的移动设备,激活警报和推送通知。首先,为了接收从手到你的应用程序的信号,用户必须从你的MetaTrader应用程序的设置>聊天和消息>中获得Metaquotes ID。然后,进入桌面版工具>选项>通知-----,在那里插入Metaquotes ID。 然后,它将收到一个实时信号的通知。
如果你想测试策略或在这里使用一个符号,请尝试Wick Fill Trend。
因为风格很重要
我知道每次都要点击属性来改变蜡烛的颜色、背景是浅色还是深色,以及放置或删除网格是多么令人厌烦。这里是我在大多数产品中包含的一键式解决方案。
- 三个可定制的按钮可以选择交易者想要的蜡烛样式。
- 一个按钮可以在白天和夜晚模式之间切换。
- 一个按钮可以在图表上显示或隐藏网格。
***** 在设置中,你可以选择按钮在屏幕上的显示位置*****。
作者
Javier Morales,交易算法的创始人。