Active Pivot Levels MT5
- 指标
- Robert Gerald Wood
- 版本: 1.30
- 更新: 4 十一月 2021
- 激活: 5
枢轴水平是每个市场都认可的完善的技术水平。
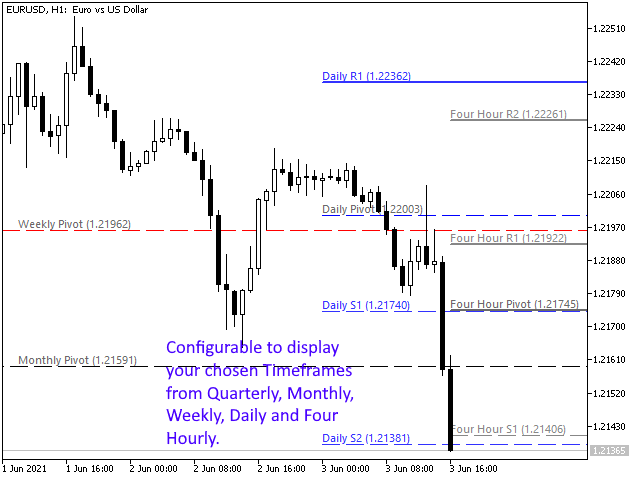
该指标将在图表上为任何符号绘制当前的季度、月度、周度、日度和四小时支点。您还可以显示每个时期的支撑和阻力水平,并选择从水平 1 到 4 显示哪个水平。
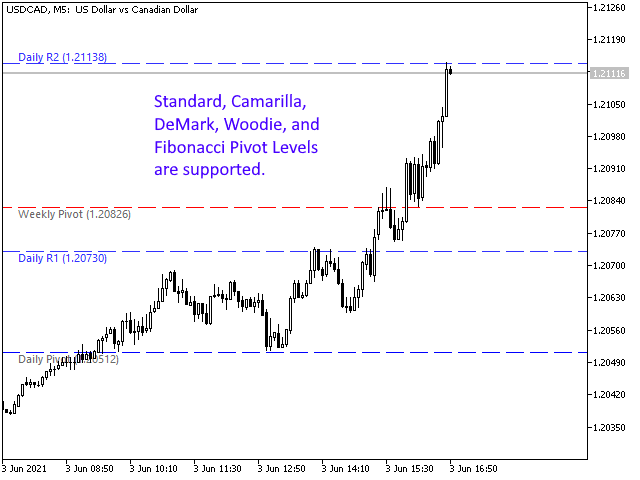
从以下选项中选择枢轴类型:
- 标准
- 卡马里拉
- 丹麦
- 伍迪
- 斐波那契数列
请注意,根据原始规格,DeMark 枢轴具有单一的支撑位和阻力位。
如果线已被价格触及,指标墙会改变绘制线的方式。这可能非常有帮助,一旦触及,支撑线或阻力线的强度就会大大降低。
您可以选择显示每个时间段的预测枢轴水平。这将使用与正常枢轴相同的计算,但将适用于当前不完整的时间范围。因此,最好在那个时期结束时使用它,此时价格已经涵盖了其范围的大部分。
设置
所有设置的详细信息都在单独的博客文章中,可在此处获取:
https://www.mql5.com/en/blogs/post/746511
这是一个高度可配置的指标,因此您可以按照自己的喜好让它工作。