TheStrat FTFC
- 指标
- Robert Gerald Wood
- 版本: 1.2
- 更新: 16 六月 2021
- 激活: 5
FTFC 指的是 Rob Smith 的The Strat定义的全时间框架连续性。
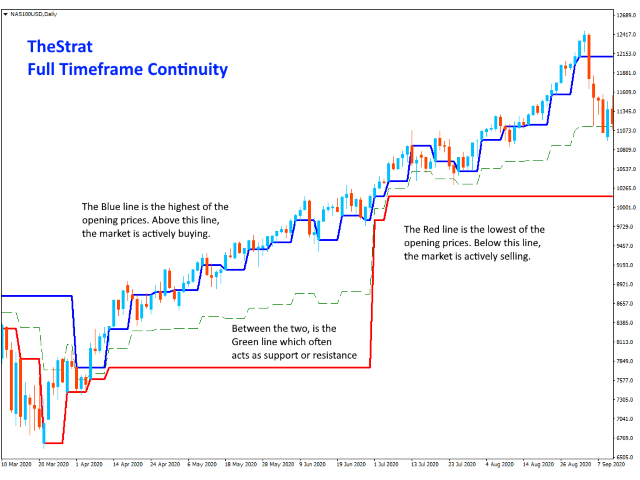
该指标在图表上绘制两条线,一条是季度、每月、每周、每日或每小时开盘水平的最高水平,第二条是这些值中最低的水平。这为您提供了一个高于或低于该通道的交易更有可能在一个方向上非常强劲。言外之意,价格走势将更加波动,您可以使用更宽的止损。
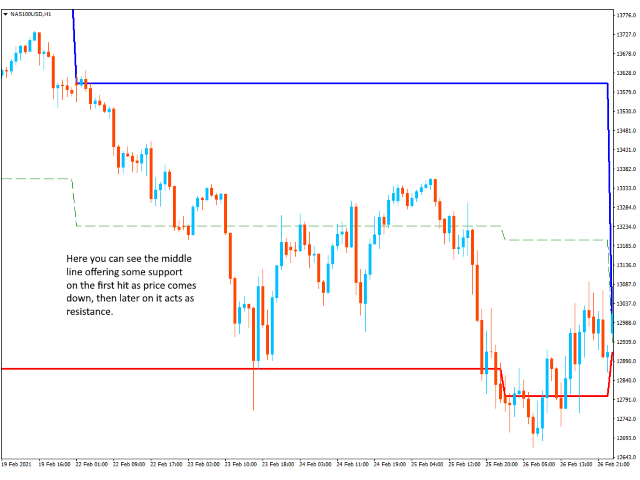
还绘制了第三条虚线以显示高点和低点之间的中点。当市场试图将价格推向某个方向时,这通常是寻找支撑或阻力的好地方。如果您通过将颜色设置为无来选择,则可以关闭此行。
设置
包括季度级别
允许您选择在计算中包括季度开盘价,因为有些人喜欢忽略它。
IncludeCurrentTimeframe打开
为真时,如果当前显示的时间范围是 H1、D1、W1 或 MN1,指标将在其计算中包括开放的时段。这是最新版本指标中的新设置。以前,计算不包括当前打开的时间段,这与 TheStrat 不一致。
该设置默认为 false,因此现有用户不受影响,除非他们选择打开它。
MaxMilliSecondsToCalculate
对于加载了大量历史记录(超过 10,000 条柱)的图表,这将限制指标必须初始化的时间量。默认情况下,设置为 1500 毫秒,即 1.5 秒。如果该指标在该时间段后未能对历史柱执行所有计算,它将停止尝试。这意味着您将始终获得重要的历史记录,但要保证它不会导致您的图表停止。