TheStrat FTFC
- Indicatori
- Robert Gerald Wood
- Versione: 1.2
- Aggiornato: 16 giugno 2021
- Attivazioni: 5
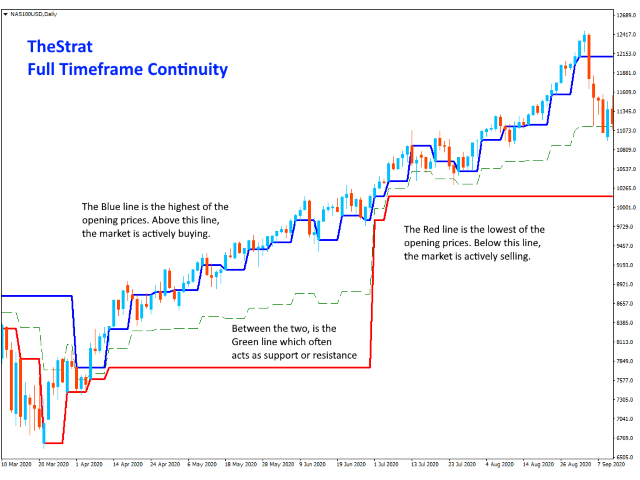
FTFC si riferisce alla Full Timeframe Continuity come definita da The Strat di Rob Smith.
Questo indicatore disegna due linee sul grafico, una delle più alte tra i livelli di apertura trimestrale, mensile, settimanale, giornaliera o oraria e la seconda tra i più bassi di questi valori. Questo ti dà un canale sopra o sotto il quale è più probabile che il trading sia molto fortemente in una direzione. Tra le righe, l'azione dei prezzi sarà più instabile e potresti utilizzare stop più ampi.
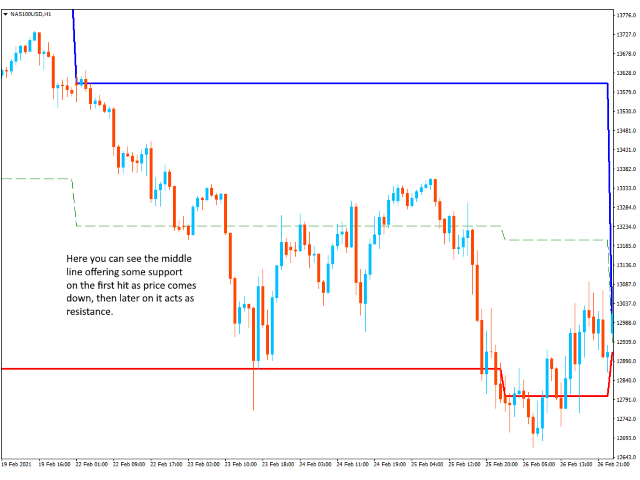
Viene inoltre tracciata una terza linea tratteggiata per mostrare il punto medio tra i massimi e i minimi. Questo è spesso un buon posto per trovare supporto o resistenza mentre il mercato cerca di spingere il prezzo in una certa direzione. Questa linea può essere disattivata impostando il colore su NONE.
IMPOSTAZIONI
IncludiLivelloTrimestrale
Consente di scegliere di includere il prezzo di apertura trimestrale nel calcolo poiché alcune persone preferiscono ignorarlo.
IncludeCurrentTimeframeOpen
Quando è vero, se l'intervallo di tempo attualmente visualizzato è H1, D1, W1 o MN1, l'indicatore includerà quei periodi aperti nel suo calcolo. Questa è una nuova impostazione nell'ultima versione dell'indicatore. In precedenza, il calcolo NON includeva il periodo di tempo corrente aperto e questo non concorda con TheStrat.
L'impostazione è false per impostazione predefinita, quindi gli utenti esistenti non sono interessati a meno che non scelgano di attivarla.
MaxMilliSecondsToCalculate
Per i grafici con molta cronologia caricata (oltre 10.000 barre), ciò limiterà il tempo necessario all'inizializzazione dell'indicatore. Per impostazione predefinita, l'impostazione è 1500 millisecondi, ovvero 1,5 secondi. Se l'indicatore non è riuscito a eseguire tutti i suoi calcoli per le barre storiche dopo quel periodo, smetterà di provare. Ciò significa che otterrai sempre una cronologia significativa, ma ti garantiamo che non causerà l'arresto del tuo grafico.