版本 7.2
2022.03.03
In version 7.2, we have some minor improvement on Price Breakout Pattern Scanner.
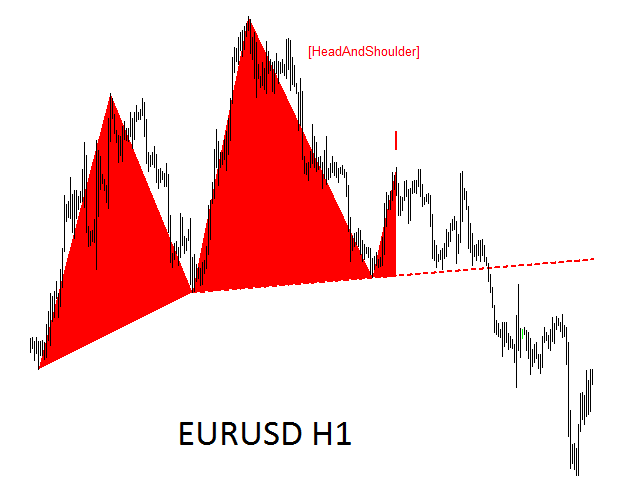
Head and Shoulder - Common tradable pattern.
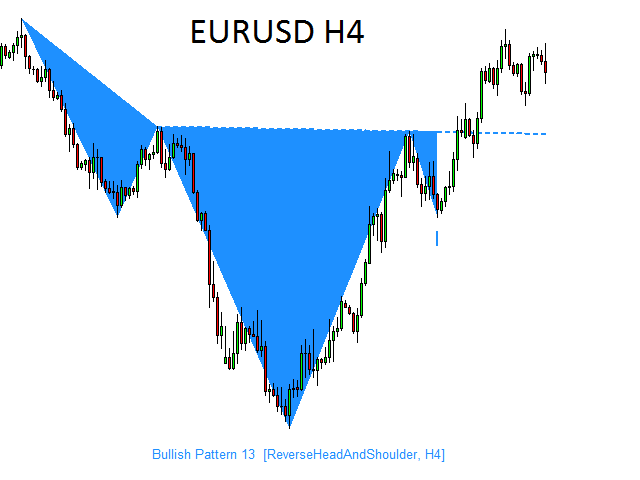
Reverse Head and Shoulder - This pattern is the reverse formation of the Head and Shoulder.
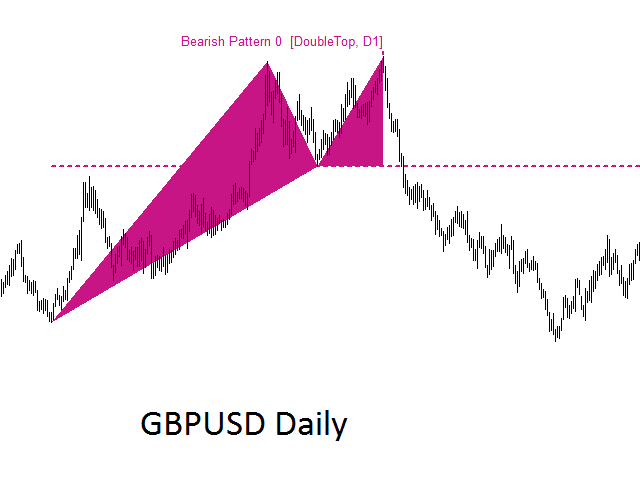
Double Top - When the price hits resistance level twice and decline toward the support level, the trader can anticipate sudden bearish breakout through the support level.
Double Bottom - The double bottom pattern is the reverse shape of the Double Top.
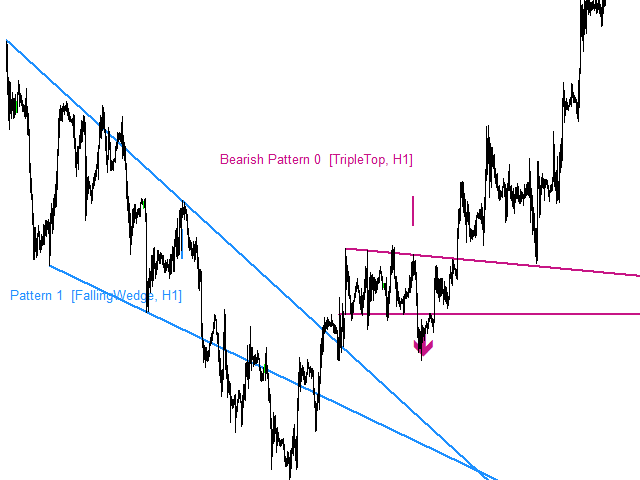
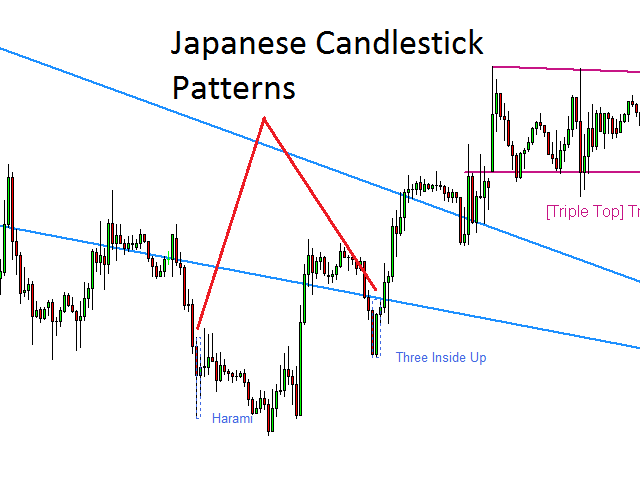
Triple Top - When the price hits resistance level three times and decline toward the support level, the trader can anticipate sudden bearish breakout through the support level.
Triple Bottom - The triple top pattern is the reverse pattern of the triple top.
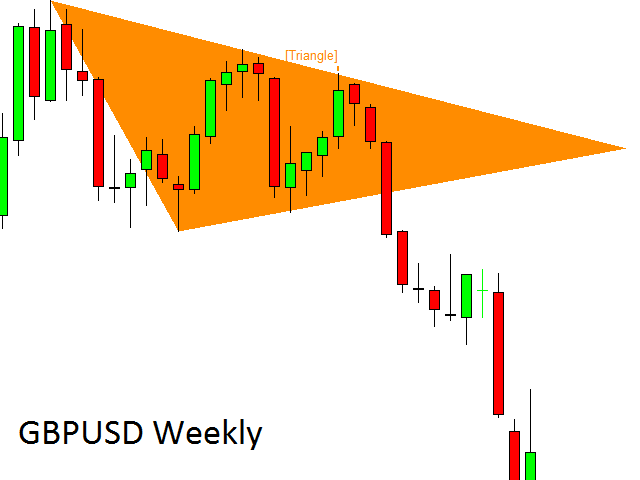
Triangle - Several different types of triangle pattern include symmetric Triangle, Ascending Triangle and Descending Triangle.
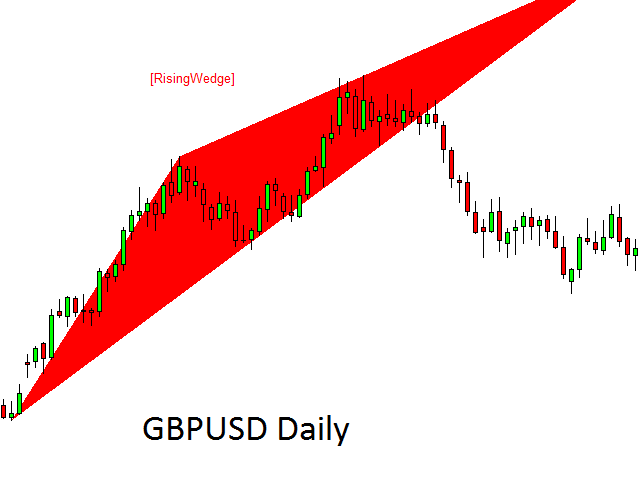
Rising wedge - This pattern is similar to triangle. However, their angle is stiffer than standard triangle.
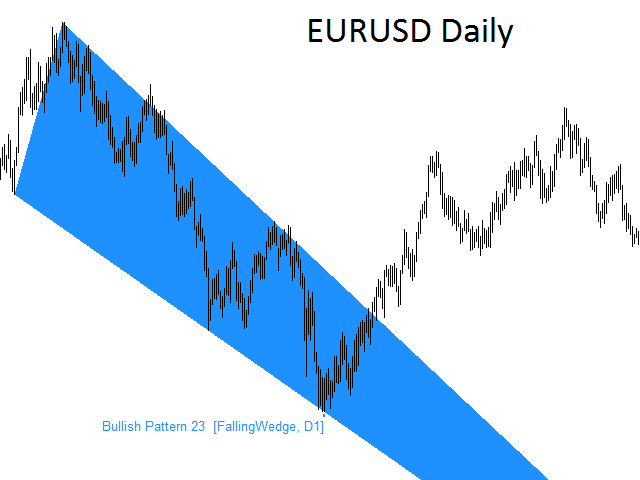
Falling wedge -This pattern has similar look to triangle too. However, their angle is stiffer than standard triangle.
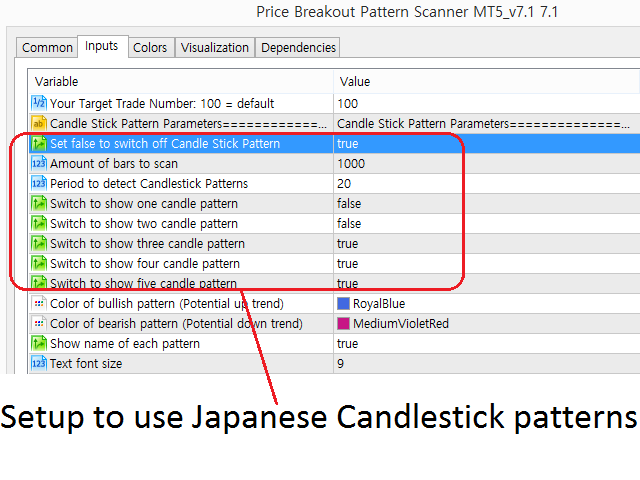
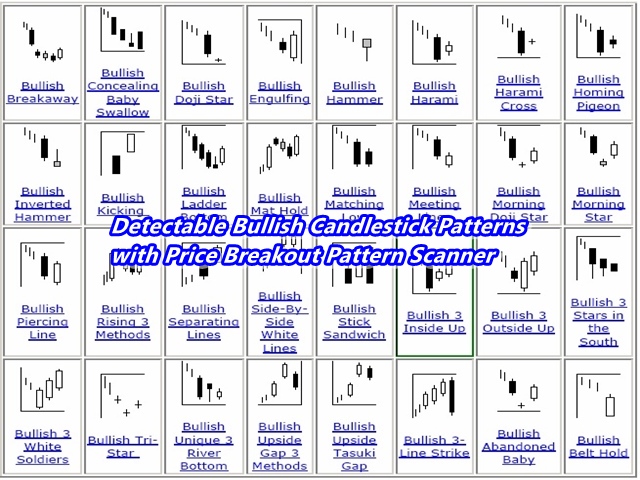
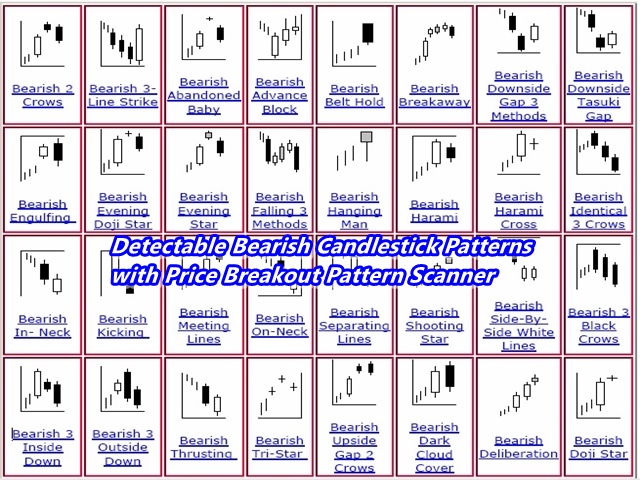
52 Candlestick patterns – the Price Breakout Pattern Scanner can detect 52 different bearish and bullish candlestick patterns include hanging man, shooting star, engulfing, doji, Harami, etc.
版本 7.1
2019.05.24
In version 7.1, Candle stick pattern name will be prinited as tooltip in your chart for easy readibility. Just move your mouse over the candle stick pattern.
In MetaTrader 4, tooltip is less responsive than MetaTrader 5. But you can just click the text and move your mouse over the object to see the tooltip (=name of candlestick pattern).
All just minor update though.
版本 7.0
2018.10.03
In version 7.0, user can enable alert, email and push notification for candlestick patterns.
版本 6.9
2018.03.08
In version 6.9, you can copy the lines from Smart Renko indicator window to main window automatically.
版本 6.8
2017.06.22
In Version 6.8, Now multiple pattern locking is allowed. This means that trader can lock as many pattern as he want in the chart. This feature not only protects traders from the repainting and redrawing issues of the classic Pattern trading but also trader can enhance his trading performance by incorporating multiple timeframe patterns analysis at ease.
版本 6.6
2016.09.15
In version 6.6, we have allowed buttons for each time frame usable when users apply the Price Breakout Pattern Scanner for multiple time frame in single chart. Features and functionality remaining the same as version 6.5.
版本 6.5
2016.09.05
In version 6.5, user can choose calculation timeframe for Price Breakout Pattern Scanner. This means that user can detect and display Patterns in multiple timeframe in single chart. For example, user can apply the Price Breakout Pattern Scanner four times with different time frame of calculation. For example, you can load Price Breakout Pattern Scanner for M15, H1, H4, D1 and W1 timeframe in one chart (note that this might be heavy for your computer). To make it bit lighter for your computer, you can load price breakout Pattern scanner for H1, H4 and D1 timeframe. As a results, user can have a convenient total geometric analysis in fully automatic manner. Most of features remains the same. As before, Pattern Button locks or unlocks the pattern of your interest. When you have the multiple Price Breakout Pattern Scanner loaded on your chart, the pattern button will lock all the patterns from each time frame. Likewise, Symbol button will recalculate all Price Breakout Pattern Scanner in your chart. However, you can only forward or backward play the patterns for one time frame only. Five more Price Breakout Pattern Scanner means that 5 more computation. Therefore, make sure that you know how much you are loading for your cpu and memory. Really looking forward to deliver this powerful feature to our customers.
版本 6.3
2016.07.28
We have implemented three new features succesfully for our tools.
Feature 1: Options to switch on and off each pattern type. With this option, you can switch off or switch on any pattern type as you wish. For example, you can turn off Bat pattern from Harmonic Pattern Plus. You can do the same for the price Breakout Pattern Scanner. For example, if you do not want to see Head and Shoulder pattern, then you can just switch it off. This feature is very intuitive. You just need to set the switch on or off in your Indicator Input settings.
Feature 2: Options to filter out small patterns. We will add “Pattern Size Filter” input. With this input, you can filter out small patterns and you can only trade with big patterns. You can use this feature in our Price Breakout Pattern Scanner too as well as with Harmonic Pattern Scenario Planner. Pattern Size Filter is simply done by counting number of candles inside patterns. So Make Pattern Size Filter large, then you will only see large patterns. If you want to see any patterns, then just set Pattern Size Filter = 0.
Feature 3 (only applied to Price Breakout Pattern Scanner): Just like in Harmonic Pattern Plus, you will be able to recalculate and research patterns in Price breakout Patten Scanner by pressing “Symbol” buttons.
版本 6.2
2016.06.22
In the version 6.2, You can draw round number at the background.
Set Round Number Spacing to zero if you don't want to see these round numbers from your chart.
版本 6.0
2016.06.09
Smart Renko version 6.0, Smart Renko can draw the brick the same level on your chart regardless of amount of historical bars and Meta Trader platforms. To do this, you need to choose the brick height which is the factor of 100 pip or factor of 1000 pips with Brick Height Mode = 0.
For example, you can use Brick Height (in pips) = 10, 20, 25, 50, 100, 200, 500, etc, as they are the fact of 100 or 1000 pips. As long as you are using these brick height, the brick will be drawn in the same level regardless of the amount of historical bars and your brokers. This is really good property as traders can develop strategy universally working across different platform.
This improved version of Smart Renko 6.0 is included in the new update for Price Breakout Pattern Scanner. Number of detected patterns can be different according to your brick height and now you can even find that pattern specially formed around psychological number (round number) if this is one of your preferred strategy.
版本 5.7
2016.05.23
In version 5.7, Price Breakout Pattern Scanner can detect pattern using Renko Brick calulation. This is equivalent to detect pattern over the dedicated Renko Chart (Imagine that you have opened Renko Chart and then put this indicator over the Renko Chart). So it is very powerful due to less noise in the Renko Chart. The good news is that you don't need a dedicated Renko Chart as this indicators does renko brick calculation at the background using Smart Renko Indicator.
At the same time, user can choose to detect pattern over normal candle stick too as before. To choose the detection mode, user can use the following variable.
Use Renko Filter for Pattern detection : true or false only
We have currently set the default as Renko Filter Mode.
(Important note, Renko can be calculated sub time frame. For example, Renko brick can be calculated using M5 or M15 time frame when you actually put this indicator on H1 chart. If the data is loaded, then there is not a problem. But sometime, data loading may be issue. But this is the issue present inside Meta Trader terminal. It might be fixed in the future. To avoid this issue, your default calculation time for Renko brick calculation is set to current time frame. But you can always change to experiment. In our experience, there can be small difference when you change the calculation time frame.)
版本 5.5
2016.04.29
In version 5.5, Now you can display Price Breakout Pattern as support and resistance mode.
This feature can help traders to identify important support and resistance for their trading.
To enable support and resistance mode, just set "Display As Support Resistance" = true
版本 5.3
2016.04.26
In version 5.3, Price Breakout Pattern Scanner can use most of the feature of Smart Renko.
版本 5.2
2016.04.12
In the version 5.2, if you set the ButtonTextSize = 0, then you can hide buttons from your chart. Really minor update. Probably, it will be useful in case of a small screen.
版本 5.1
2015.11.18
In version 5.1, minor update only. Graphical objects were drawn in background rather than foreground.
版本 3.9
2015.10.19
- Now users can hide buttons on their charts by clicking "BT" button on a chart.
- Minor updates.
版本 3.8
2015.08.20
In version 3.8, now user can select how many historical bars to scan to detect pattern.
Note that this feature is great so you can study How breakout patterns evolved through historcal data. This is very powerful feature. For example, you can learn how breakout patterns worked in 2005 and compare its appearance on 2015. You can apply this knowledge for your trading. Something like this can't be achieved by manual traders.
However, scanning more bars requires a lot more computation time. So please be careful in using this feature. Also maxium number of patterns indicators can search and store is 1000 patterns. So Know that there is some limitation too.
For average traders, 1500 bars (default setting) is more than fine.
Kind regards.
版本 3.7
2015.06.08
In the version 3.7, Price Breakout Pattern Scanner can call the partial functionality of Smart Renko indicators. However, use of Smart Renko indicator is optional and user can decide not to use this Smart Renko partial functionality (just use Price Breakout Pattern Scanner as in the previous version).
There are some differences between MT5 Price Breakout Pattern Scanner and MT4 Price Breakout Pattern Scanner in calling Smart Renko indicator internally.
MT5 Price Breakout Pattern scanner can call most of functionality of Smart Renko indicator whereas MT4 Price Breakout Pattern Scanner can only use some functionality of Smart Renko indicators. This is caused by the programming structure difference between MT4 and MT5 terminals (i.e. MT4 terminal does not use indicator handle yet). This is beyond my programming ability.
However, the partial functionality of MT4 Price Breakout Pattern Scanner can still offer much more clear entry and exit decisions for traders. This is even more true for MT5 Price Breakout Pattern Scanner.
To control the Smart Renko indicator from Price Breakout Pattern Scanner, users can control the following inputs from Price Breakout Pattern Scanner.
=========================== Input description ==========================
Brick Height Mode: choose between 0 and 1. Brick Height Mode 0 = User specified input for Brick height. Brick height Mode 1 = automatic calculation of Brick height using standard deviation and Z value.
Brick Height value: If Brick Height Mode is 0, this uses specified pip value for brick height. If Brick Height Mode is 1, this is Z value for the standard deviation. Sensible Z value can range from 0.5 to 4. However, mostly Z value of 1.0, 1.68 and 1.96 are used in the industry. If you are already familiar with Renko charting, then you should have some preferences in your brick height. In such a case, just use Brick Height Mode 0.
Bars to scan: Count bars in your current timeframe where indicator is attached. Bricks will be displayed on this bars.
Time Frame used for Brick Calculation: This is a sub-timeframe to be used for brick calculation. Note that Smart Renko uses sub-timeframe to calculate bricks and the bricks are displayed on the current timeframe.
Time Frame used to update Renko Chart: You can also choose different timeframe for updating your chart. If 'Time Frame used to update Renko Chart' = M1, then the chart is updated every 60 seconds.
版本 3.6
2015.04.28
In version 3.6, user can select any pattern to lock on his chart. Of course, user can unlock and delete the locked pattern. This locking and unlocking pattern is done by pressing "Pattern" button on the chart.
版本 3.5
2015.04.16
Fixed a bug occured when sending wrong timing in email and notification. This only happened in MT4 but not in MT5.
版本 3.3
2015.04.13
Version 3.3
1. Added Text Size variable for trade instruction: if Text Size for Trade instruction = 0, then the indicator does not display any instruction. The indicator will only display the name and shape of the patterns.
2. Added push notifications for sending messages to your mobile terminal.
3. Added ability to change button text size (Button Text Size variable).
版本 3.2
2015.03.19
In this version, Button has been redesigned for simpler looking.
版本 3.1
2015.02.11
In version 3.1, huge improvement was made for candlestick pattern detection algorithm by adding intensive statistical pattern matching algorithm.
版本 3.0
2015.01.05
In version 3.0, now you can select different symbols using buttons on charts. Users now need to open fewer charts and their trading operation become quicker.
版本 2.9
2014.11.07
Fixed bug from version 2.8, when user couldn't disable sound alert.
版本 2.8
2014.08.01
In previous version, "Button may already exist" text was printed when the terminal is restarted. In Version 2.8, this bug was fixed.


Best indicator I ever buy :)