CCI Dashboard for MT4
- 指标
- Taras Slobodyanik
- 版本: 3.70
- 更新: 19 四月 2024
- 激活: 10
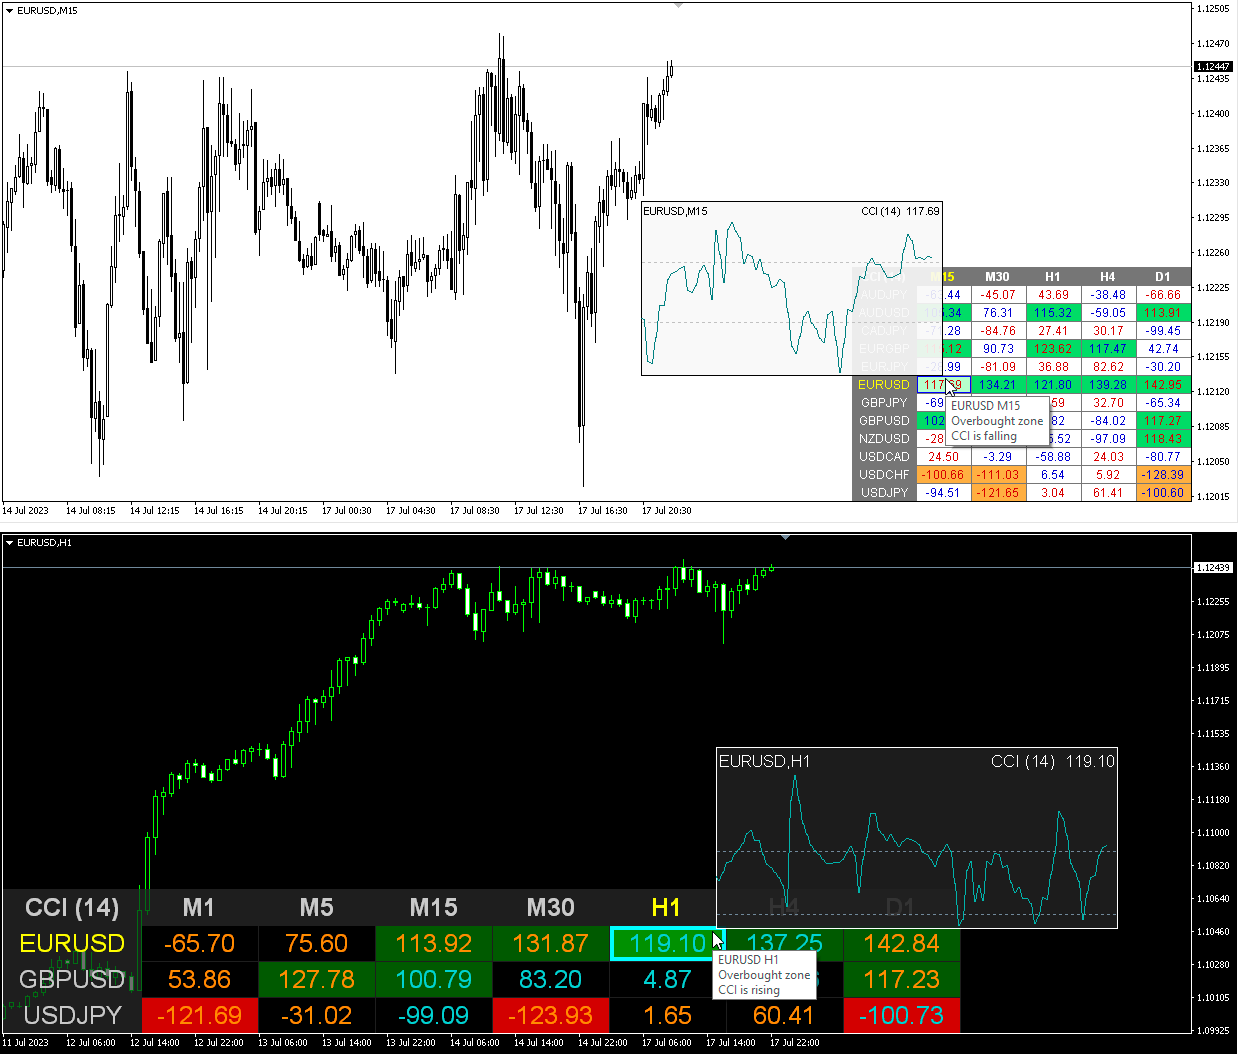
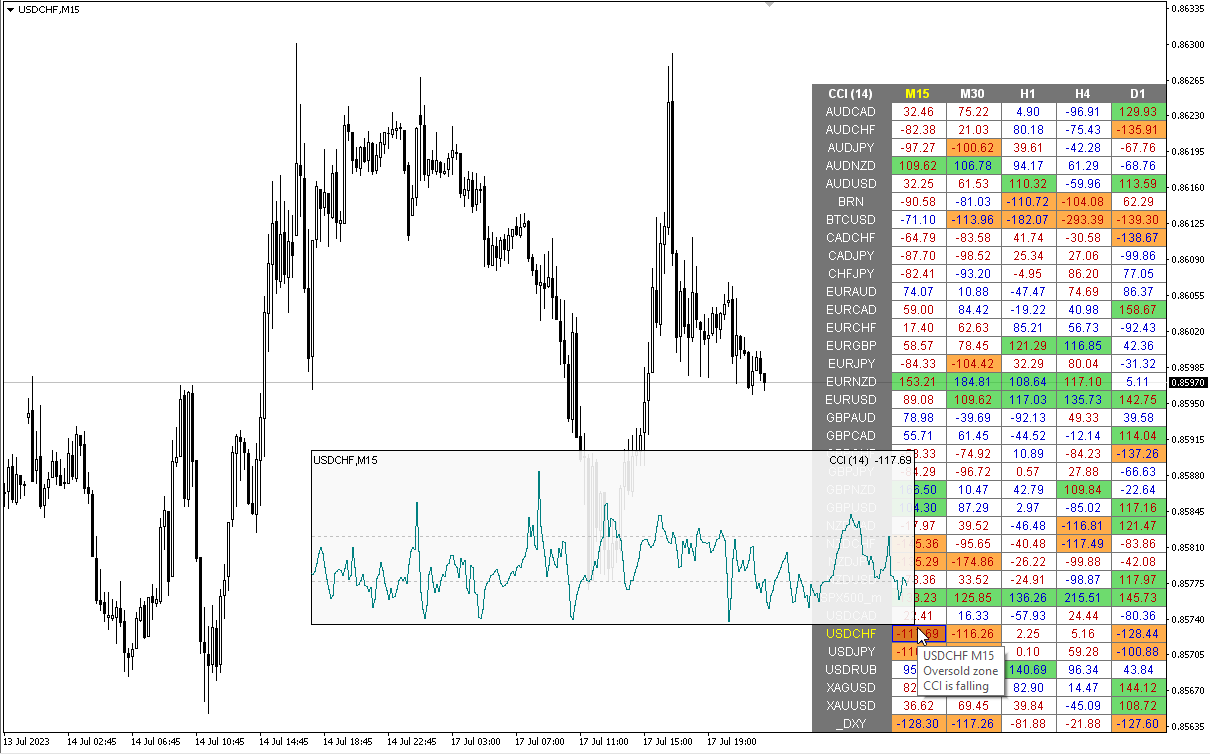
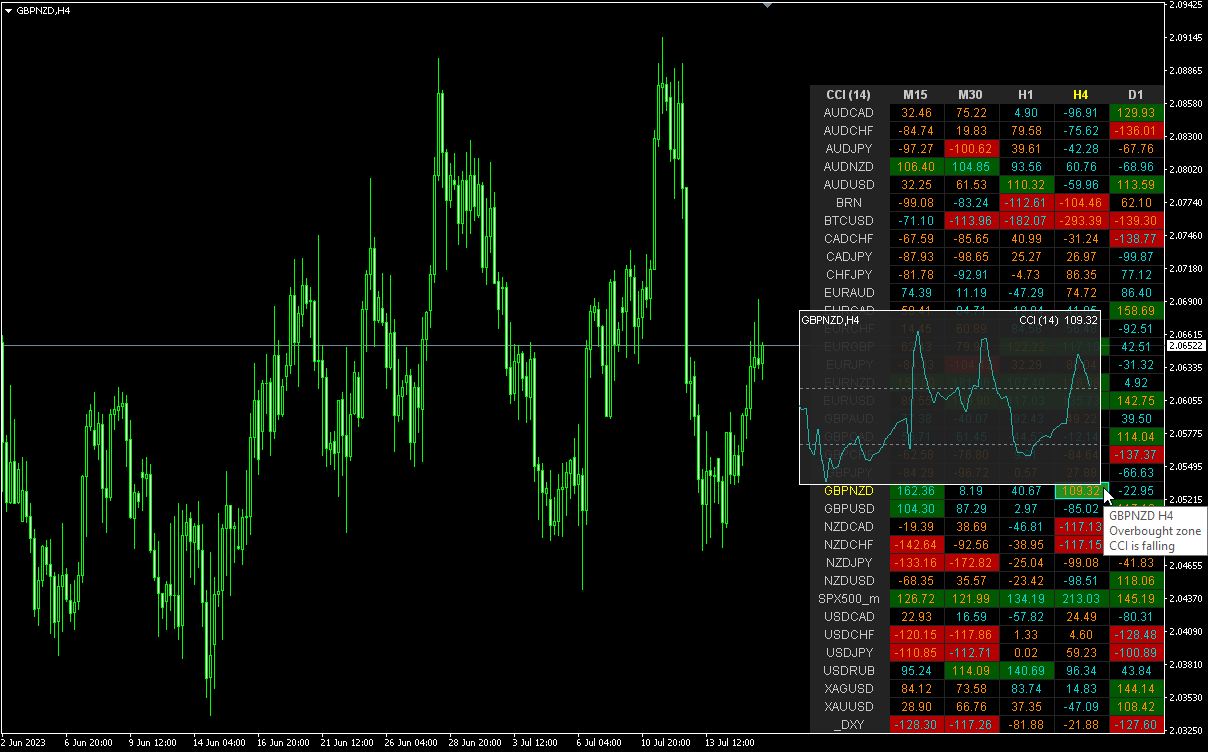
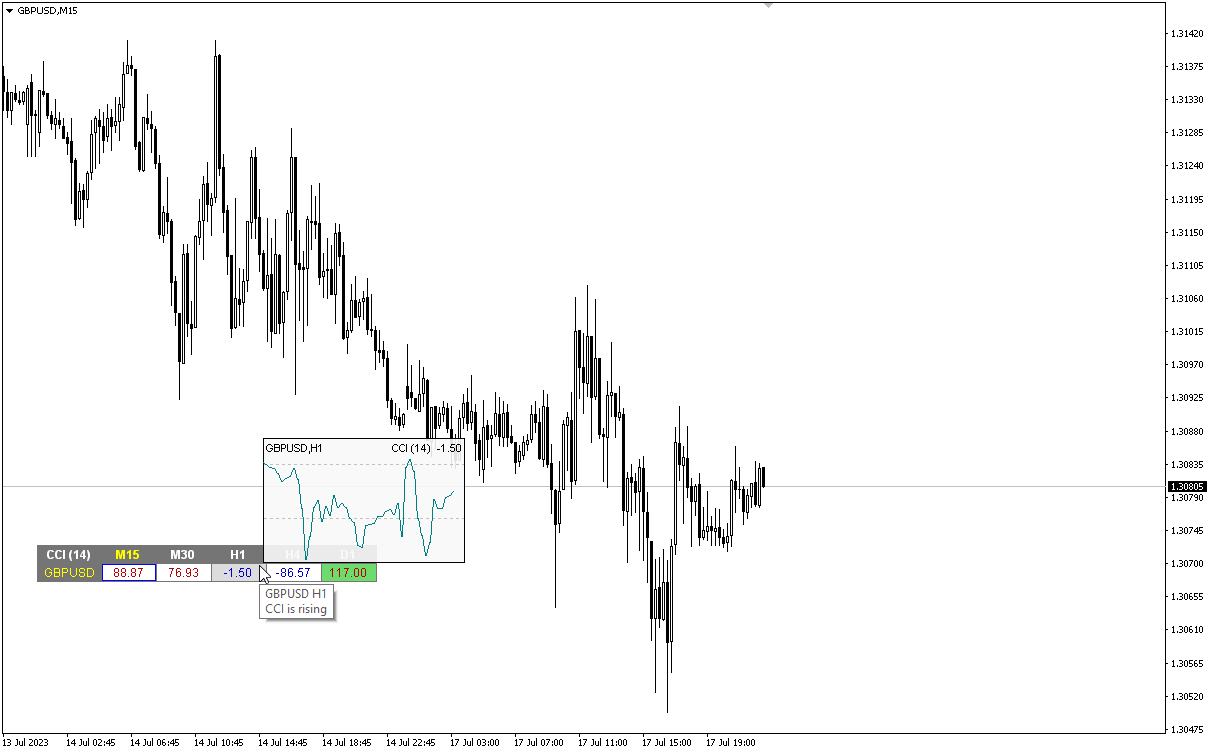
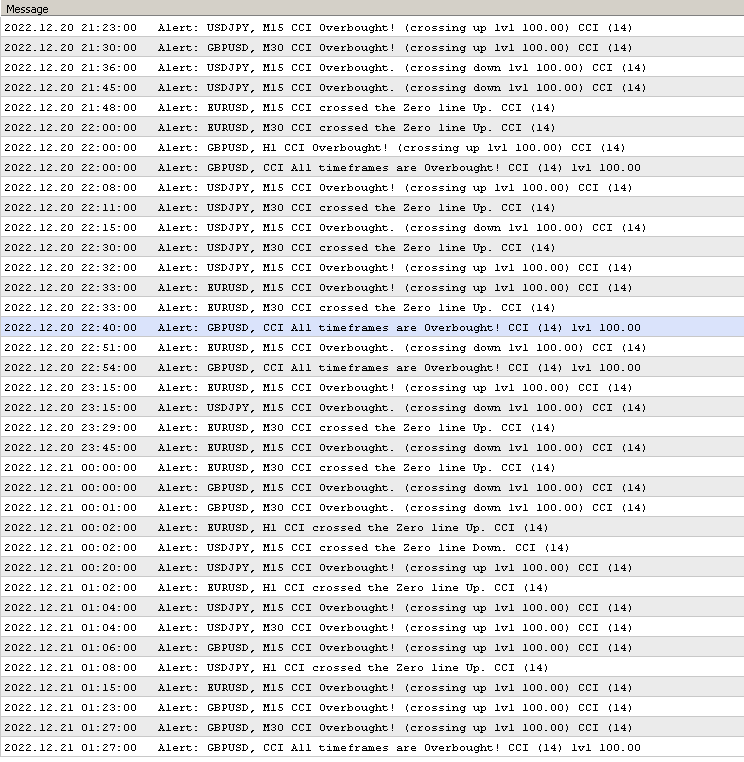
商品通道指数 (CCI) 指标的多货币和多时间框架修改。 您可以在参数中指定任何所需的货币和时间范围。 此外,该面板还可以在跨越超买和超卖水平时发送通知。 通过单击带有句点的单元格,将打开该符号和句点。 这是 MTF 扫描仪。
默认情况下,从图表中隐藏仪表板的键是“D”。
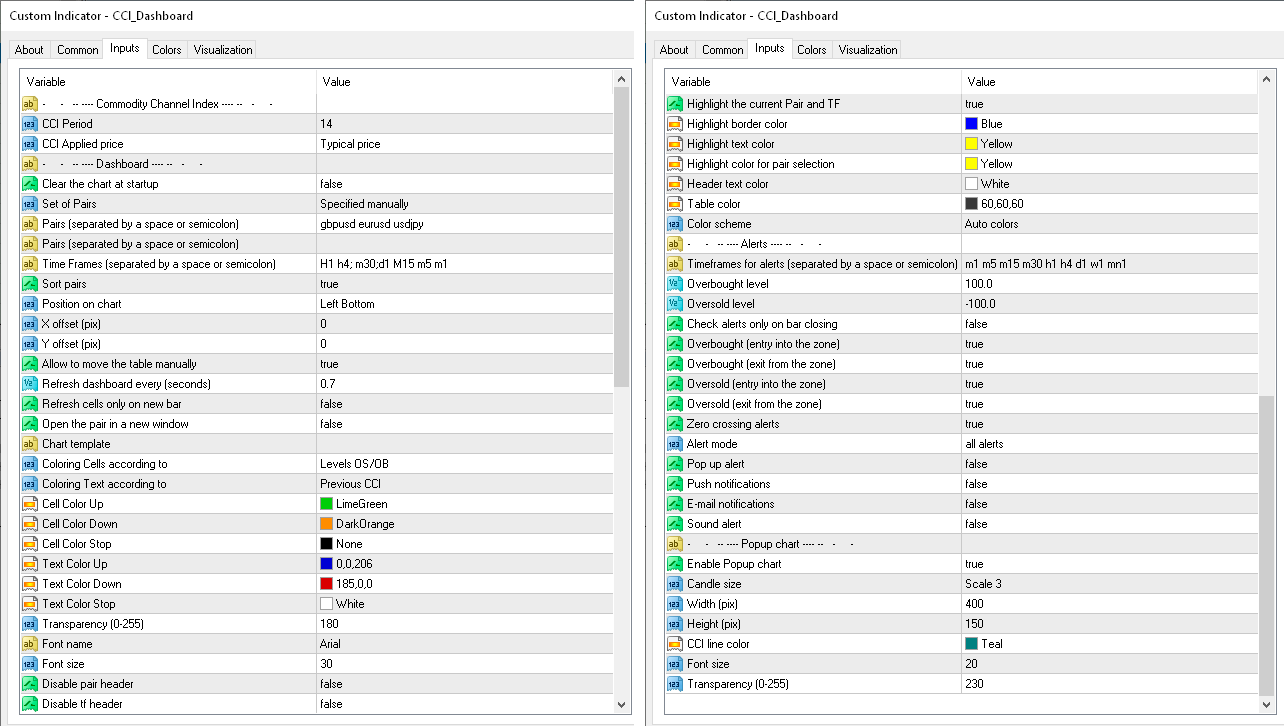
参数
CCI Period — 平均周期。
CCI Applied price — 价格类型。
Clear the chart at startup — 启动时清除图表。
Set of Pairs — 符号集
— Market Watch — 来自“市场观察”的货币对;— Specified manually — 在参数“Pairs”中手动指定对。— Current pair — 当前对。
Pairs (separated by a space or semicolon) — 由空格或分号分隔的符号列表。 货币名称的书写方式应与经纪商的名称完全相同,并保留大小写和前缀/后缀。
Time Frames (separated by a space or semicolon) — 由空格或分号分隔的时间范围列表(多个时间范围)。
Sort pairs — 对对列表进行排序。
Position on chart — 在图表上显示面板的角落。
X offset (pix) — 沿 X 轴移动面板。
Y offset (pix) — 沿 Y 轴移动面板。
Allow to move the table manually — 允许手动移动桌子。
Refresh dashboard every (seconds) — 所有货币对和时间范围的更新周期。
Open the pair in a new window — 通过单击在新图表窗口中打开交易品种。
Chart template — 图表模板的名称(如果图表在新窗口中打开)。
Coloring the cells according to the — 根蜡烛的方向为表格单元格着色。
Color Up — 如果指示器增加,则单元格颜色。
Color Down — 如果指标下降,则单元格颜色。
Color Stop — 如果指示器不改变,则单元格颜色。
Transparency (0-255) — 面板的透明度。
Font name — 字体名称。
Font size — 字体大小。
警报
Timeframes for alerts (separated by a space or semicolon) — 发送警报的时间段列表(以空格或分号分隔)。
Overbought level — 警报的超买水平。
Oversold level — 警报的超卖水平。
Check alerts only on bar closing — 仅在柱收盘后检查平交。
Enable overbought alerts — 启用超买警报。
Enable oversold alerts — 启用超卖警报。
Enable zero crossing alerts — 启用过零警报。
Alert mode — 警报模式
— separated by timeframes — 仅从各个 TF 发送警报。— combined in a row — 仅当所有 TF 都处于同一方向时才发送警报。— all alerts — 两种模式。
Pop up alert — 弹出警报。
Push notifications — 推送通知。
E-mail notifications — 电子邮件通知。
Sound alert — 声音警报。
弹出图表
Enable Popup chart — 启用弹出图表
Candle size — 蜡烛尺寸
Width (pix) — 宽度(像素)
Height (pix) — 高度(像素)
Font size — 字体大小
Transparency (0-255) — 透明度(0-255)

Лучшие продукты на маркете! Лучшая поддержка от разработчика!