ZigZag Lines MTF for MT5
- 指标
- Taras Slobodyanik
- 版本: 5.7
- 更新: 20 五月 2024
- 激活: 10
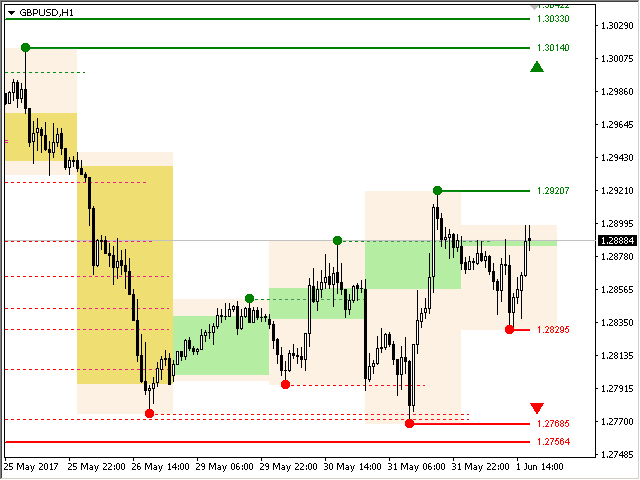
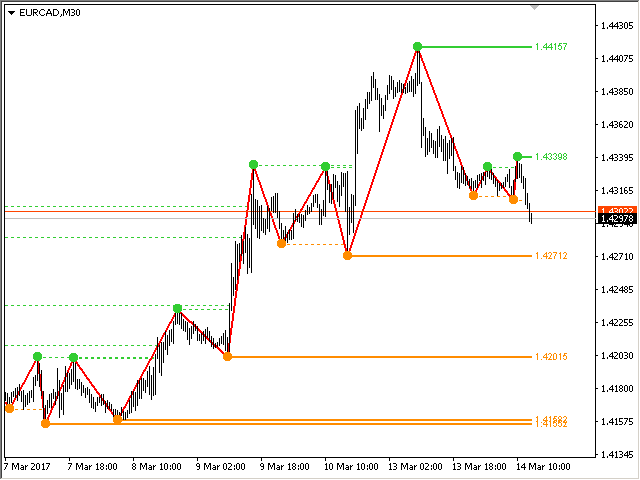
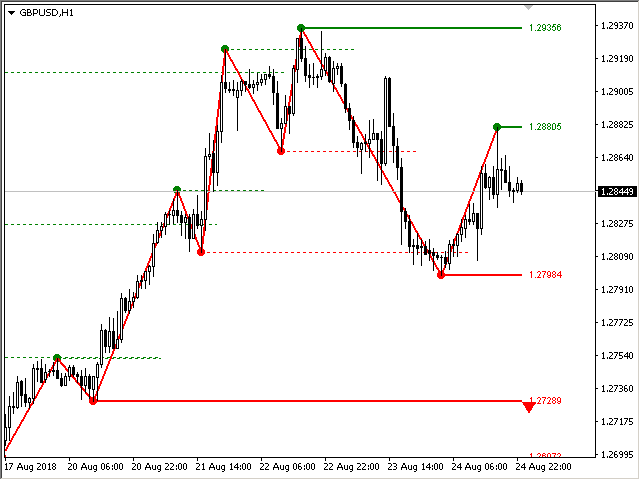
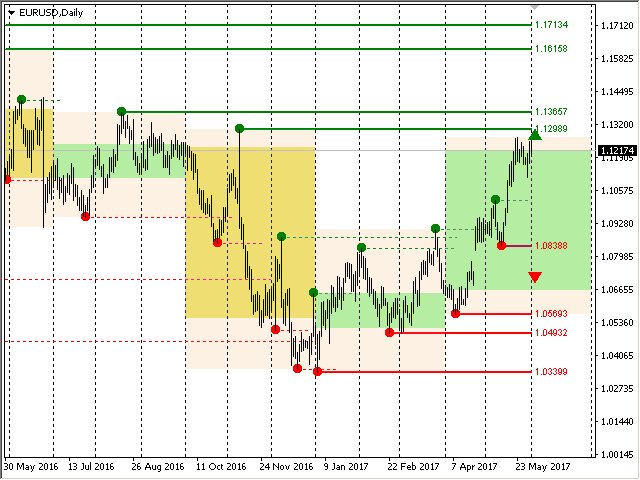
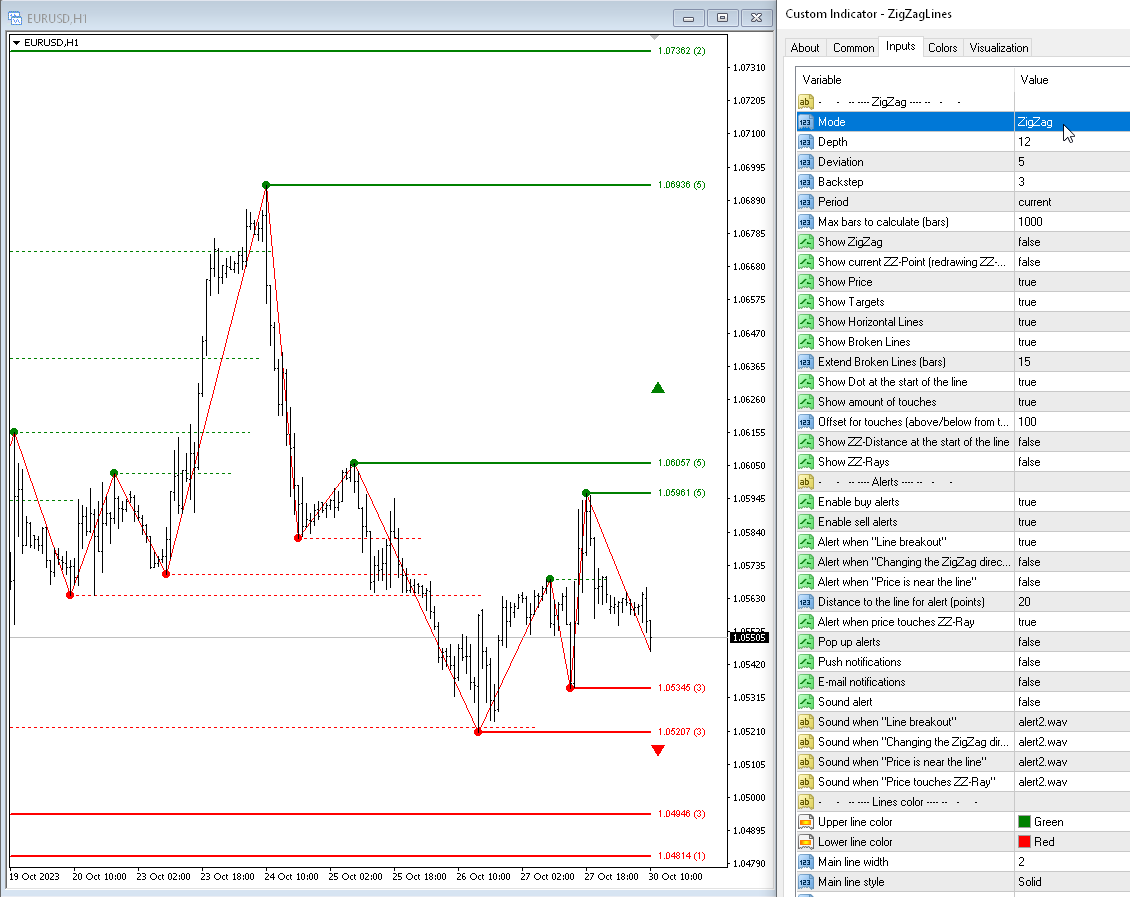
多时间框架锯齿形调整浪指标。 它显示支撑/阻力水平线及其突破,并绘制当前的市场目标。 它还可以显示分形指标的线条和其他时期(最多季度)的蜡烛。
该指标重新绘制最后一个(当前)点,并且在某些情况下可以更改最后 2-3 个点。
所有线条均绘制为对象(不是指标缓冲区,但有可能接收 EA 的数据)。
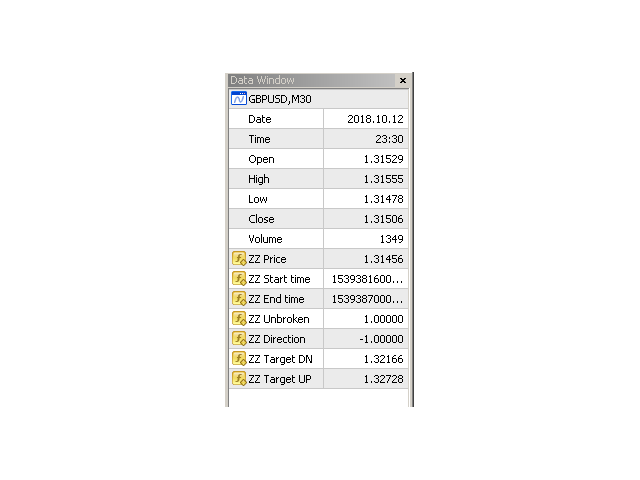
在 Expert Advisor 中使用时,您可以使用 iCustom 读取 ZigZag 点。
设置
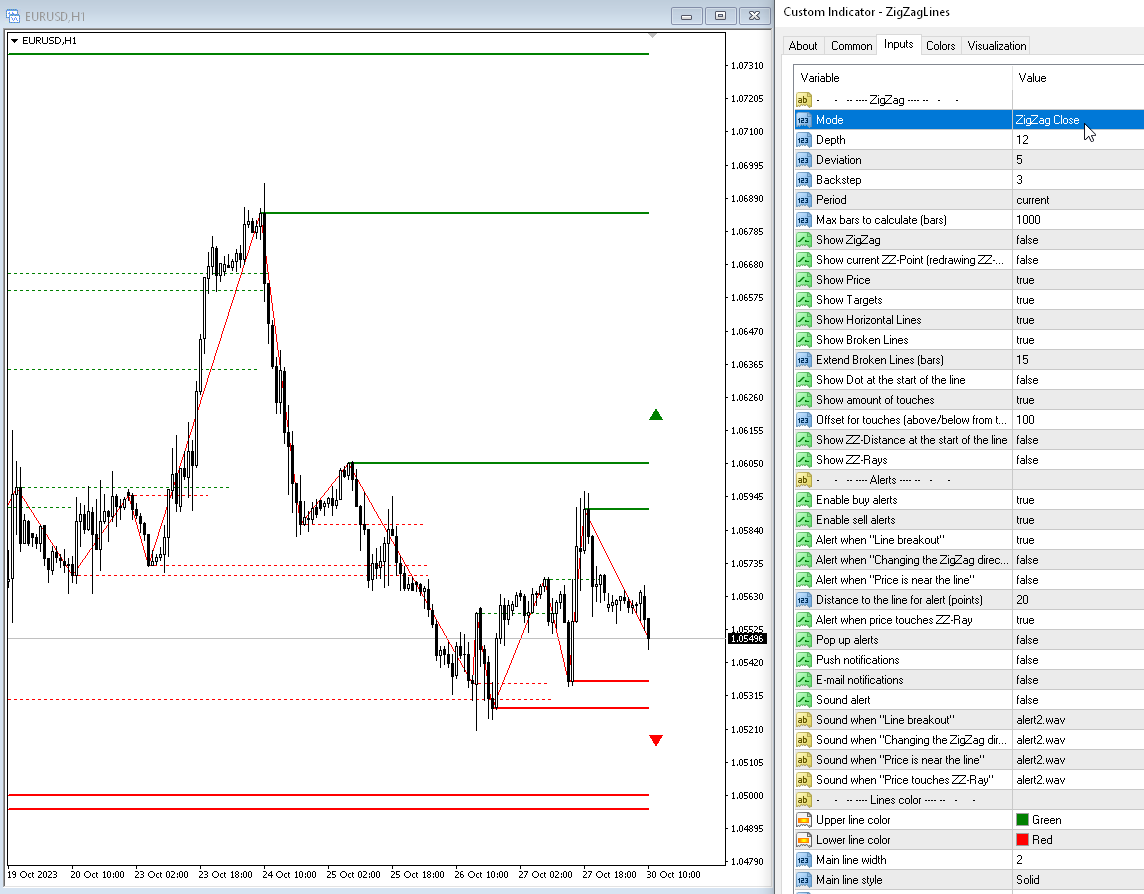
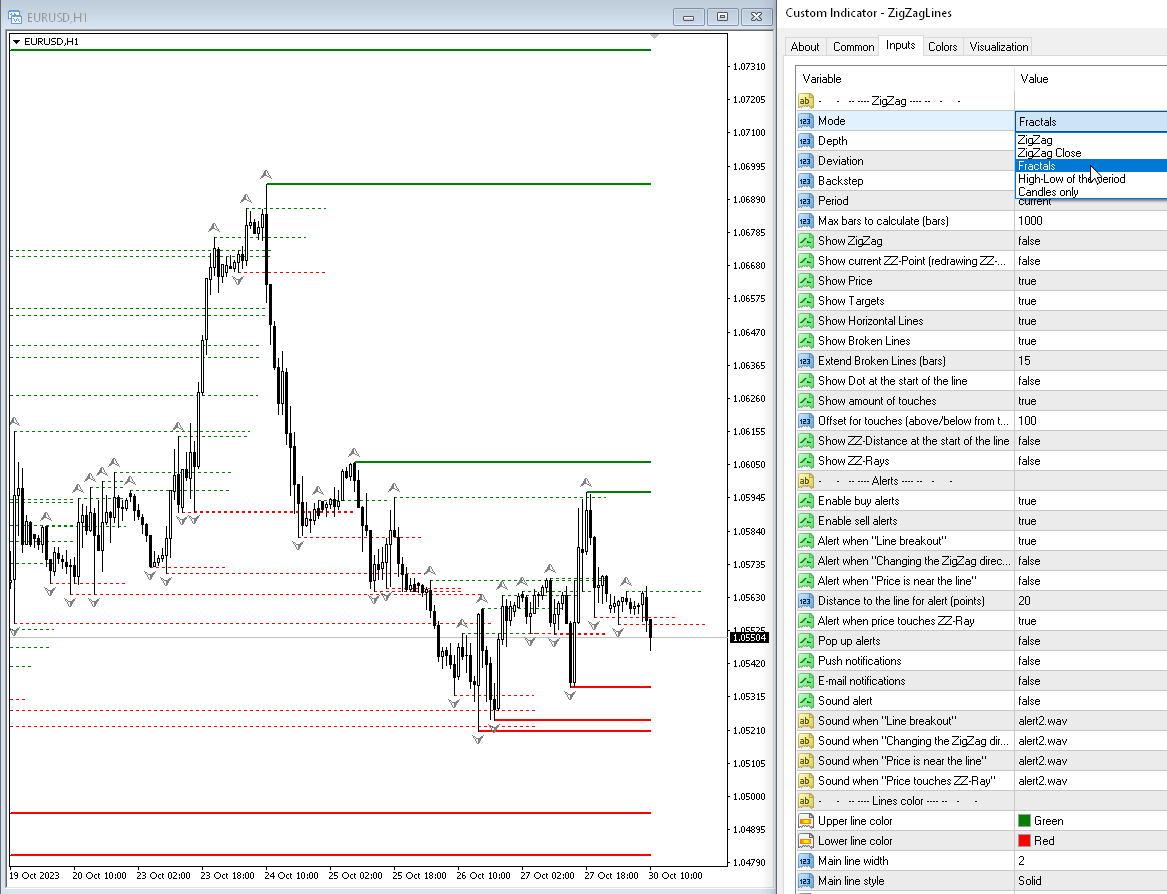
Mode — 根据以下因素绘制支撑位和阻力位:
— Zig Zag — ZigZag 指标;— ZigZag Close — 之字折线收盘指标;— Fractals — 分形指标;— High-Low of the period — 通过高低水平构建指标。 时间范围在Period参数中指定;— Candles only — 仅绘制蜡烛;
Depth — 如果最后一根蜡烛的偏差小于(或大于)前一根,则 Zigzag 将不会绘制第二个最大值(或最小值)的烛台的最小数量;
Deviation — 锯齿形形成局部顶部/底部的两个相邻烛台的最高点/最低点之间的最小点数;
Backstep — 局部高点/低点之间的最小烛台数量;
Period — 分形锯齿形调整浪的计算周期;
Max bars to calculate (bars) — 用于计算的最大柱数。 引入这个限制是为了加快计算速度;
显示在图表上
Show Zigzag — 显示之字折线;
Show current ZZ-point (redrawing point) — 显示当前(最后一个)点;
Show Price — 显示级别的价格;
Show Targets — 显示当前目标(市场走向);
Show broken lines) — 显示断线级别;
Check the breakout of the Lines by price — 按价格检查线的突破:
- High-Low (current bar) — 低(当前柱)
- High-Low (previous bar) — 低(前一栏)
- Close (previous bar) — 关闭(上一栏)
- Open (current bar) — 开盘(当前柱)
Extend broken lines (bars) — 将折线向右延伸指定的条数;
Show Dot at the start of the line — 在指标的转折点显示点;
Show amount of touches — 显示线价附近的触碰次数;
Offset for touches (above/below from the ZZ-point, points) — ZZ 点被视为接触水平面的范围。
警报
Pop up alerts — 触摸关卡时弹出警报;
Push notifications — 推送通知;
E-mail notifications — 通过电子邮件通知;
Sound alert — 触摸关卡时发出声音警报;
Alert when "Line breakout" — 当 ZigZag 水平被突破时发出警报;
Alert when "Changing the ZigZag direction" — 改变 ZigZag 方向时发出警报;
Alert when "Price is near the line" — 如果价格接近该水平则发出警报(一旦出现一根柱,则不会检查锯齿形调整浪的当前点);
Distance to the line for alert (points) — 警报距离(以点为单位);
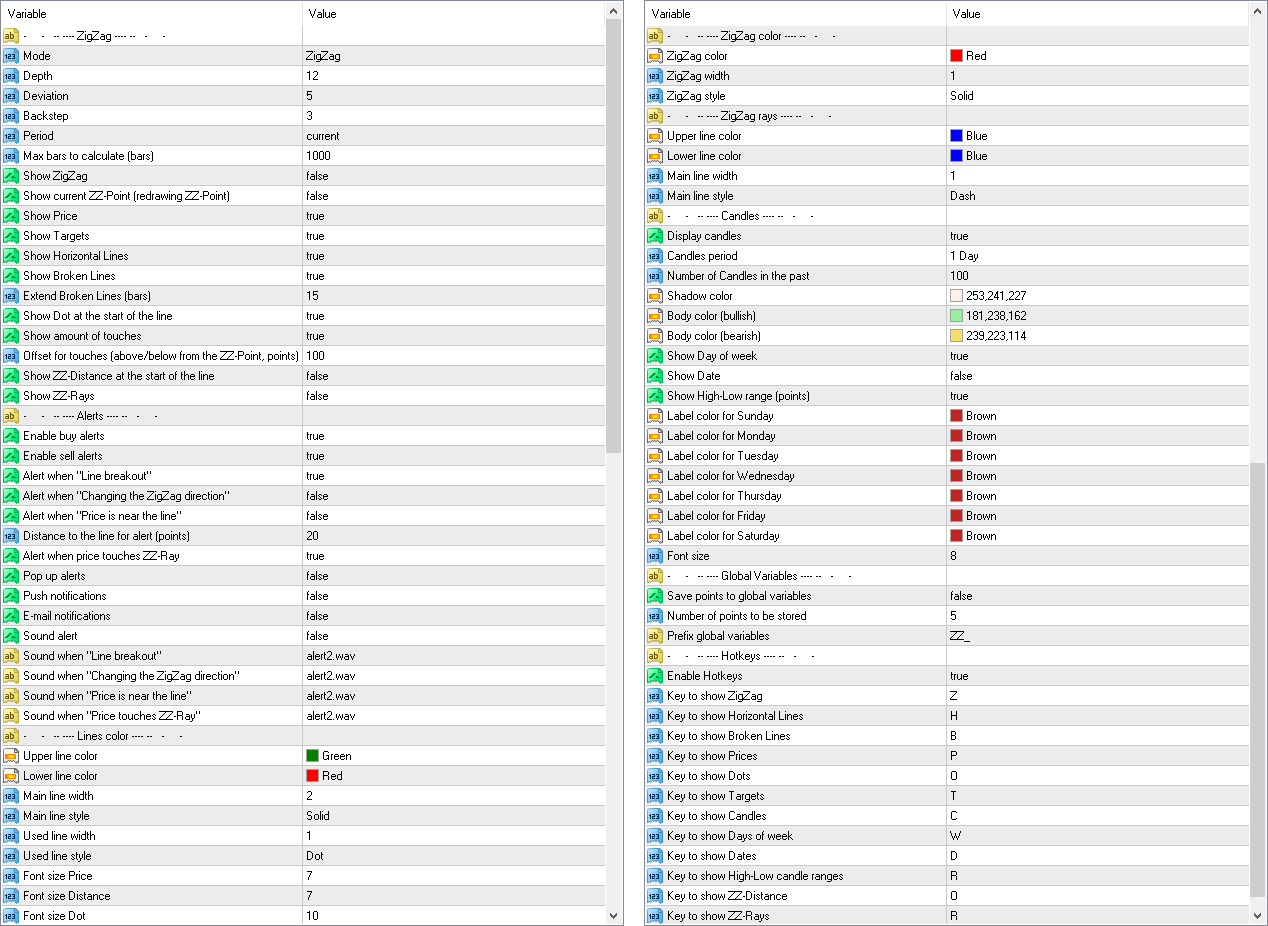
颜色
Upper line color — 上线的颜色;
Lower line color — 下线的颜色;
Main line width — 主线的宽度;
Main line style — 主线的样式;
Used line width — 使用的线的宽度;
Used line style — 使用的线条的样式;
Font size price — 价格的字体大小;
Font size dot — 点的字体大小;
ZigZag color — ZigZag 的颜色;
ZigZag width — ZigZag 线的宽度;
ZigZag style — ZigZag 线的样式;
蜡烛
Display candles — 启用显示其他时期的蜡烛;
Candles period — 蜡烛周期,所有标准蜡烛周期加上季度;
Number of Candles in the past — 图表上的蜡烛数量;
Shadow color — 烛芯的蜡烛;
Body color (bullish) — 看涨蜡烛的主体蜡烛;
Body color (bearish) — 看跌蜡烛的主体颜色;
Save points to global variables — 将点存储在终端的全局变量中;
Number of points to be stored — 要存储的点数(当前点为零);
Prefix global variables — 全局变量名称的前缀。


I highly recommend this indicator, it is very well developed!