Multi Indicator Heat Map MT4
- 指标
- 版本: 1.0
- 激活: 5

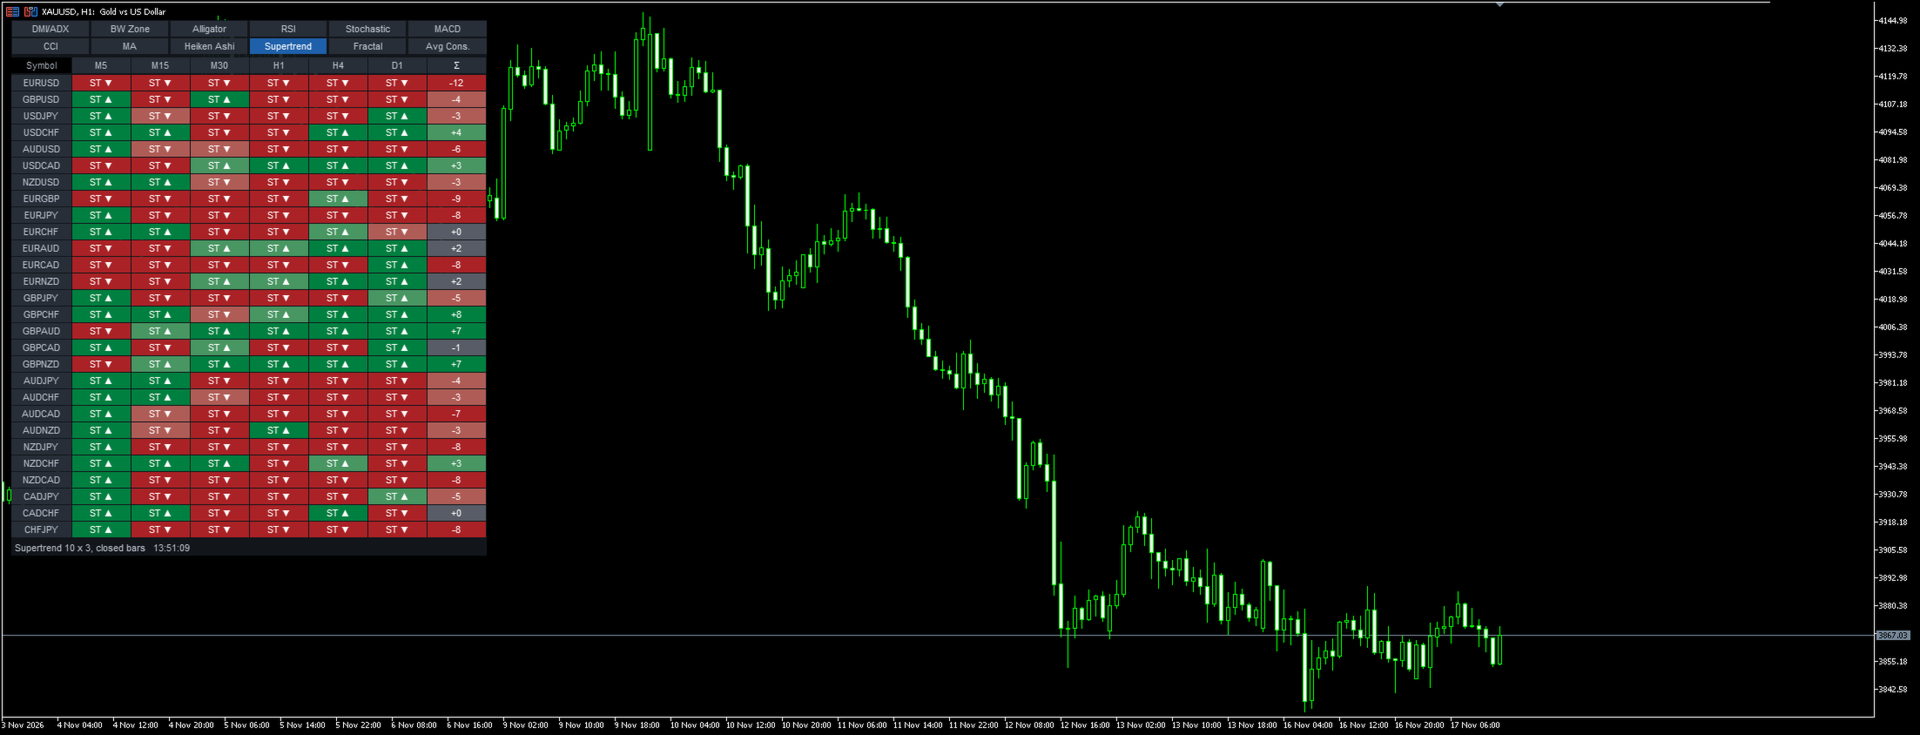
One panel, 28 pairs, 6 timeframes, 12 indicators: a colour-coded heat map of trend and momentum states. Click a cell to open that chart.
Description
Multi Indicator Heat Map shows how one indicator reads across many symbols and timeframes at the same time. Each row is a symbol, each column a timeframe, and every cell is coloured on a five-step scale: strong up, weak up, neutral, weak down, strong down. A sum column adds the timeframes together for each symbol.
You choose the indicator on the panel itself. Click one of the twelve buttons at the top and the grid is recalculated; there is no need to open the settings.
The twelve indicators and their rules Every cell uses the last closed bar of its timeframe (optionally the current bar). The cell text shows the main value, for example "ADX 32 ▲" or "RSI 63".
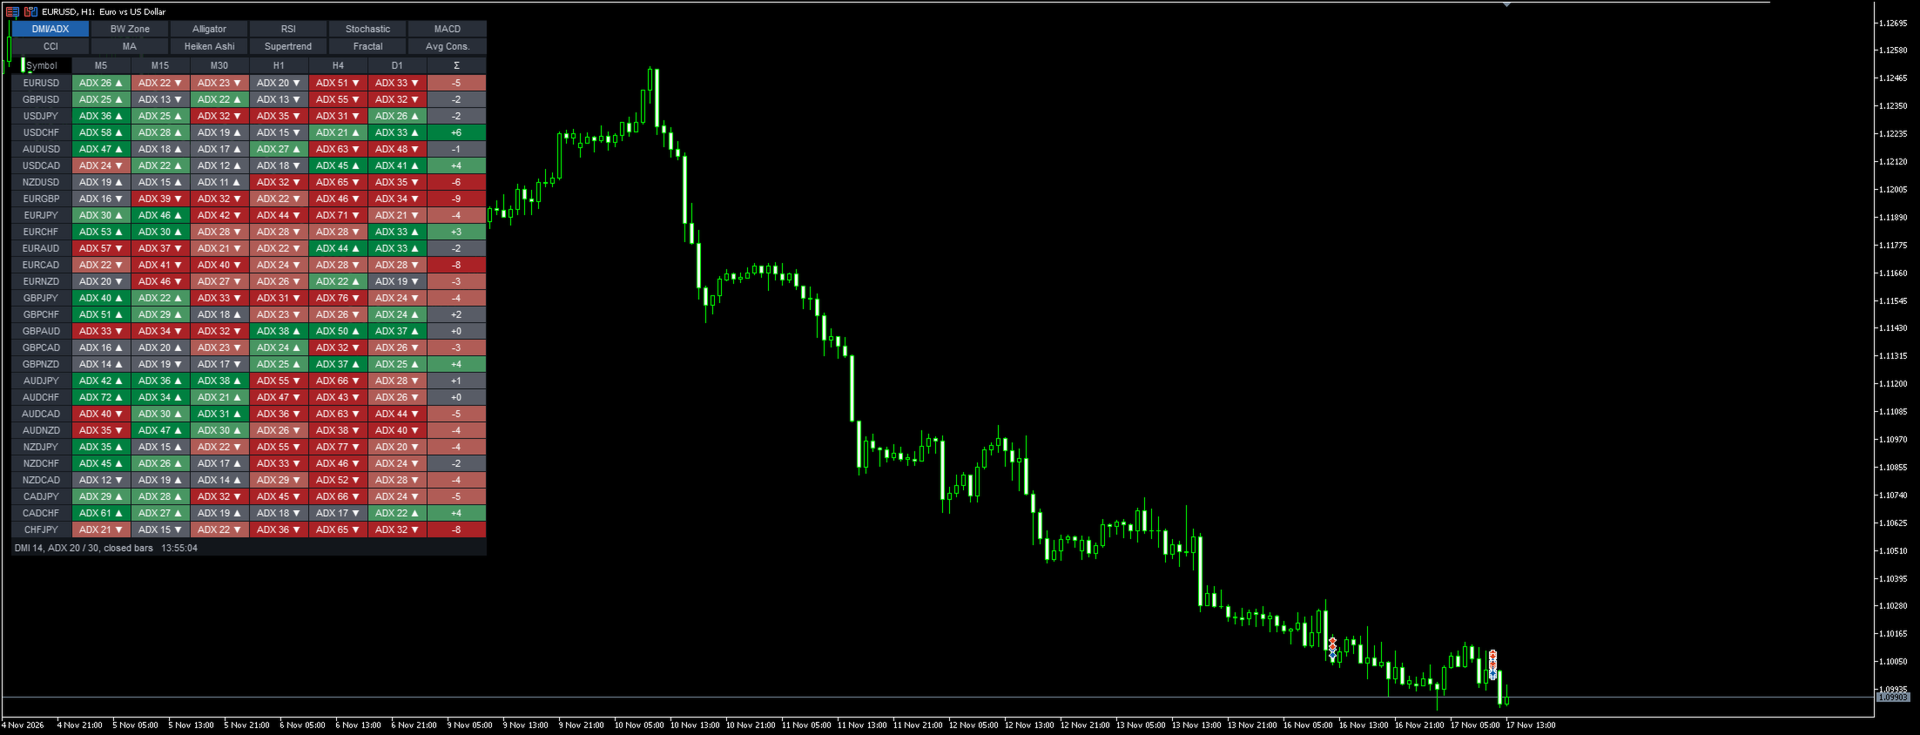
- DMI / ADX (14). Direction from +DI against -DI. ADX below 20: neutral. ADX 20 to 30: weak. ADX 30 or more: strong.
- Bill Williams zone (AO + AC). Green zone when AO and AC both rose on the bar, red when both fell, grey otherwise. Green with AO above zero is strong up, green with AO below zero is weak up (mirrored for red). Grey is neutral.
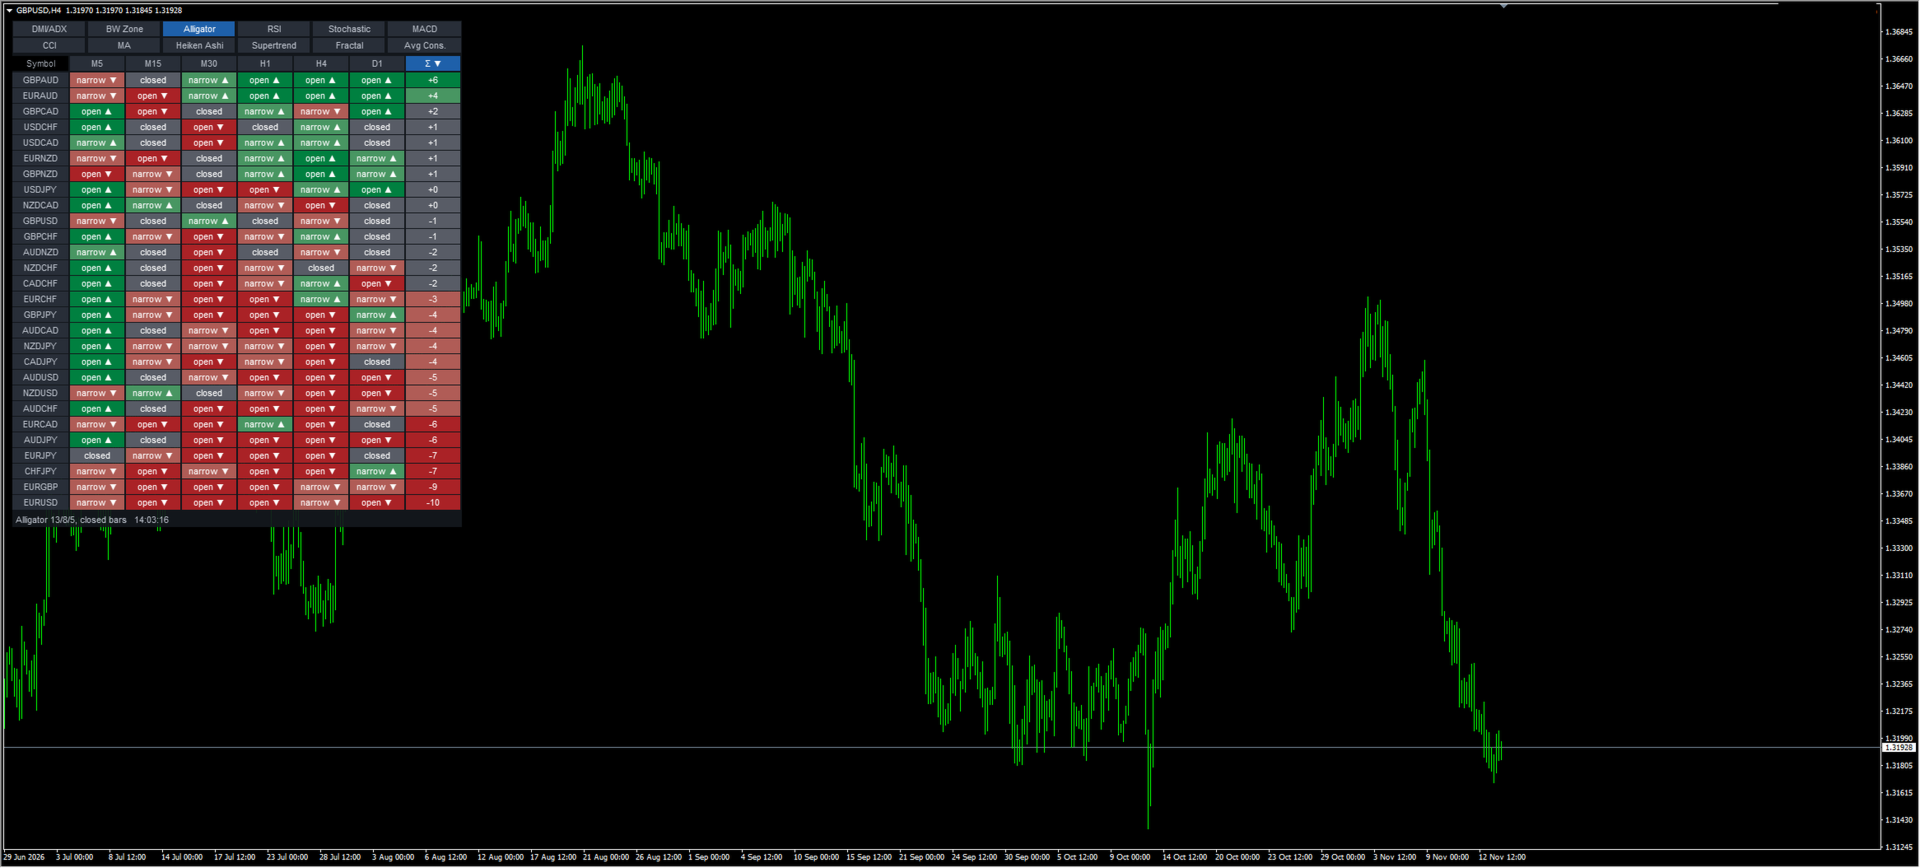
- Alligator (13/8, 8/5, 5/3, median price). Lips above Teeth above Jaw: up; the reverse: down; lines mixed: closed (neutral). Strong while the mouth is opening wider than on the bar before, weak while it narrows.
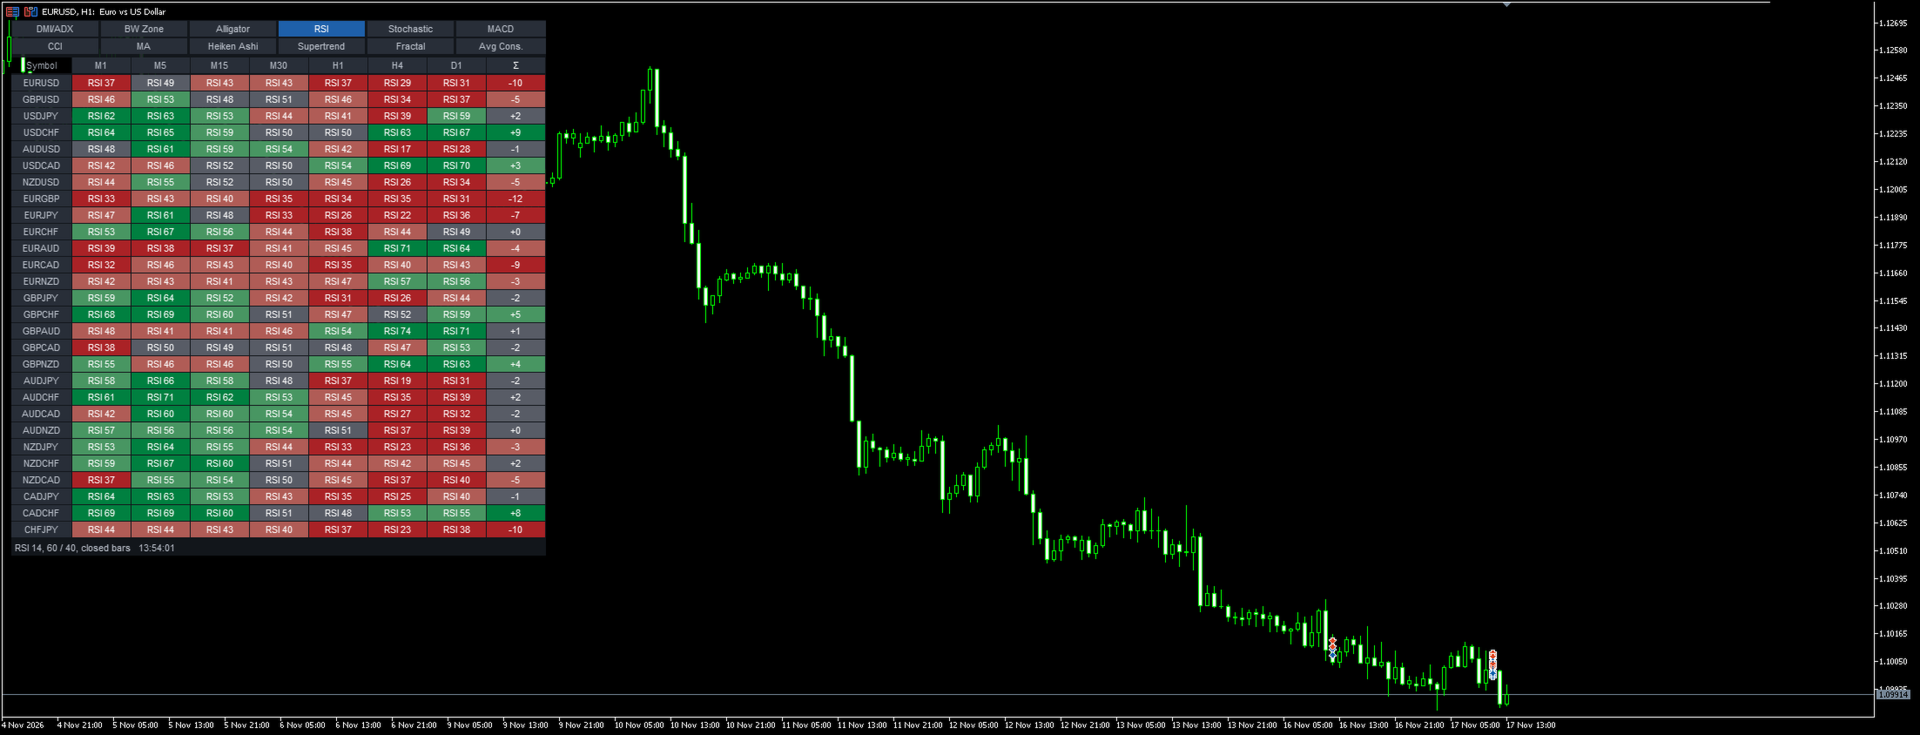
- RSI (14). 60 or more: strong up. Above 52: weak up. 40 or less: strong down. Below 48: weak down. 48 to 52: neutral. Levels adjustable.
- Stochastic (5, 3, 3). Direction from %K against %D. Strong when %K is on the same side of 50 as the direction, weak otherwise.
- MACD (12, 26, 9). Direction from the main line against the signal line. Strong when the main line is on the same side of zero, weak otherwise.
- CCI (14). +100 or more: strong up. Above 0: weak up. Mirrored below zero.
- Moving average (EMA 50). Slope: the MA now against 5 bars ago. Rising MA with the close above it: strong up; falling MA with the close below: strong down. When slope and close disagree, the cell is weak in the direction of the close.
- Heiken Ashi. Colour of the Heiken Ashi candle. Strong when the candle has no wick on the opposite side (no lower wick on a rising candle), weak otherwise.
- Supertrend (ATR 10 x 3). Side of the Supertrend line. Strong when the close is more than one ATR away from the line, weak when it is closer.
- Fractal trend (size 2, adjustable). The trend of the Advanced Fractal indicator: up after a close above the last up fractal, down after a close below the last down fractal. Strong while the close stays beyond the broken fractal level, weak when it has fallen back inside.
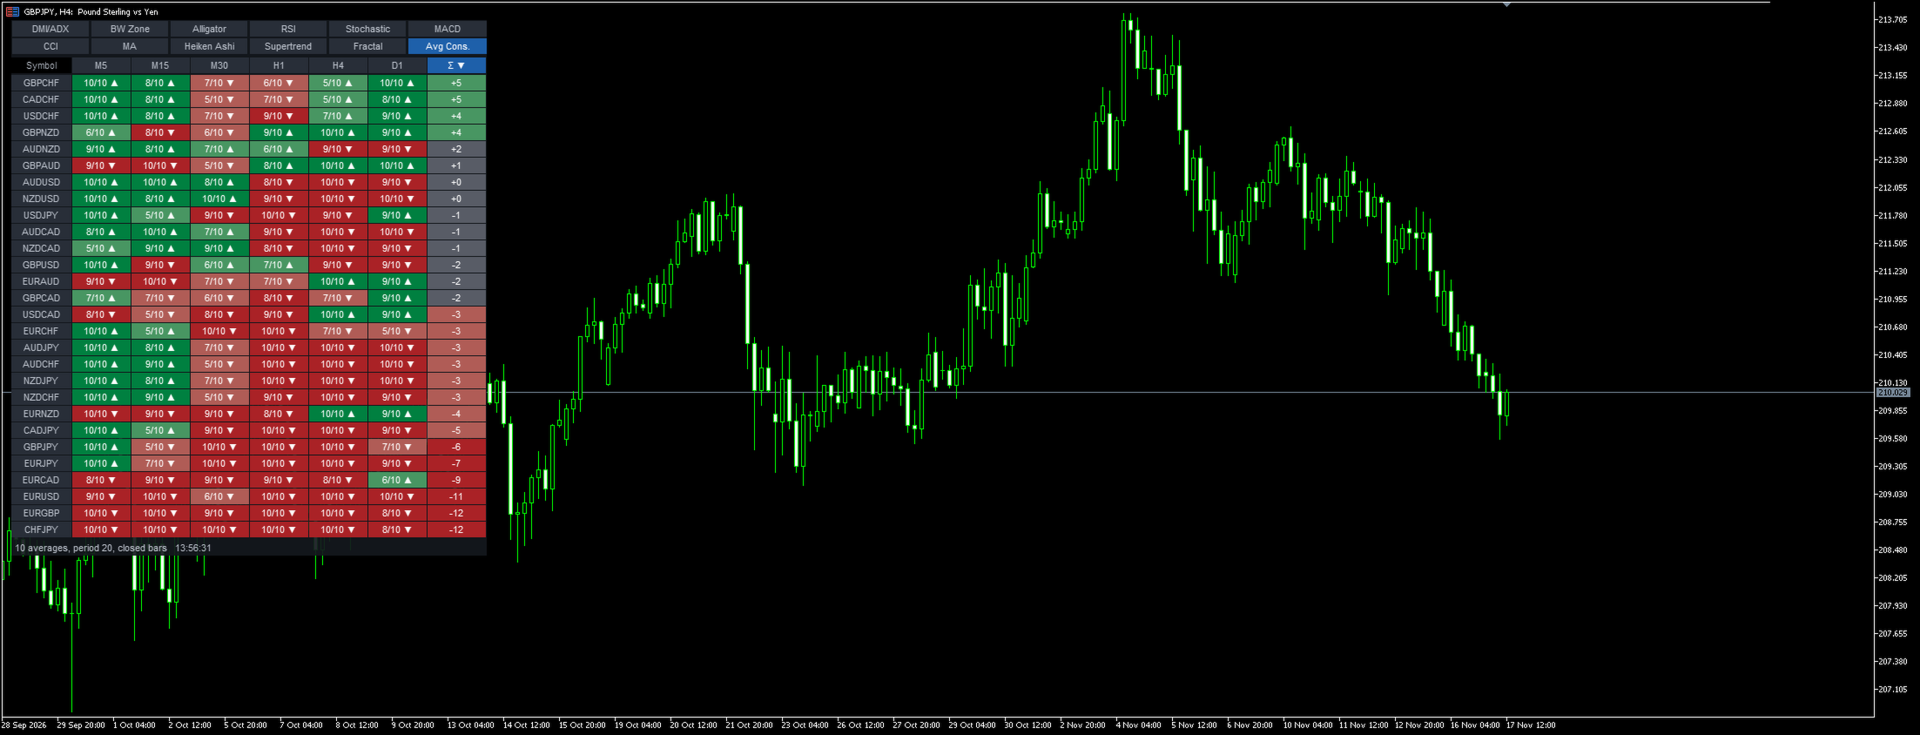
- Averages consensus (period 20). Ten moving averages from the Averages Consensus indicator (SMA, LWMA, SineWMA, TriMA, LSMA, HMA, moving median, geometric mean, ILRS, IE/2). Each one counts as rising or falling. Rising minus falling, as a share of ten: 60 % or more is strong, any other majority is weak, a tie is neutral.
The sum column The states of a row are added: +2 for strong up down to -2 for strong down. The colour follows the sum divided by twice the number of timeframes: 0.5 or more strong up, 0.2 or more weak up, mirrored for down, neutral in between. Click the Σ title to sort the rows by the sum.
Working with the panel
- Click a cell to switch the chart to that symbol and timeframe. Click a symbol name to switch the symbol only, a timeframe title to switch the timeframe only.
- The chosen indicator stays selected when the chart changes this way.
- Symbols: the 28 major and cross pairs by default, or any list you type. Prefix and suffix inputs for broker names such as EURUSD.m. Every symbol is looked up in the broker's symbol list first; symbols the broker does not offer are left out, and the Experts log names them once.
- Timeframes: any of M1, M5, M15, M30, H1, H4, D1, W1, MN (default M5, M15, H1, H4, D1, W1).
- Cell size, font, all colours, opacity, corner and position are inputs. All parameters of the twelve indicators are inputs as well.
Alerts
- When a cell changes state, and/or when the sum of a row changes state. Pop-up, sound or push notification. Several changes at the same moment come as one message.
- Alerts are for the indicator currently shown on the panel.