Streak Solution multi frame
- 指标
-
SISSA TECHNOLOGY
 别再搞那些半吊子的东西和卡顿的网站了。在 SISSA TECHNOLOGY,他们只为追求结果的人写代码。
一方面,他们为你打造锋利无比的 MT4/MT5 专家顾问 (EA) 和指标,保证让你的经纪商狂冒冷汗。既然量身定制的算法能像狙击手一样精准地干脏活,干嘛还要在凌晨 3 点盯着图表熬瞎双眼?
另一方面,他们助你在网络世界起飞。凭借对 NextJS 和 Firebase 外科手术般的精准掌控,他们做出的网站既快速又稳健,甚至在你的客户点击之前就已经加载完毕了。它不仅现代、流畅,应对流量高峰也毫不费力。 - 版本: 53.0
- 激活: 5
STREAK
English EN
STREAK — Put every market move into context
Three bullish candles do not always tell the same story. Their size, their pace and the behaviour of earlier runs can help you understand the movement now taking shape.
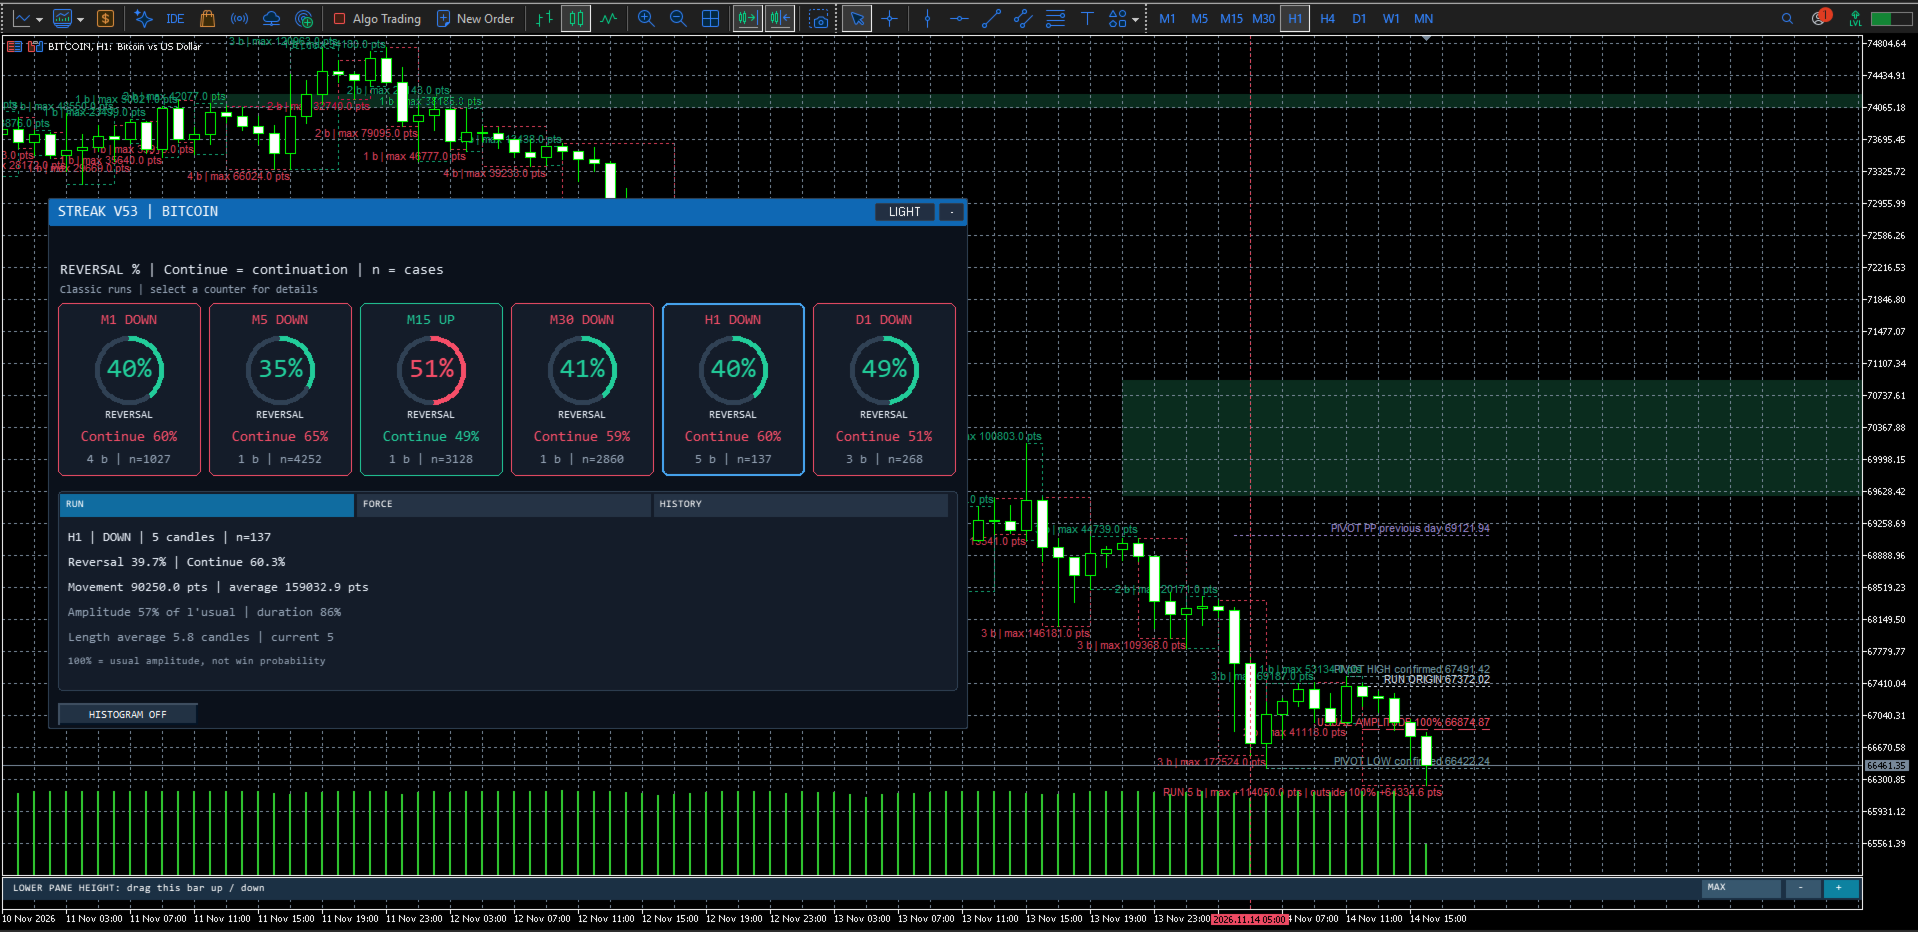
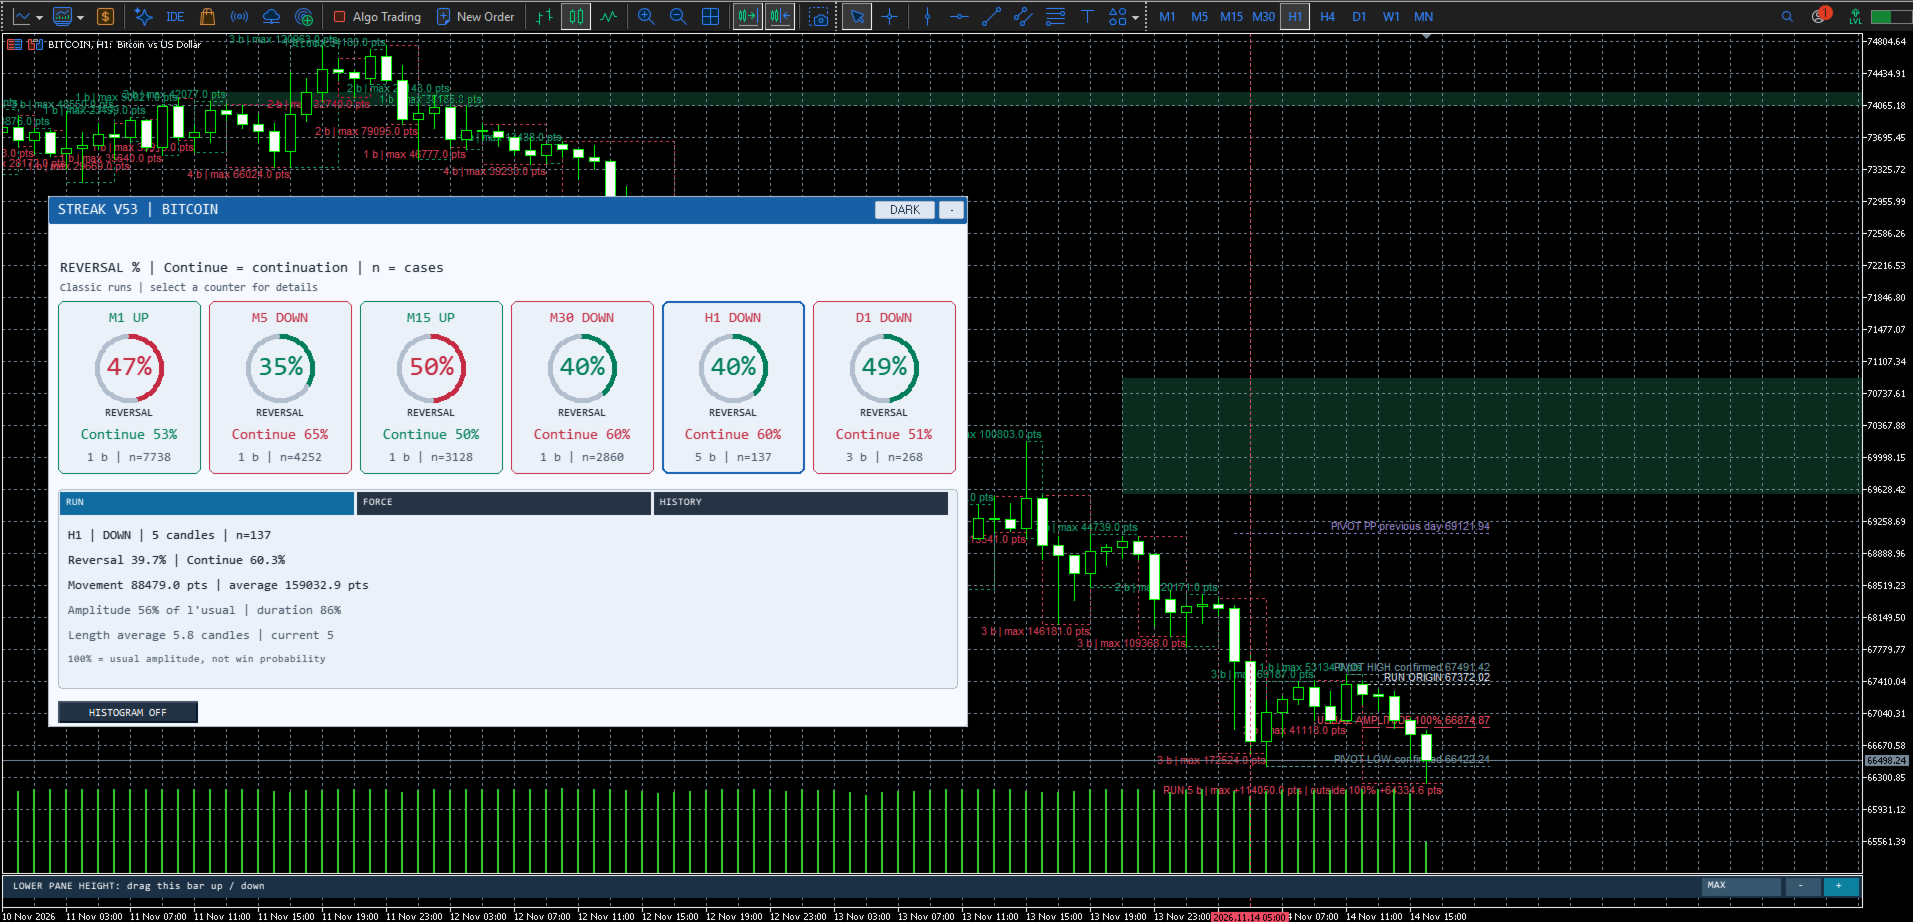
STREAK is a MetaTrader 5 indicator that analyses runs of candles moving in the same direction across several timeframes. It compares the current situation with historical observations to present continuation and reversal estimates, together with the number of available observations.
A clearer reading of percentages
STREAK separates several essential pieces of information:
-
The direction of the current run and its candle count.
-
The reversal estimate and its continuation complement.
-
The size of the movement relative to historical references.
-
Strength, pace and exhaustion indices.
-
The sample size used for each statistic.
A move at 150% of its usual amplitude is not a 150% probability of success. This distinction is central to the way STREAK presents its information.
A display built for comparison
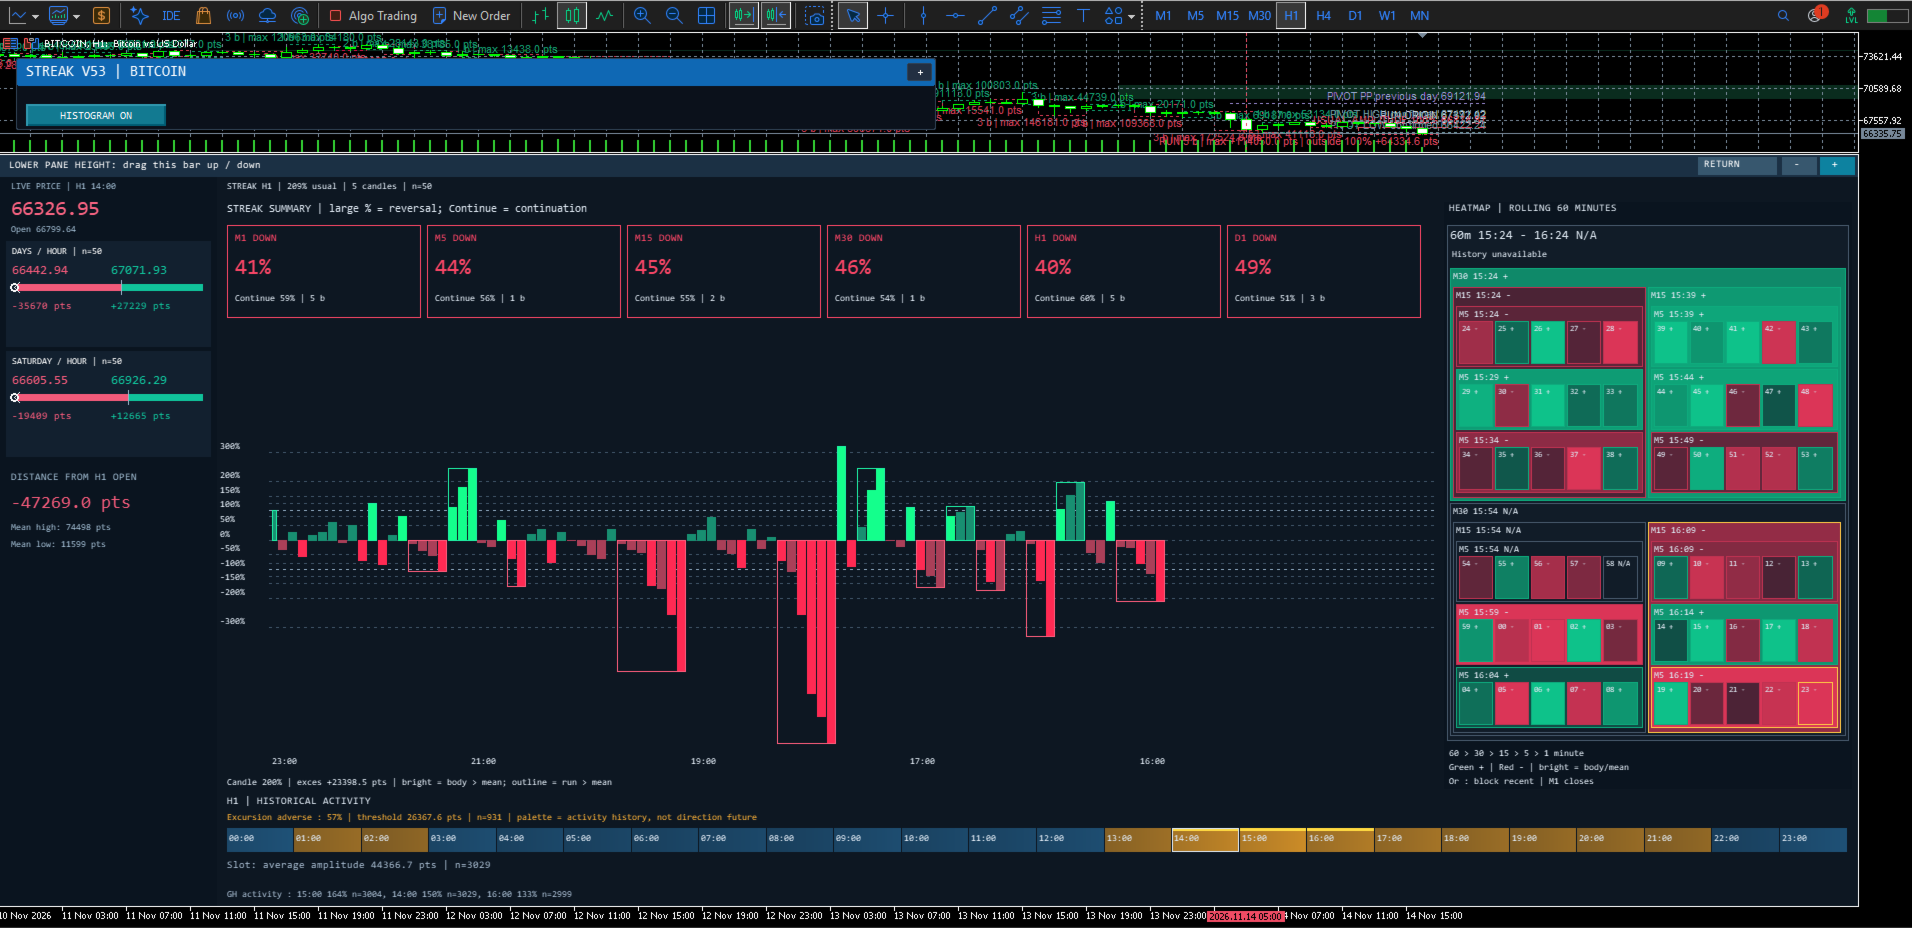
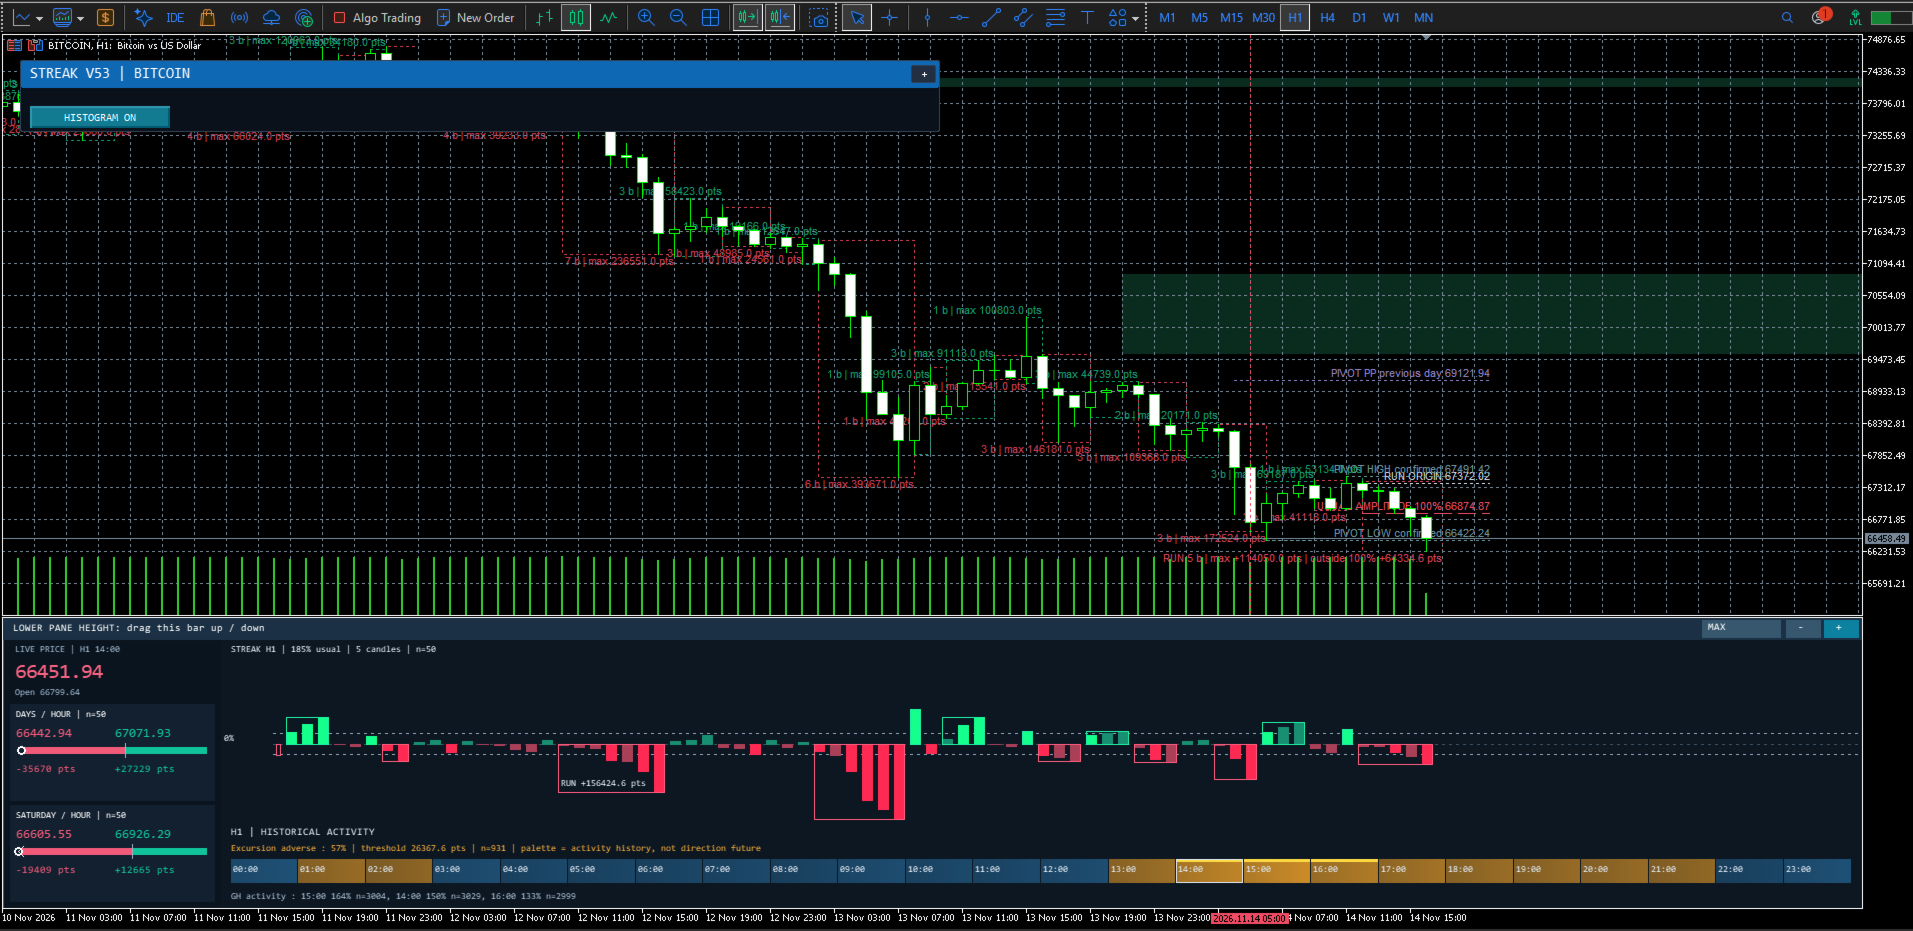
The counters let you monitor up to six timeframes. The histogram shows run movements against percentage reference levels and highlights unusually large amplitudes.
The nested heatmap summarises the latest observed minutes within a rolling hour. It lets you quickly compare movements over different durations without waiting for a new clock hour to begin.
Historical context by time of day
The activity ribbon and time slot comparisons put movements into perspective against those usually observed at the same times. The areas called Golden Hours identify higher historical activity when the available data supports that description.
These areas describe past activity. On their own, they do not predict whether prices will rise or fall.
Who it is for
STREAK is designed for traders who want to understand the strength of a movement, compare several timeframes and distinguish a modest sequence of candles from a substantial impulse.
STREAK is an analytical tool. Its estimates are based on historical observations and model adjustments. They do not guarantee that a movement will continue or reverse, nor do they guarantee any financial outcome. The indicator does not place orders.