Streak Solution multi frame
- 지표
-
SISSA TECHNOLOGY
 Forget dodgy DIY setups and laggy websites. At SISSA TECHNOLOGY, they code for those who want results.
- 버전: 53.0
- 활성화: 5
STREAK
English EN
STREAK — Put every market move into context
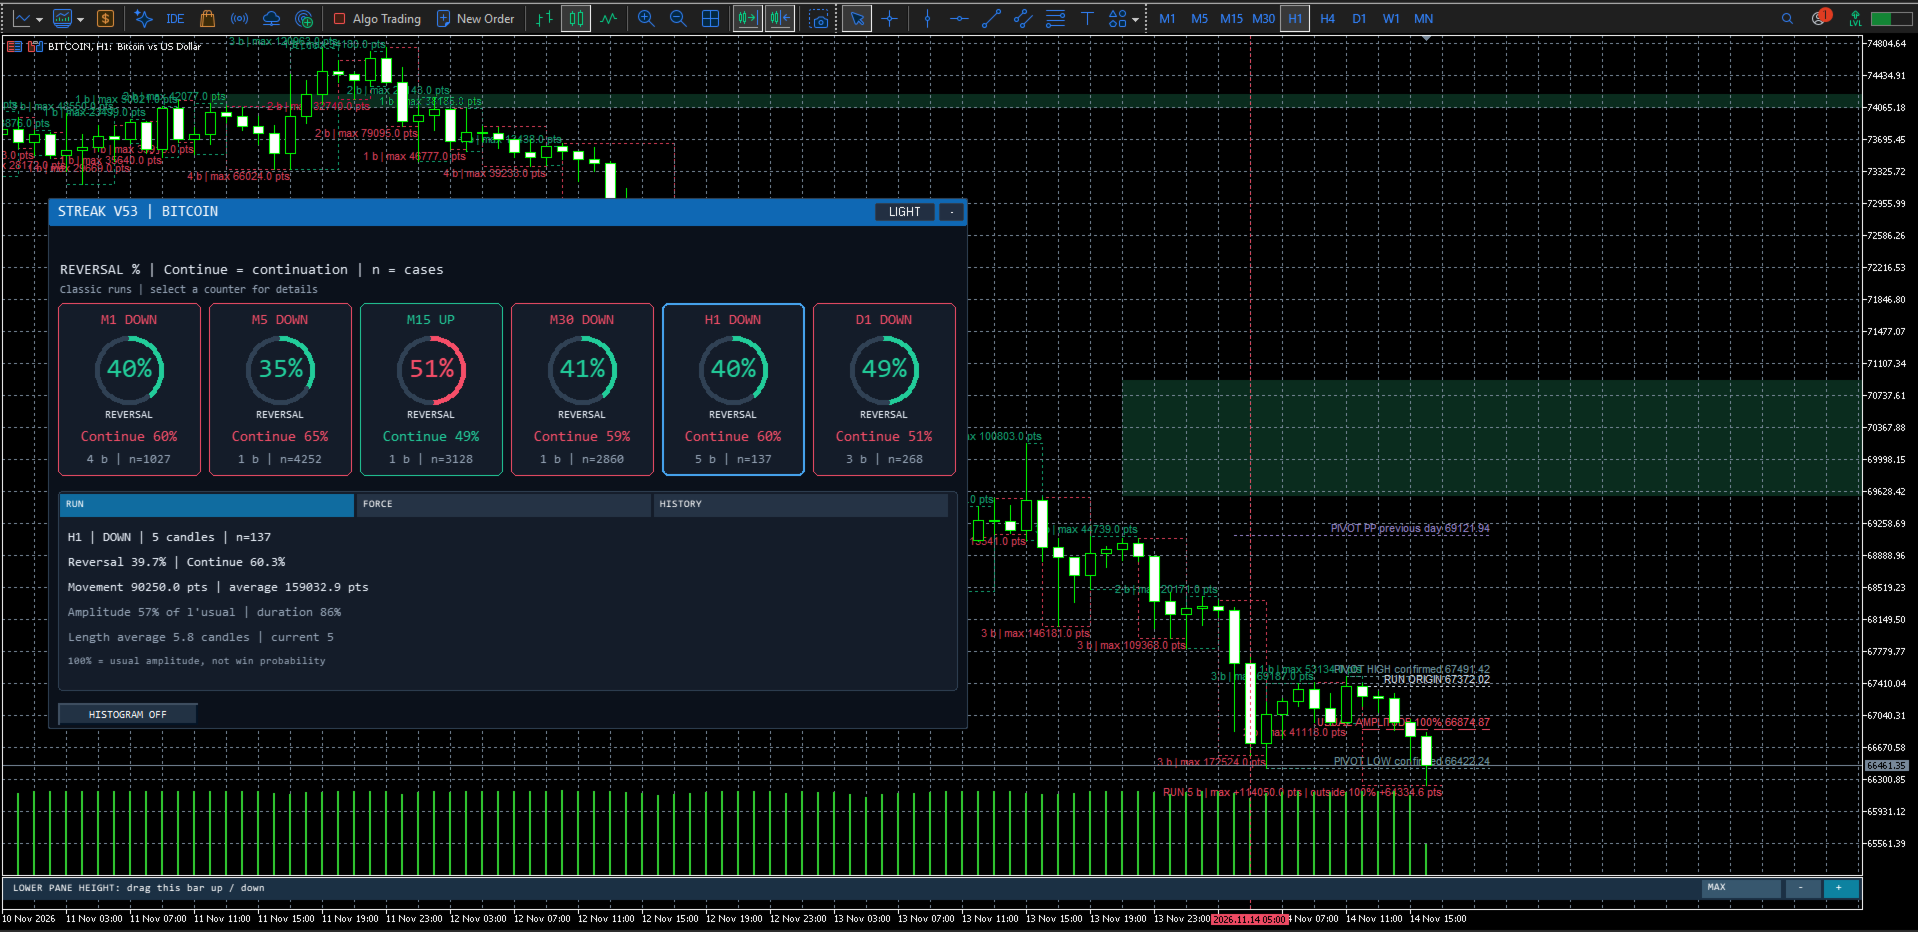
Three bullish candles do not always tell the same story. Their size, their pace and the behaviour of earlier runs can help you understand the movement now taking shape.
STREAK is a MetaTrader 5 indicator that analyses runs of candles moving in the same direction across several timeframes. It compares the current situation with historical observations to present continuation and reversal estimates, together with the number of available observations.
A clearer reading of percentages
STREAK separates several essential pieces of information:
-
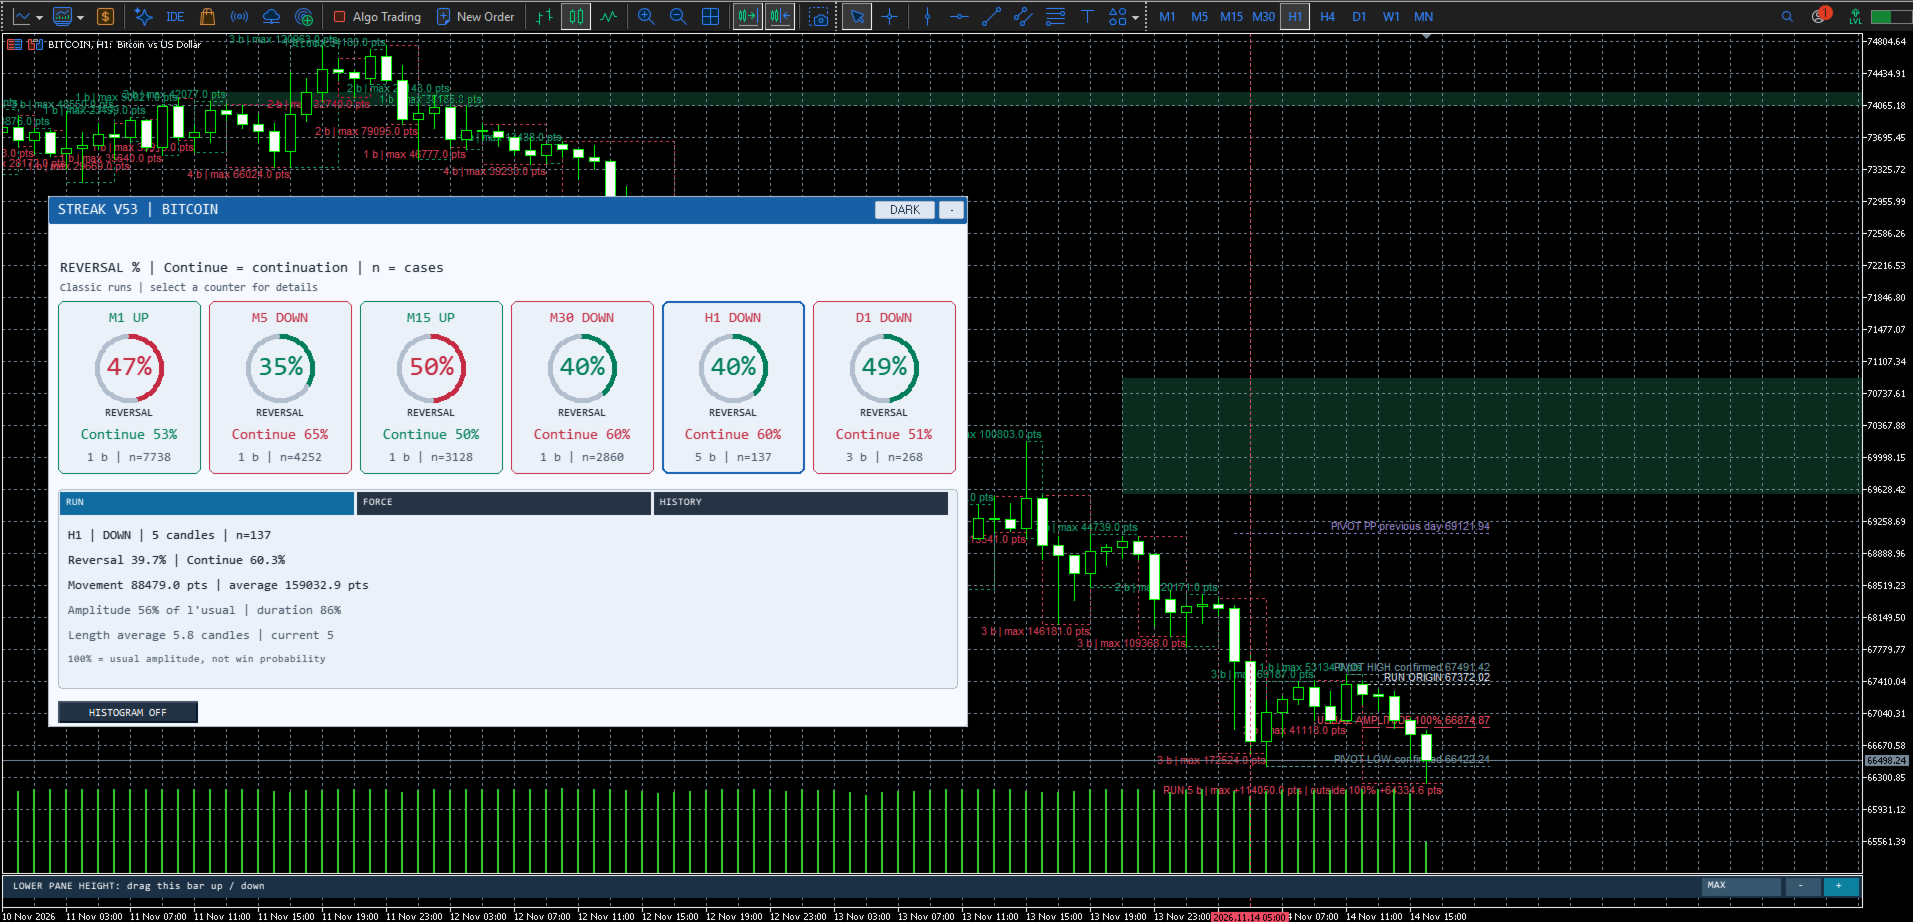
The direction of the current run and its candle count.
-
The reversal estimate and its continuation complement.
-
The size of the movement relative to historical references.
-
Strength, pace and exhaustion indices.
-
The sample size used for each statistic.
A move at 150% of its usual amplitude is not a 150% probability of success. This distinction is central to the way STREAK presents its information.
A display built for comparison
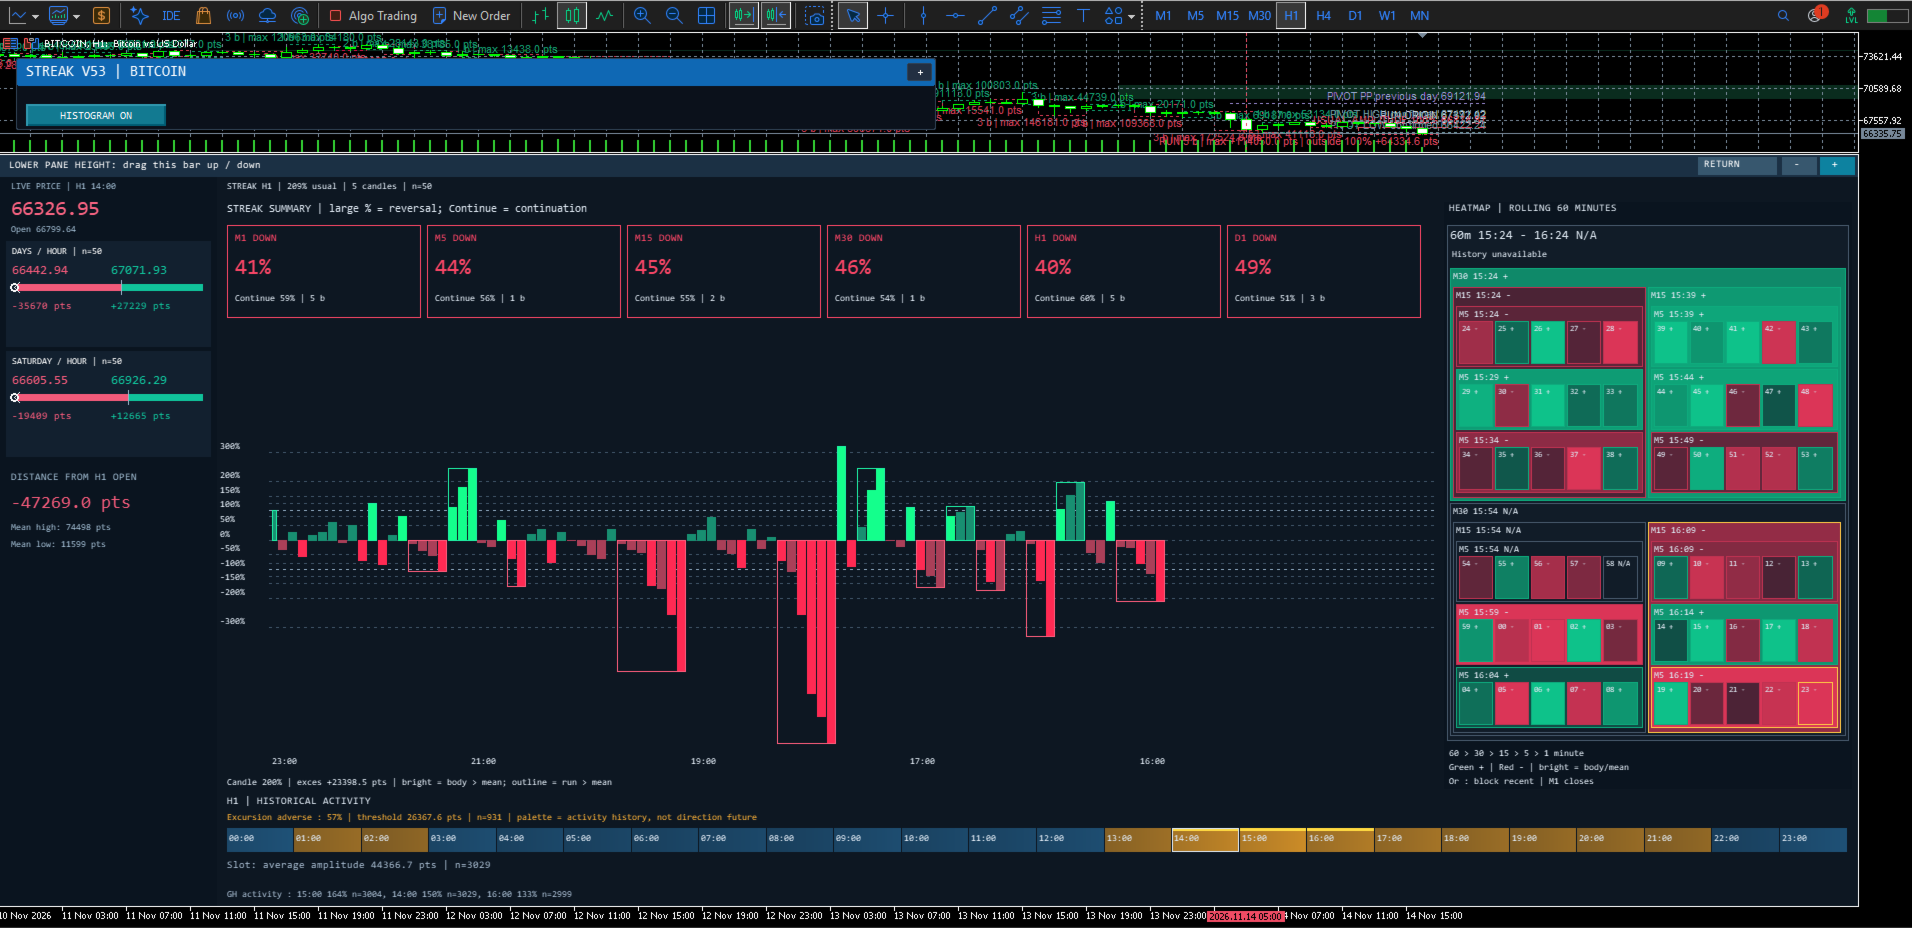
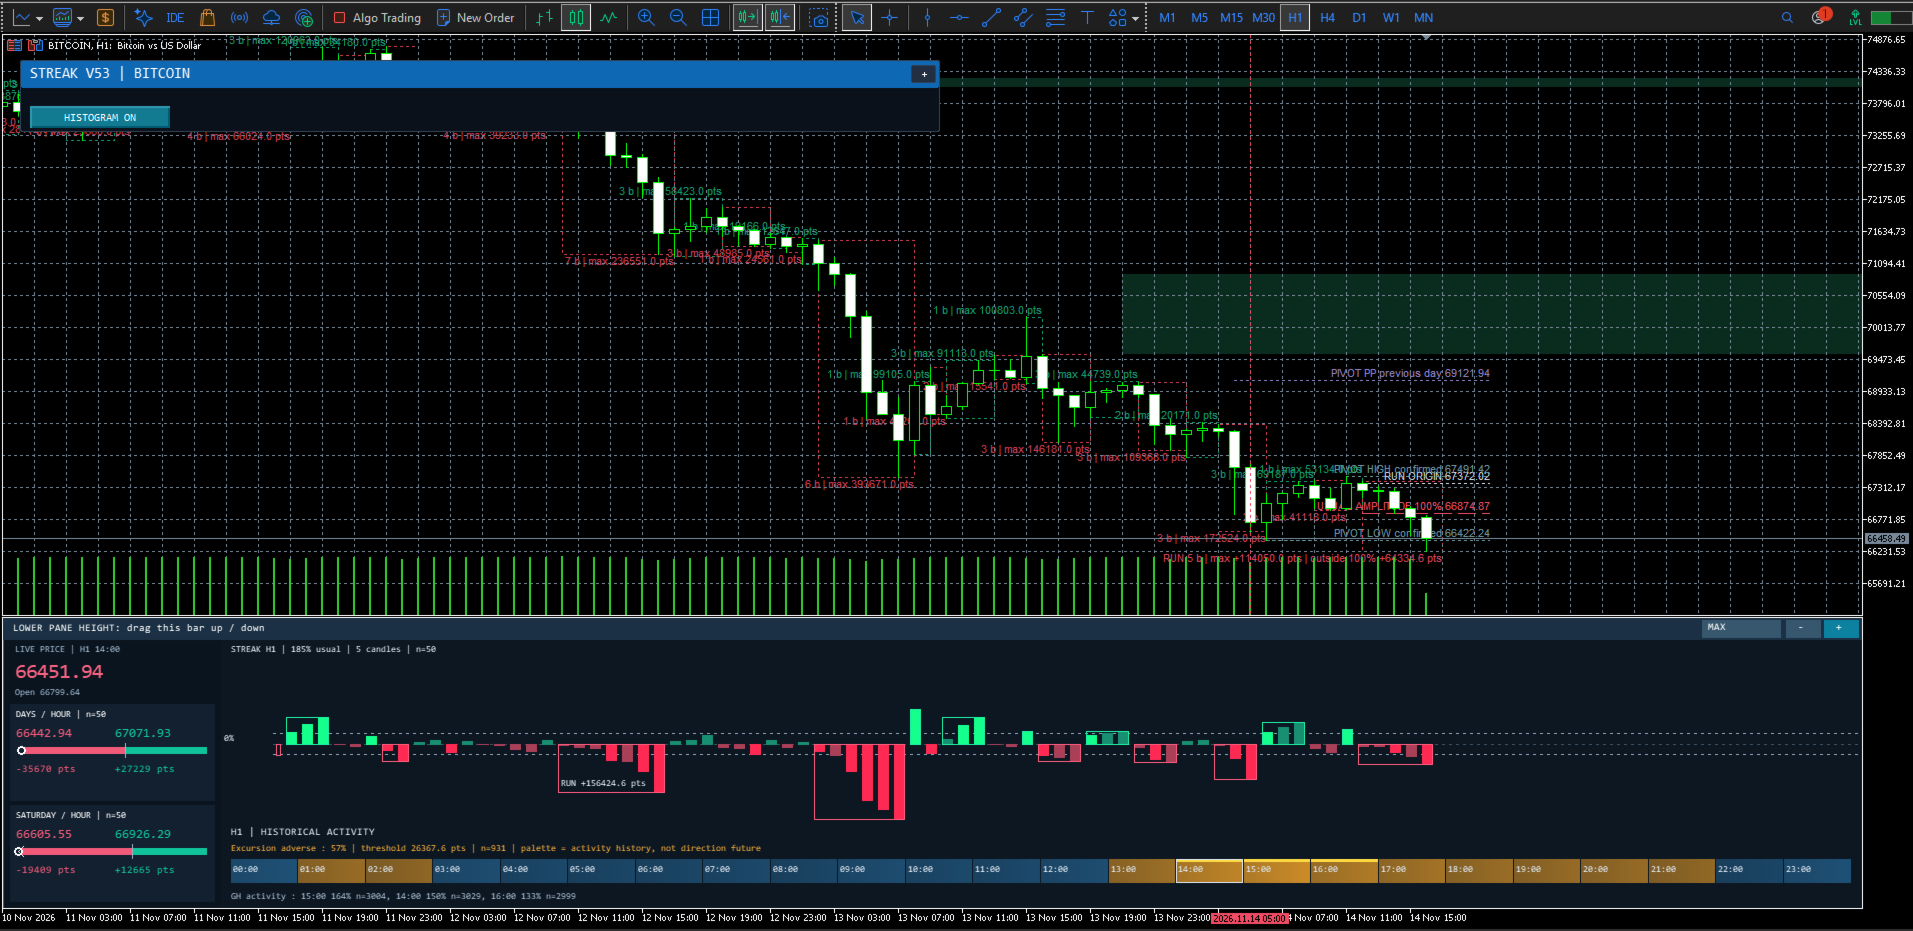
The counters let you monitor up to six timeframes. The histogram shows run movements against percentage reference levels and highlights unusually large amplitudes.
The nested heatmap summarises the latest observed minutes within a rolling hour. It lets you quickly compare movements over different durations without waiting for a new clock hour to begin.
Historical context by time of day
The activity ribbon and time slot comparisons put movements into perspective against those usually observed at the same times. The areas called Golden Hours identify higher historical activity when the available data supports that description.
These areas describe past activity. On their own, they do not predict whether prices will rise or fall.
Who it is for
STREAK is designed for traders who want to understand the strength of a movement, compare several timeframes and distinguish a modest sequence of candles from a substantial impulse.
STREAK is an analytical tool. Its estimates are based on historical observations and model adjustments. They do not guarantee that a movement will continue or reverse, nor do they guarantee any financial outcome. The indicator does not place orders.