MultiTF Step Stairs

MultiTF Step Stairs: multi-timeframe step trailing line with trend-filtered signals

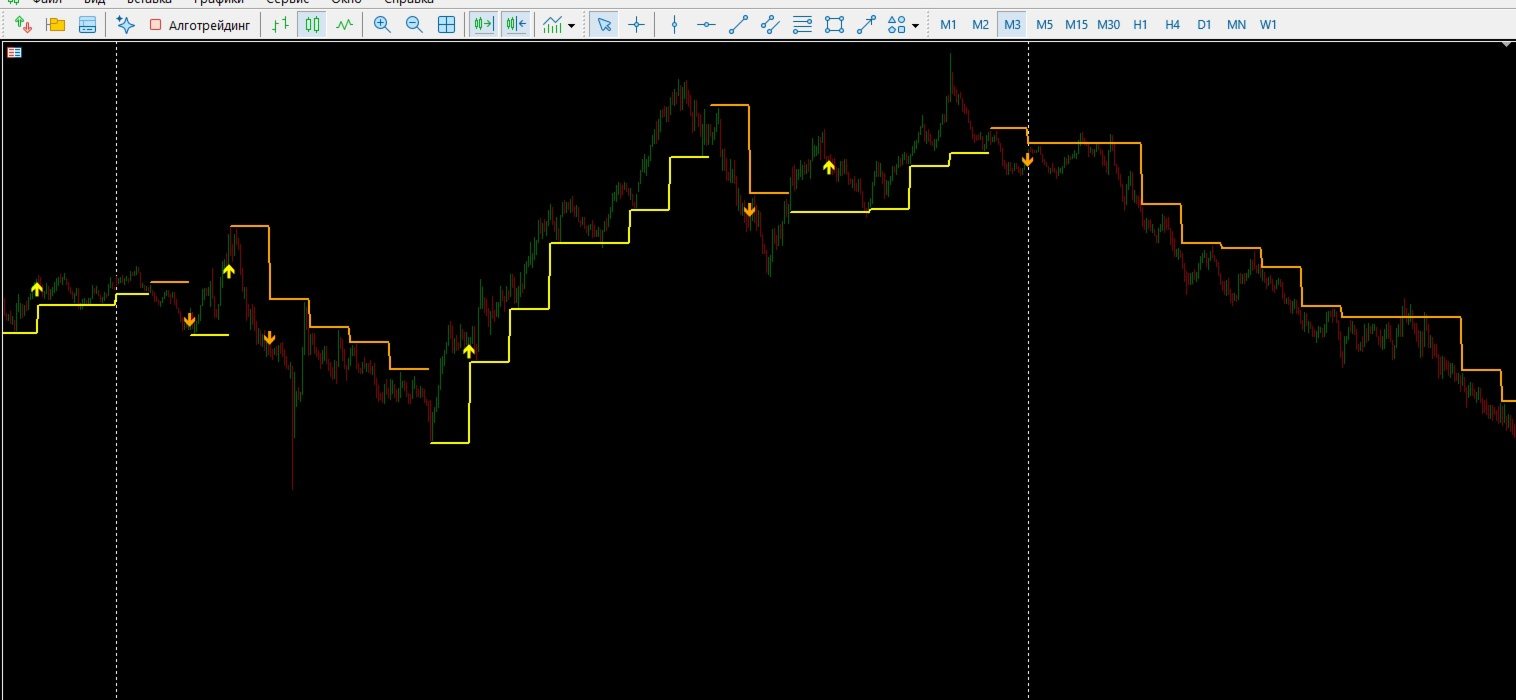
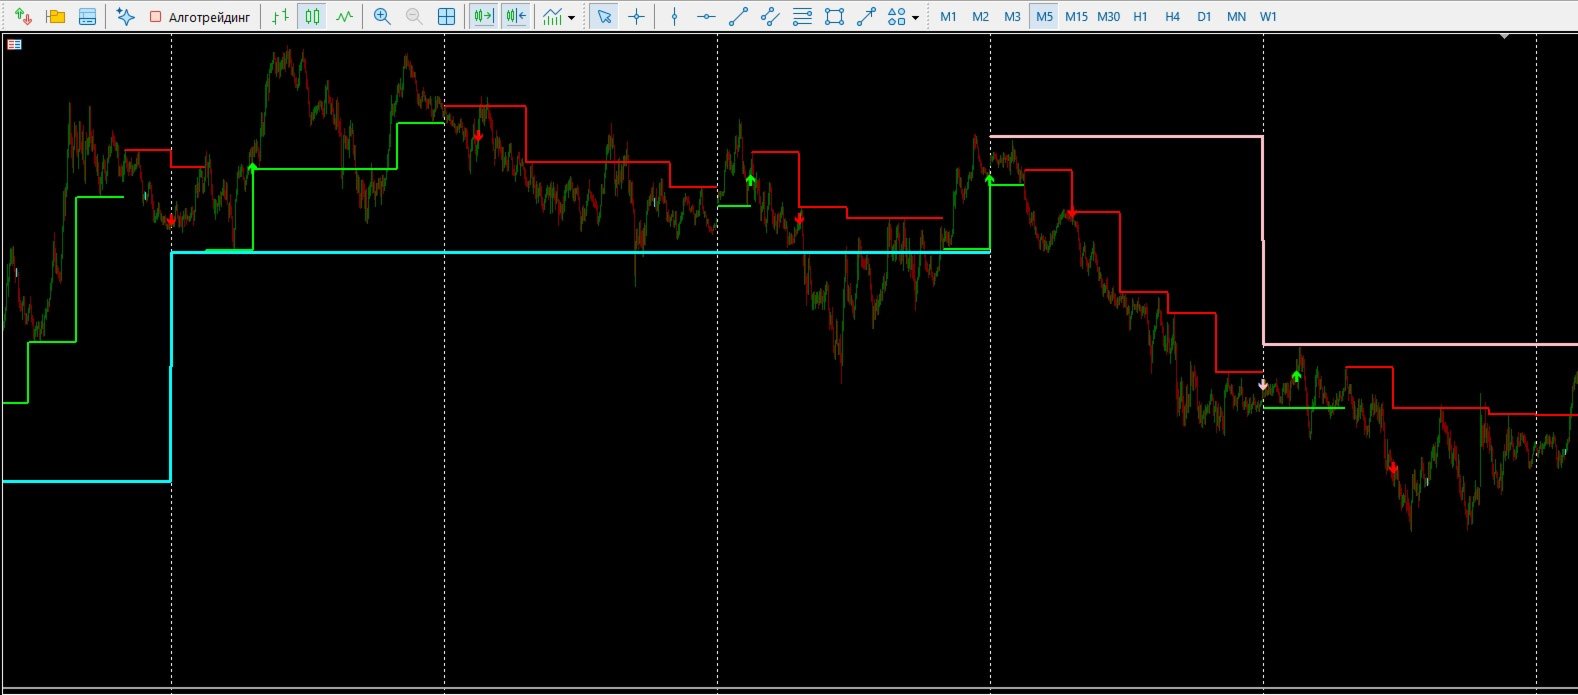
MultiTF Step Stairs draws a step-like trailing line (a “staircase”) for up to four timeframes at once and shows it on any chart. Each line follows the trend, stays below price in an uptrend and above price in a downtrend, and moves only in the direction of the trend. When a bar of the selected timeframe closes beyond the line, the staircase flips, changes color, and an arrow is drawn on the candle where the cross happened.

Key features

  • Up to 4 independent staircases, each with its own timeframe, step size (in points), colors and line width.
  • Each staircase is calculated on the bars of its own timeframe and then projected onto the chart. Levels, steps and signals are identical on M15, M5, M1 and any other chart period, with no shift.
  • Signal arrows are drawn on the candle where the cross occurred. On lower chart periods the arrow is placed on the last candle inside the higher-timeframe bar, so it matches the bar close.
  • Non-repainting mode ( ConfirmOnClose ): a cross is registered only on the close of a higher-timeframe bar. Switch it off if you prefer earlier, intrabar signals.
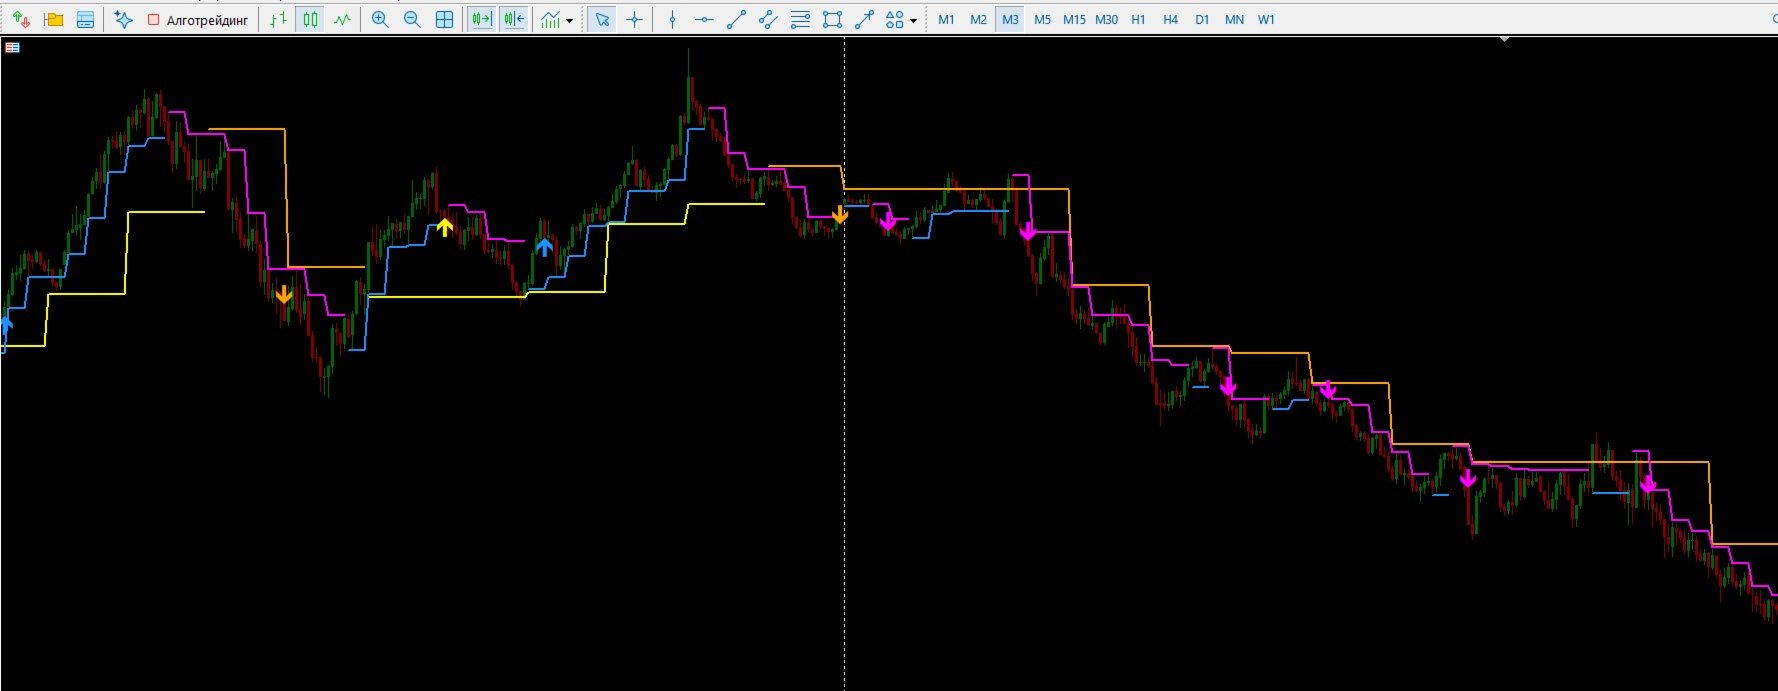
  • Trend filter: arrows of the lower timeframes are shown only in the direction of the master timeframe (for example, M15 buy arrows only while the H1 staircase is up). The master direction is taken from its last closed bar, with no look-ahead.
  • Alerts (popup, sound, push, email) fire once per new arrow, with a message such as XAUUSD M1: TF2 (M15) BUY, with H1 trend .

Typical use
Set TF1 = H1 as the master and TF2 = M15. Work on a lower chart and look for M15 arrows in the direction of the H1 staircase, so an entry after a pullback is aligned with both trends.

Inputs

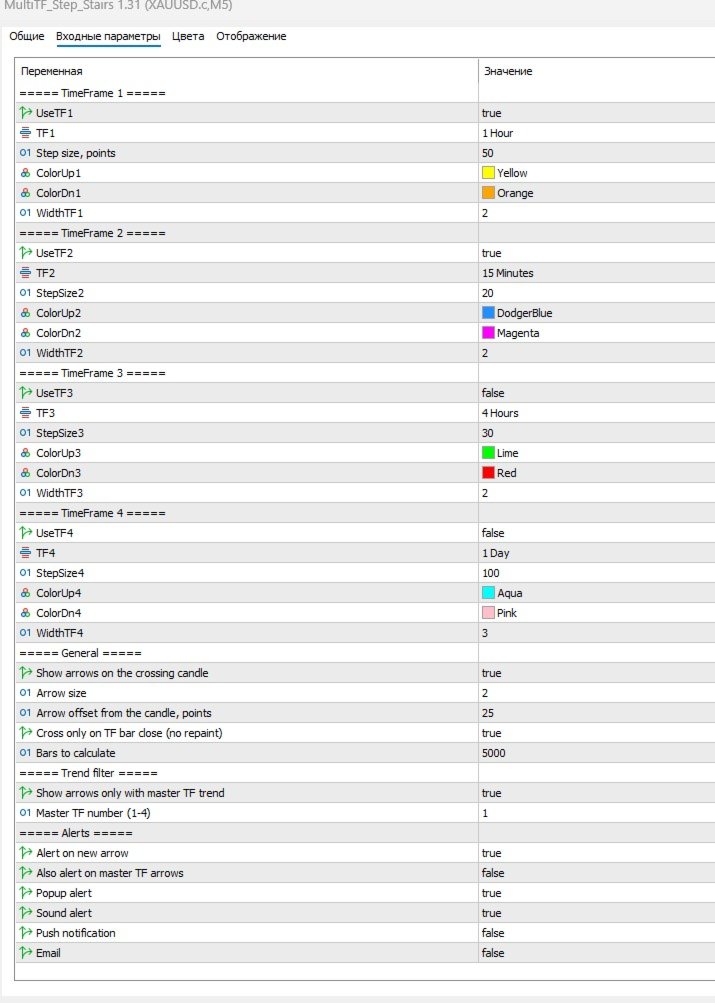
  • TimeFrame 1–4: enable, timeframe, step size (points), up/down colors, line width.
  • General: show arrows, arrow size and offset, ConfirmOnClose , number of bars to calculate.
  • Trend filter: ArrowFilter , FilterMaster (1–4).
  • Alerts: enable, popup, sound, push, email, alert on master arrows.

Notes

  • If a selected timeframe is lower than the chart period, the chart period is used for that staircase.
  • The indicator draws lines and arrows only. It does not place trades.
  • Past signals are not a guarantee of future results. Test on a demo account first.
作者的更多信息
Volume Smart Perfect — 专业日内成交量与反转结构指标 您是否厌倦了那些在图表上画满横线、一直延伸到历史深处、让复盘变成一场灾难的指标? Volume Smart Perfect 带来了一种全新的市场分析方法。它将隐藏的「报价棒(Tick Volume)爆发检测」、「动态市场噪点过滤」以及「最新关键支撑/阻力位自动绘制」完美融合。 本指标专为高效率的日内交易(剥头皮 Scalping、日内波段 Day-trading)而设计,高度契合 黄金 (XAUUSD) 、主流外汇货币对以及各类股指等高波动性品种。  核心逻辑:它是如何运作的? 该指标通过两个独立模块的深度协同来捕捉行情:副图的 Smart Volume(智能成交量) 与主图的 Perfect Levels(完美水平线) 。 真实动能分析: 在副图窗口中,移动平均线(Volume MA)会动态计算指定周期内的平均成交量。一旦市场中有机构大资金介入,指标便会用特殊颜色高亮显示该K线( High Volume Alert / 巨量预警 )。 局部极端高低点算法: 指标利用自适应市场噪点过滤器(Fractal Per
用户指南:Custom Regression Signals MT5 Custom Regression Signals 是一款专为 MetaTrader 5 设计的专业技术分析工具。它利用线性回归(Linear Regression)数学方法构建动态价格通道。与标准的静态通道不同,该指标能主动分析价格动态,帮助交易者识别市场是处于活跃趋势还是侧向(横盘)震荡阶段。 1. 指标工作原理 指标根据设定的回顾周期构建通道,并根据当前市场阶段自动更改颜色: 绿色通道(牛市趋势): 价格稳步上涨。在此阶段,指标会过滤信号,仅在通道下边界产生**买入(BUY)**信号。 红色通道(熊市趋势): 价格稳步下跌。在此阶段,指标仅在通道上边界产生**卖出(SELL)**信号。 灰色通道(横盘/震荡): 市场处于侧向移动。在此阶段,允许在通道上下边界进行双向交易(均值回归)。 2. 交易信号 当价格超出计算出的回归通道边界时,指标会在图表上显示箭头: 向上箭头(绿色/灰色): 买入信号。相对于回归线,价格被视为超卖。 向下箭头(红色/灰色): 卖出信号。相对于回归线,价格被视为超买。 重要提示: 该指标
FREE
Delta Professional System — 专业级全自动交易系统 Delta Professional System 是一款集成了订单流分析(累积成交量 Delta)与基于移动平均线(MA)的高级趋势过滤器的强大分析工具。该指标专为那些希望洞察价格背后真实市场意图、寻找由数学趋势模型确认的买卖双方真实力量平衡的交易者而设计。  核心信号过滤逻辑 成交量指标最大的痛点是震荡市中的“噪音”。 Delta Pro System 通过三重验证逻辑完美解决了这一问题: Delta 动能分析: 算法分析滴答成交量(Tick Volume)与价格行为,识别异常的资金累积(自定义阈值)。 MA 距离过滤(动态区间): 通过双指数移动平均线(EMA)确定趋势的“黄金地带”。如果价格离均线过近(平庸期)或过远(过热/回调风险),信号将被自动过滤。 趋势斜率检测: 指标会检查趋势是否具有真正的加速度。只有当快速 EMA 以特定且健康的斜率运行时,才会触发买入信号。  关键输入参数 Delta Lookback: 计算累积交易意图的周期深度。 Delta Threshold: 信号灵敏度设置,用
Pure Trend Logic
Evgenii Savinov
Pure Trend Logic MT5 — Профессиональный алгоритм следования за трендом Pure Trend Logic MT5 — это воплощение классической торговой стратегии в современной интерактивной оболочке. Индикатор предназначен для трейдеров, которые ценят чистоту графиков и математическую точность. Система объединяет три уровня анализа цены, позволяя находить точки входа с математическим преимуществом. ### Философия индикатора: В основе лежит «золотое правило» трейдинга: торгуй по направлению основного потока. Мы взяли
FREE
Session Breakout Master is a high-performance trading tool designed to capture explosive moves following the breakout of major trading session ranges (Asia, Europe, and USA). It automatically visualizes volatility zones and utilizes a Moving Average filter to ensure you stay on the right side of the market trend. Key Features: Automated Session Mapping: No more manual drawing. The indicator identifies and plots Asia, Europe, and USA session boxes automatically. Trend Filtering: Built-in MA filte
FREE
Account Monitor Pro — Your Ultimate Trade Statistics Hub Account Monitor Pro is a professional information dashboard designed for traders who combine Expert Advisors (EAs) and manual trading. The indicator separates statistics in real-time based on your Magic Number, allowing you to clearly see who is driving the profit: the algorithm or yourself. Key Features: Split Monitoring: Instant separation of "Robot" positions (by Magic Number) and "Manual" trades. Multi-language Support: 11 languages in
FREE
BosMaster
Evgenii Savinov
Title: BOS MASTER MT5 Description: BOS MASTER is a professional analytical tool based on the Smart Money Concepts (SMC) . The indicator automatically detects and marks Break of Structure (BOS) , helping traders identify changes in market direction and trend shifts with high precision. Key Features: Automatic BOS Detection: Scans the chart for key highs and lows and highlights the exact moment of a structure break. Interactive Filter Button: Switch directly on the chart between "Body Break" (cons
PulseGuard MT5 是一款专为追求高胜率交易者设计的专业级技术分析工具。它将经典的价格趋势跟随策略(均线系统)与市场动能振荡指标(MACD)完美融合,旨在为交易者提供最精准的顺势入场时机。  核心技术优势: 信号零重绘 (Zero Repaint): 所有信号均在蜡烛图收盘时确认并锁定。一旦信号出现,绝不会因为价格波动而消失或漂移,这为历史回测提供了真实可靠的数据。 双重逻辑过滤: 结合了长期趋势过滤与中期动能确认。这种设计能有效过滤掉震荡行情中的大部分噪音,确保每一笔交易都建立在强劲的市场共识之上。 全方位预警系统: 内置实时桌面音频提醒及移动端 Push 推送功能。无论您身在何处,只要手机在手,绝不会错过任何一个重要的交易机会。 极简视觉设计: 界面清晰直观。绿色箭头代表买入动能,红色箭头代表卖出动能,非常适合多品种、多周期的即时监控。  深度工作原理: 长期趋势判定 (SMA Filter): 我们采用了机构级别常用的 50 周期和 200 周期移动平均线。当  MA 运行在  MA 之上时,系统锁定为牛市思维,仅显示买入信号;反之则锁定为熊市思维,仅显示卖出信号。 精
Williams Chaos Strategy —— 威廉希尔混沌交易策略 Williams Chaos Strategy 是一款基于比尔·威廉姆斯(Bill Williams)经典指标组合(鳄鱼线 Alligator、分形 Fractals、动量真意指标 AO 和加速震荡指标 AC)协同增强开发的专业交易工具。我们采用了这套传奇交易系统,并针对当今高波动性市场(尤其是 黄金 XAUUSD )进行了深度优化。 为什么选择这款指标? 100% 无重绘 (No-Repaint): 信号在蜡烛收盘时固定。一旦箭头出现,它将永久保留,绝不消失或跳动。 三重过滤机制: 只有当价格突破分形水平、鳄鱼线“觉醒”且驱动力(AO+AC)确认动能大爆发时,指标才会发出信号。 极强的通用性: 算法会自动根据不同的时间周期调整搜索深度——从 M5 的超短线头寸到 H4 和 D1 的趋势持仓交易。 简洁直观的图表: 您无需让繁杂的指标占据屏幕,只需关注清晰的入场箭头,助您做出果断决策。 如何交易? 绿色箭头: 当鳄鱼线开启且处于“绿色区域”时,向上突破分形水平。**买入(Buy)**的理想时机。 红色箭头:
Pulse Range Navigator Pro
Evgenii Savinov
5 (1)
Pulse Range Navigator Pro 副标题:自适应动量与智能趋势过滤系统 Pulse Range Navigator Pro 是一款专为趋势追踪开发的交易系统。它旨在高效过滤市场盘整(震荡市)期间的虚假突破,并精准捕捉价格恢复定向趋势时的核心入场点。 本指标的核心在于将经典的 唐奇安通道(Donchian Channel) 波动率突破机制与 双重平滑动量振荡器 完美结合,实现强强联手。  核心逻辑与工作原理 本指标绝不尝试预测市场的顶部或底部,而是遵循以下原则: 在已确立的大周期趋势方向内,捕捉经过确认的动量入场信号。 全局趋势过滤器(Donchian Channel): 系统通过较长的回溯周期(默认参数为 114 )来追踪市场极值。当价格突破上轨时,趋势转为牛市( UP );当价格跌破下轨时,趋势转为熊市( DOWN )。趋势状态一旦锁定,在发生反向突破前将保持不变,确保基准信号 绝对不重绘(No Repaint) 。 动量触发器(Smooth Momentum Index): 传统的振荡指标往往充满市场噪音。为了解决这一痛点,本算法先提取平滑移动平均线( iMA
MA RSI Trend Precision:您的专业趋势导航仪 MA RSI Trend Precision 不仅仅是一个普通的“箭头信号”指标。它是一个强大的分析套件,结合了移动平均线(MA)的经典可靠性、RSI 的动量确认以及独特的 斜率过滤(Slope Filter) 算法,有效减少市场噪音。  为什么选择这款指标? 趋势指标面临的最大挑战是市场盘整(横盘)期间的“反复洗盘”效应。 MA RSI Trend Precision 解决了这个问题。当趋势减弱时,指标线会变为灰色;只有当真正的市场力量出现时,才会切换为充满活力的蓝色或红色。  适用于各种交易风格的灵活性 该工具具有完全的自适应性,可轻松满足您的特定交易目标: 超短线/头皮交易 (M1-M5): 设置较短的 MA 周期(例如 21 和 50)。 利用 RSI 过滤器捕捉快速的日内动量变化。 结果: 在较小的时间周期内获得精准的入场点。 日内交易 (H1): 使用标准设置(50 和 100)。 调整 Min Slope (最小斜率)过滤器,仅捕捉最强劲的交易时段。 波段交易与投资 (H4-D1): 增加 MA 周期以过
RiskMaster Management Console — Your Professional Risk Manager for MT5 RiskMaster Management Console is a high-performance trading panel designed for traders who prioritize discipline, speed, and rock-solid risk management. Stop wasting time on manual lot calculations and clunky MetaTrader 5 order windows. Now, your entire capital management fits into a single, intuitive click.  Why Choose RiskMaster? Precision Lot Calculation (Risk %): Simply set your desired risk percentage (e.g., 1% of balan
Has rsi signal
Evgenii Savinov
HAS RSI Signal — 带有止损/止盈计算的专业趋势指标 HAS RSI Signal 是一款强大的交易工具,结合了经典指标与现代噪声过滤算法。该指标通过 Heiken Ashi Smoothed (HAS) 平滑蜡烛图和 RSI 震荡指标进行市场分析,在趋势反转或价格退出超买/超卖区域时,为交易者提供清晰的人场信号。 主要优势: 双重过滤: 使用 Heiken Ashi Smoothed 算法消除市场“噪音”,同时通过 RSI 确认动能强度。 自动计算点位: 指标不仅提供信号,还会根据当前市场波动率 (ATR) 自动计算 止损 (Stop Loss) 和 止盈 (Take Profit) 点位。 视觉直观: 信号以彩色蜡烛图的形式直接显示在主图表上,保持交易界面的整洁有序。 多维度通知: 内置终端弹窗警报、声音提示以及手机推送通知 (Push),确保您不会错过任何交易机会。 核心原理: 指标持续监控 RSI 的极端区域。当价格离开临界区且 HAS 算法确认方向转变时,即生成交易信号。ATR 参数允许止损和止盈根据市场当前的波动性进行动态调整。 核心参数设置: InpPeri
TDI Trend Filtered - Revived Classic with Trend Filter  Description The Traders Dynamic Index (TDI) is a legendary indicator developed by trader Dean Malone, used by professionals in financial markets for decades. It is a powerful multi-functional tool that combines the elements of RSI, moving averages, and Bollinger Bands volatility. Unfairly forgotten in recent years, this indicator is getting a second wind in our modernized version. We have added a Trend Filter based on a Moving Average , whi
Gann Matrix Pro
Evgenii Savinov
Here is the English description for your MQL5 publication or repository: Gann Matrix Pro + Levels & Alerts Indicator is an analytical tool for MetaTrader 5 designed to automatically or manually project price and time targets based on W.D. Gann's core balancing principles (Square of 9 / Price-Time Equilibrium). The indicator measures impulse geometry, projects a dynamic ray fan, identifies future time reversal points, and draws static horizontal support/resistance levels with customizable alerts.
ElliottWave Pro
Evgenii Savinov
ElliottWave Pro — Automatic Wave 2 Detection and Wave 3 Targets An indicator for MetaTrader 5 that automates Elliott Wave and Fibonacci analysis. ElliottWave Pro detects the end of the first impulse (Wave 1), calculates the corrective zone (Wave 2) and draws a ready-to-use trading setup with Stop Loss and Take Profit levels. Key Features Automatic Wave 1 detection: connects points P0 and P1 to show the trend structure. Wave 2 entry zone: a rectangular retracement zone with Fibonacci levels 38.2%
Volume Divergence & RSI HTF Scanner Short Description: Advanced counter-trend indicator detecting price and volume divergences filtered by RSI momentum and Multi-Timeframe S/R levels. Full Description: Volume Divergence & RSI HTF Scanner is a powerful trading assistant designed to identify high-probability counter-trend reversals and exhaustion points in real-time. By combining Price-to-Volume divergence with RSI momentum filtering and High-Timeframe (HTF) Support & Resistance levels, this indic
筛选:
无评论
回复评论